Comparison of the efficiency between two sampling plans
for aflatoxins analysis in maize
Adriano Olnei Mallmann
1, Alexandro Marchioro
1, Maurício Schneider Oliveira
1,
Ricardo Hummes Rauber
2, Paulo Dilkin
1, Carlos Augusto Mallmann
1 1Laboratório de Análises Micotoxicológicas, Departamento de Medicina Veterinária Preventiva, Universidade Federal de Santa Maria, Santa Maria, RS, Brazil.
2
Programa de Pós-graduação em Ciências Veterinárias, Universidade Federal do Rio Grande do Sul, Porto Alegre, RS, Brazil.
Submitted: May 29, 2012; Approved: September 9, 2013.
Abstract
Variance and performance of two sampling plans for aflatoxins quantification in maize were evalu-ated. Eight lots of maize were sampled using two plans: manual, using sampling spear for kernels; and automatic, using a continuous flow to collect milled maize. Total variance and sampling, prepa-ration, and analysis variance were determined and compared between plans through multifactor anal-ysis of variance. Four theoretical distribution models were used to compare aflatoxins quantification distributions in eight maize lots. The acceptance and rejection probabilities for a lot under certain af-latoxin concentration were determined using variance and the information on the selected distribu-tion model to build the operadistribu-tional characteristic curves (OC). Sampling and total variance were lower at the automatic plan. The OC curve from the automatic plan reduced both consumer and pro-ducer risks in comparison to the manual plan. The automatic plan is more efficient than the manual one because it expresses more accurately the real aflatoxin contamination in maize.
Key words:mycotoxins, variance, error, characteristic operation curve,Zea mays.
Introduction
Aflatoxins are secondary metabolites from certain fungal lineages of theAspergillusgenus, mainlyA. flavus andA. parasiticus. Aflatoxins B1, B2, G1, and G2are natural contaminants of seeds and feed, mainly nuts, peanuts, cot-ton seeds, maize, and other oilseeds (Sweeney and Dobson, 1998; Strokaet al., 2000).
Obtaining trustable results on mycotoxins analysis in feed is important for management and mycotoxicological control purposes (Krskaet al., 2005). However, the hetero-geneous distribution of mycotoxins in cereals leads to vari-ations on the final results, so called errors, not being possi-ble to establish the real mycotoxins concentration in a determined lot (Whitaker 2004; Miraglia et al., 2005; Vargaset al., 2006). Thus, the efficiency of a sampling plan can be estimated by the evaluation of the variance of the re-sults generated by the quantification procedures applied.
The probabilities of acceptance or rejection of a lot with certain mycotoxin concentration depend on the perfor-mance of the sampling plan applied (Johansson et al., 2000a; Johanssonet al., 2000c; Miragliaet al., 2008),i.e. the better the performance of the sampling plan, safer the acceptance or rejection probabilities of this lot. To achieve that, it is necessary to establish the procedures for the sam-pling plan, as well as a limit for acceptance/rejection. The quantification procedures can be divided into three stages: 1- Sampling: taking a sample from a lot; 2- Sample prepara-tion: milling the sample to reduce the size of its particles and take a subsample for analysis, and; 3- Analysis: extract the mycotoxin from the subsample and quantify it (Whi-takeret al., 2011).
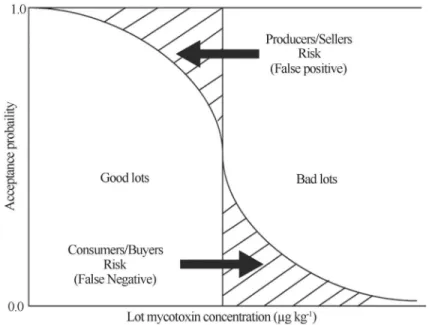
The variance on the quantification results can lead to two kinds of errors: the false positive or producer/seller risk, in which a good lot is labeled as bad, and the false neg-ative or consumer/buyer risk, where a bad lot is labeled as
Send correspondence to C.A. Mallmann. Laboratório de Análises Micotoxicológicas, prédio 44, 3° andar, Universidade Federal de Santa Maria, 97105-900 Santa Maria, RS, Brazil. E-mail: [email protected].
good. The frequency of occurrence of those two kinds of er-rors depends on the sampling plan and is given by the de-sign of a characteristic operation curve (OC) (Johanssonet al., 2000c; Miragliaet al., 2005; Vargaset al., 2006).
In regards to mycotoxins, an OC curve relates the toxin concentration in the lot (x-axis) with the probability to accept this lot (y-axis). Using a pre-established accep-tance/rejection limit, the OC curve shows each seller/pro-ducer and buyer/consumer risk (as shown in Figure 1) (Miragliaet al., 2008). For each sampling plan, the risks are defined by the sampling method, sample size, subsample preparation and size, number of analysis, and analyses method (Whitakeret al., 2011).
Due to the lack of information on the identification of the efficiency of different sampling plans, the aim of this re-search was to evaluate the performance of two different sample collection methods for aflatoxins quantification in maize.
Material and Methods
Sample collection
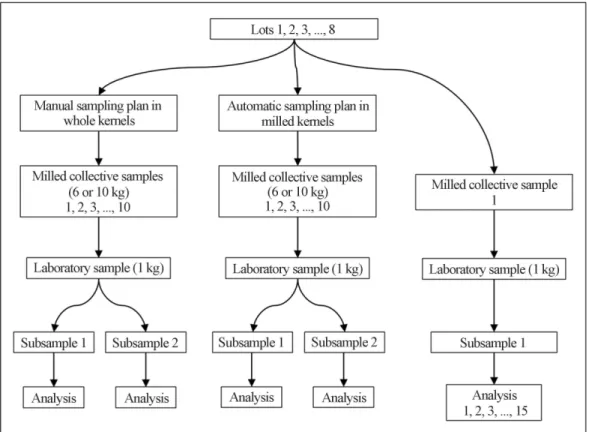
Maize sample collection was performed in eight trucks with a load ranging from 13 to 32 tons of maize. On each truck (lot) two sampling plans for aflatoxins (B1+B2+G1+G2) quantification were applied: manual and automatic. The experimental design used to determine the variance associated to each stage of the aflatoxins quantifi-cation procedure on both sampling plans is presented on Figure 2.
For the manual sampling plan, kernel samples were taken using a sampling spear with 10 collector chambers. The size of each kernel sample followed the EC Regulation
No. 401/2006 (European Commission Regulation-EC No 401, 2006). From three lots with sizes ranging from 13 to 20 tons, a 6 kg collective sample was obtained from each lot through 60 increments taken from six different sampling spots. From five lots with sizes greater than 20 tons, a 10 kg collective sample was obtained from each lot trough 100 in-crements taken from ten different sampling spots. This pro-cedure was performed 10 times to each maize lot.
For the automatic sampling plan, the same eight lots of maize were milled (particles smaller than 9 mesh) in hammer mills and moved along the factory through a screw conveyor. Outside this screw conveyor 10 continuous flow sampling systems were installed using 10 holes with 17.5 mm diameter located on the right-hand side (along the milled maize flow), 45° from the base of the tube. The size of the collective samples for each lot was calculated based on the equation 1, and ranged from 16.1 to 25.3 kg.
Cs = 20m (1)
whereCsis the collective sample in kg andmis the size of
the lot in tons.
After the collection procedure, all the 20 samples from each lot were milled in a hammer mill with a 2 mm strainer. The milled samples were reduced to the size of 1 kg (laboratory sample) using a sample splitter with in-verted channels, packed in plastic bags, and stored at -18 °C.
Sample preparation
Each laboratory sample was milled in a Retsch®ZM 200 ultra centrifugal mill (Altmann, São Paulo, SP, Brazil), at 17,000 rpm, with a 1.5 mm strainer, and split into 10
sub-36 Mallmannet al.
samples using a Retsch®PT 100 sample divider (Altmann, São Paulo, SP, Brazil).
Aflatoxin analysis
Analysis of aflatoxins (B1+B2+G1+G2) was per-formed once in two out of ten subsamples from each labora-tory sample and 15 times in one extract from one subsample from each lot, totalizing 1,400 analyses. The chromato-graphic method was applied according to Sulyok et al. (2007) and showed quantification limit a recovery coeffi-cient for aflatoxins as follows: 1mg kg-1and 94.5% for B1; 1mg kg-1and 80.0% for B2; 1mg kg-1and 88.5% for G1and; 1mg kg-1and 88.1% for G2.
Variability of the results on aflatoxins quantification
The variability of the results on aflatoxins quantifica-tion was determined by the calculaquantifica-tion of the variance. The total variance (S2(t)) associated to the procedure of
afla-toxins quantification is composed by the sum of sample variance (S2(s)), preparation variance (S2(p)), and analysis
variance (S2(a)) (Cheliet al., 2009; Ozayet al., 2006;
Whi-takeret al., 2011), according the Eq. (2).
S( )t S( )s S( )p S( )a
2 2 2 2
= + + (2)
The results for S2(s), S2(p), and S2(a)were obtained by replicating results from lot, laboratory sample, and extract, respectively.
Theoretical distributions of the results from aflatoxins concentration
Four theoretical distribution models (all 2-parameter) were tested to simulate the distribution of the results from aflatoxins quantification on each lot of maize: normal, lognormal, gamma, and Weibull. Each theoretical distribu-tion was observed from the results of 20 subsamples per lot and per sampling plan, totalizing 64 distributions.
Observed distributions of the results from aflatoxins concentration
The observed distributions were determined from the 20 results of aflatoxins quantification from each lot at each sampling plan, totalizing 16 observed distributions. The observed acceptance probabilities were calculated for each lot by counting the number of results less than or equal the acceptance limit used (15mg kg-1) and divided by 20 (num-ber of analyses per lot in each sampling plan). A total of 8 observed points were determined to each sampling plan (one per lot). The higher value attributed to the acceptance probability was 1.0 (20/20) or 100% and the next was 0.95 (19/20).
Selection of the theoretical distribution model
was considered to be acceptable when the statistic test did not exceed the critical value 95% (p³0.05).
Statistical analysis
The components of the total variance were estimated for the eight lots at both sampling plans using ANOVA. The individual variances from each stage (sampling, prepa-ration, and analysis) were submitted to a multi-factor ANOVA, using the average aflatoxins concentration (B1+B2+G1+G2) as covariate on the variance from each stage. Variances from each stage were compared between sampling plan using the F test at 95% of significance (p£0.05). The sampling variances for each sampling plan, as well as the variances of preparation and analysis (regard-less the sampling plan) were submitted to regression analy-sis against aflatoxins concentration (B1+B2+G1+G2) to obtain the equations. Models that showed the less value of p were used.
The estimated acceptance probabilities associated with the sampling plans described above were calculated using the lognormal distribution. Parameters for the lognormal distribution were determined using the average aflatoxin concentration (X) and the variances S2(t) manualand S2(t) automatic. The acceptance/rejection limit used was 15mg kg-1.
Variance estimates, regression analyses, and evalua-tion of the theoretical distribuevalua-tions were performed using
the statistical program Statgraphics Plus 5.0. The accep-tance/rejection probabilities calculation and the OC curves development were performed using Microsoft Ex-cel 2010.
Results and Discussion
Variability
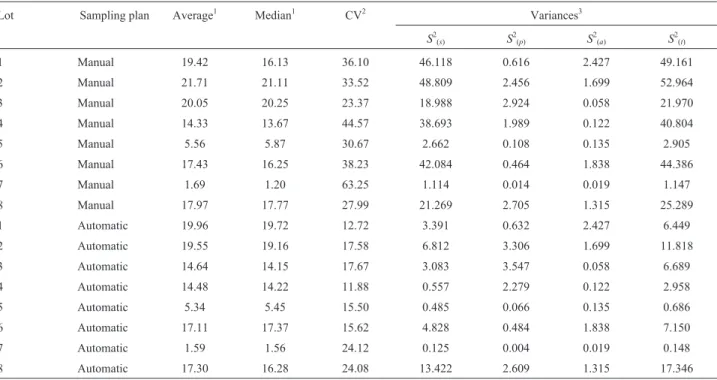
Table 1 shows the variance of aflatoxins concentra-tions from the stages of sampling, preparation, analysis, and the total variance. Total aflatoxin concentration results from 320 subsamples analyzed ranged from 1.0 to 37.1mg kg-1.
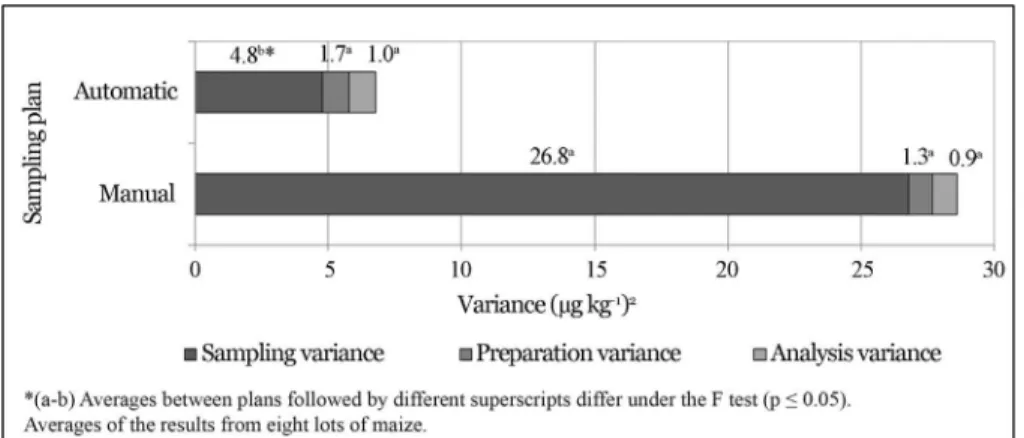
Variance associated with the sampling procedure and the total variance were respectively 5.6 and 3.9 times lower at the automatic sampling plan than at the manual one (p£0.05). As the procedures for the preparation and analy-sis stages were the same, there were no differences between their variances (p = 0.57 and p = 0.80) (Figure 3).
Johanssonet al.(2000a) estimated the total variance components of the results from aflatoxins quantification in lots of maize. Thus, they toke a 45 kg collective samples from each lot, reduced them to 1.13 kg and milled them. They evaluated lots of maize with similar aflatoxins con-centration found in this research. However, the variance as-sociated with each stage of the aflatoxins quantification procedure was lower in this study. Regarding the sampling
38 Mallmannet al.
Table 1- Average and median of aflatoxins concentration, coefficient of variation and sampling, preparation, analysis, and total variances by lot of maize and sampling plan.
Lot Sampling plan Average1 Median1 CV2 Variances3
S2(s) S2(p) S2(a) S2(t)
1 Manual 19.42 16.13 36.10 46.118 0.616 2.427 49.161
2 Manual 21.71 21.11 33.52 48.809 2.456 1.699 52.964
3 Manual 20.05 20.25 23.37 18.988 2.924 0.058 21.970
4 Manual 14.33 13.67 44.57 38.693 1.989 0.122 40.804
5 Manual 5.56 5.87 30.67 2.662 0.108 0.135 2.905
6 Manual 17.43 16.25 38.23 42.084 0.464 1.838 44.386
7 Manual 1.69 1.20 63.25 1.114 0.014 0.019 1.147
8 Manual 17.97 17.77 27.99 21.269 2.705 1.315 25.289
1 Automatic 19.96 19.72 12.72 3.391 0.632 2.427 6.449
2 Automatic 19.55 19.16 17.58 6.812 3.306 1.699 11.818
3 Automatic 14.64 14.15 17.67 3.083 3.547 0.058 6.689
4 Automatic 14.48 14.22 11.88 0.557 2.279 0.122 2.958
5 Automatic 5.34 5.45 15.50 0.485 0.066 0.135 0.686
6 Automatic 17.11 17.37 15.62 4.828 0.484 1.838 7.150
7 Automatic 1.59 1.56 24.12 0.125 0.004 0.019 0.148
8 Automatic 17.30 16.28 24.08 13.422 2.609 1.315 17.346
1
Average aflatoxins concentration (B1+B2+G1+G2) inmg kg-1from 20 analyzed subsamples per lot. 2Coefficient of variation (%).
3
stage, the lower variability found in this research is proba-bly due to the fact that collective samples were milled be-fore the laboratory sample was taken. Milling the collective sample raises the number of particles per unit of mass, low-ering the variability among the analysis results (FAO 1993). Preparation and analysis stages also showed lower variability, because samples were prepared using different equipments and methods for milling and sub sampling. The analysis performed with high performance liquid chroma-tography tandem mass spectrometry (LC-MS/MS) is more specific and has simpler extraction and analyses procedures (Sforzaet al., 2006), than those applied to the thin layer chromatography (TLC) used by Johanssonet al.(2000a).
Shotwellet al.(1975) found that if a lot is properly mixed, contaminated particles will probably be equally dis-tributed along its mass. Under this condition, the spot where the sample is taken is probably not relevant. How-ever, if the lot is not previously mixed, mycotoxin contami-nated particles can be located in some delimited areas of the lot. Thus, if sampling is done by taking samples from only one spot on the lot, contaminated particles may not be sam-pled, or, many contaminated particles may be harvested (Whitakeret al., 2011). Those situations can occur more frequently when using the manual sampling system ap-proached in this research.
A sample is much more significant if it is harvested from milled materials due to the highest number of particles per unit of volume or per unit of mass when compared to whole kernels (Tittlemieret al., 2011). In several studies, Whitakeret al. (1976, 1994, 1998, 2011) found that the sample size infers on the variability of the results, in other words, as bigger the sample, the smaller the variance. The collection of increments while a lot is being moved from one side to other (dynamic lot) provides better representativity to the sample when compared to the sam-pling applied to a static lot (Miragliaet al., 2005; Whitaker et al., 2011). In this research, the reduction on the results variability from aflatoxins concentration at the automatic sampling is probably associated to the fact that the whole
lot is milled and conducted through a screw conveyor thus, both the milling process and the transportation help on the lot homogeneity. Besides, the collective sample size at the automatic sampling plan is bigger and the collection of in-crements is uninterrupted, which means there is always a small portion being harvested giving a better randomness on particles collection and thus, better representativity of the sample.
The S2(s)estimate was performed using the regression analysis for each sampling plan, where the equation be-tween sampling variance and aflatoxins concentration (X) was:
S( )2s manual . (0 952 1 514. . NL( ))X
2 718
= - + × (3)
S s X ( ) ( . . ( )) . automatic NL
2 3 0332 1 531
2 718
= - + × (4)
under a determination coefficient (R2) of 0.887 and 0.730 respectively, and where NL is the natural logarithm.
TheS2(p)and the S2(a)were obtained by performing only one regression analysis using both sampling plans, where the equation between preparation variance and aflatoxins concentration (X) was:
S p
X
( )
( . . ( ))
.
2 5 997 2 232
2 718
= - + ×NL (5)
and the equation between analysis variance and aflatoxins concentration (X) was:
S X a ( ) ( . . / ) 2 1
1207 85 741
=
- + (6)
under R2= 0.849 and 0.875 respectively.
TheS2(t)was estimated by the sum ofS2(s),S2(p), and
S2(a):
S t X ( ) ( . . ( )) ( . . . manual NL
2 0 952 1 514
5 99
2 718
2 718
= - + × +
- 7 2 232 1
1207 85 741
S t
X
( )
( . . ( ))
(
.
.
automatic
NL
2 3 033 1 531
5
2 718
2 718
= - + × +
-. . ( ))
( . . / )
997 2 232 1
1207 85 741
+ ×
+
- +
NLX
X
(8)
The variance estimate in each stage from both sam-pling plans rose as the aflatoxins concentration rose (r > 0.85). Similar results were observed by Johanssonet al. (2000a) in a research with aflatoxins in maize, Whitakeret al.(1994) with aflatoxins in peanuts, and Whitakeret al. (1998) with fumonisins in maize.
The S2(t) estimate associated to a lot of maize with 15mg kg-1of aflatoxins is 24.57 (mg kg-1)2at the manual sampling plan and 4.31 (mg kg-1)2at the automatic one. The S2(s) manual,S2(s) automatic,S2(p), andS2(a)are 23.30, 3.04, 1.05, and 0.22 (mg kg-1)2 respectively. TheS2(s),S2(p), and S2(a) represent about 95%, 4%, and 1% of the total variance from the manual sampling plan and 71%, 24%, and 5% of the to-tal variance from the automatic sampling plan. The percent-age of S2(t)that corresponds to preparation and analysis was bigger at the automatic sampling plan due to a reducedS2(s) in this sampling plan. At both sampling plans, theS2(s)had the major contribution to theS2(t), followed by theS2(p)and S2(a). This is consistent with observations on other
myco-toxins in several seeds and feeds (Whitakeret al., 1976, 1998; FAO 1993; Johansson et al., 2000c; Ozay et al., 2006).
Distribution of aflatoxins results
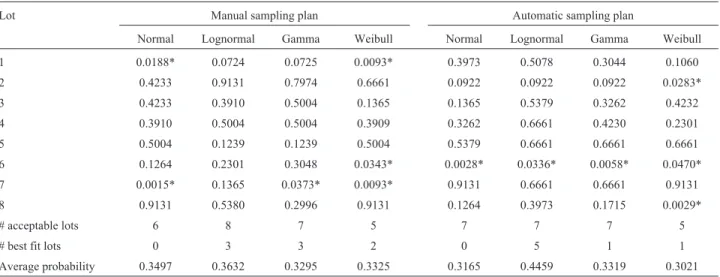
A summary of the Chi-square test for each theoretical distribution is described at the end of Table 2. Despite the fact that similar models have been used to precisely simu-late the distribution of the results from mycotoxins quanti-fication in seeds and feeds (Sharkeyet al., 1994; Giesbrecht et al., 1998; Johanssonet al., 2000b; Vargaset al., 2006),
lognormal distribution was chosen because it obtained the major number of lots with acceptable distribution and high-est average probability. Thus, this distribution was used to calculate the OC curve and evaluate the performance of both sampling plans for aflatoxins quantification in maize.
Operation characteristic curve
The OC curves of both sampling plans are illustrated on Figure 4 with their observed and estimated acceptance probabilities. The difference on shape from both OC curves is only due to the sampling stage, as the other stages were the same for both sampling plans. Comparing both OC curves, it is possible to verify that the automatic sampling plan reduces both producer/seller and consumer/buyer risks (indicated on Figure 1). As an example: a lot of maize with a theoretical aflatoxins contamination of 20mg kg-1and a limit of acceptance/rejection of 15mg kg-1. If this lot were sampled using the manual sampling plan described in this research, it would have a 21% chance of being accepted un-der the limit established. On the other hand, if the same lot were sampled using the automatic sampling plan described in this research, it would have only a 3% chance of being accepted under the limit established.
Conclusions
The total variance associated to the procedures for aflatoxins quantification in maize at both the manual and automatic sampling plan raises as the aflatoxins concentra-tion raises. The sampling stage contributes with the highest variability, followed by the preparation and analysis stages. Sampling variance and total variance are reduced at the au-tomatic sampling plan, because it is applied in milled grains in movement, in a continuous way, and with a bigger col-lective sample, proving have a better performance against
40 Mallmannet al.
Table 2- Chi-square test probabilities on normal, lognormal, gamma, and Weibull distributions of the results from aflatoxins quantification in eight lots of maize at the two sampling plans evaluated.
Lot Manual sampling plan Automatic sampling plan
Normal Lognormal Gamma Weibull Normal Lognormal Gamma Weibull
1 0.0188* 0.0724 0.0725 0.0093* 0.3973 0.5078 0.3044 0.1060
2 0.4233 0.9131 0.7974 0.6661 0.0922 0.0922 0.0922 0.0283*
3 0.4233 0.3910 0.5004 0.1365 0.1365 0.5379 0.3262 0.4232
4 0.3910 0.5004 0.5004 0.3909 0.3262 0.6661 0.4230 0.2301
5 0.5004 0.1239 0.1239 0.5004 0.5379 0.6661 0.6661 0.6661
6 0.1264 0.2301 0.3048 0.0343* 0.0028* 0.0336* 0.0058* 0.0470*
7 0.0015* 0.1365 0.0373* 0.0093* 0.9131 0.6661 0.6661 0.9131
8 0.9131 0.5380 0.2996 0.9131 0.1264 0.3973 0.1715 0.0029*
# acceptable lots 6 8 7 5 7 7 7 5
# best fit lots 0 3 3 2 0 5 1 1
Average probability 0.3497 0.3632 0.3295 0.3325 0.3165 0.4459 0.3319 0.3021
the manual sampling plan. The OC curve from the auto-matic sampling plan reduces both producer/seller and con-sumer/buyer risks when compared to the OC curve from the manual sampling plan, thus, reducing the chances of misclassification of maize lots and providing more safety in commercial trades.
Acknowledgments
To Laguiru Cooperative for providing the facilities for maize sample collections; to CAPES and CNPq for the scholarship; and to FAPERGS for financial support.
References
Cheli F, Campagnoli A, Pinotti L, Fusi E, Dell’orto V (2009) Sampling feed for mycotoxins: acquiring knowledge from food. Ital J Food Sci 8:5-22.
European Commission Regulation (2006) No 401/2006 of 23 February 2006 laying down the methods of sampling and analysis for the official control of the levels of mycotoxins in foodstuffs. Official Journal of European Union L70:12-34. FAO - Food and Agriculture Organization (1993) Sampling plans
for aflatoxin analysis in peanuts and corn. FAO Food and Nutrition. Paper 55, FAO, Viale Della Terme di Caracalla 00100, Rome, Italy, p. 27-56.
Giesbrecht FG, Whitaker TB (1998) Investigations of the prob-lems of assessing aflatoxin levels in peanuts. Biometrics 54:739-753.
Johansson AS, Whitaker TB, Hagler WM, Giesbrecht FG, Young JH, Bowman DT (2000) Testing shelled corn for aflatoxin, part I: estimation of variance components. J AOAC Int 83:1264-1269.
Johansson AS, Whitaker TB, Giesbrecht FG, Hagler WM, Young JH (2000) Testing shelled corn for aflatoxin, part II:
model-ing the distribution of aflatoxin test results. J AOAC Int 83:1270-1278.
Johansson AS, Whitaker TB, Giesbrecht FG, Hagler WM, Young JH (2000) Testing shelled corn for aflatoxin, part III: evalu-ating the performance of aflatoxin sampling plans. J AOAC Int 83:1279-1284.
Krska R, Welzig E, Berthiller F, Molinelli A, Mizaikoff B (2005) Advances in the analysis of mycotoxins and its quality as-surance. Food Addit Contam 22:345-353.
Miraglia M, De Santis B, Minardi V, Debegnach F, Brera C (2005) The role of sampling in mycotoxin contamination: an holistic view. Food Addit Contam: part A 22:31-36. Miraglia M, De Santis B, Pannunzi E, Debegnach F, Brera C
(2008) Mycotoxin concentration data quality: the role of sampling. In: Leslie, F.J.; Bandyopadhyay, R.; Visconti, A. (eds). Mycotoxins: detection methods, management, public health and agricultural trade. Wallingford, UK, Cabi, p. 101-168.
Ozay G, Seyhan F, Yilmaz A, Whitaker TB, Slate AB, Giesbrecht F (2006) Sampling hazelnuts for aflatoxin: uncertainty asso-ciated with sampling, sample preparation, and analysis. J AOAC Int 89:1004-1011.
Sforza S, Dall’asta C, Marchelli R (2006) Recent advances in mycotoxin determination in food and feed by hyphenated chromatographic techniques/mass spectrometry. Mass Spectrom Rev 25:54-76.
Sharkey AJ, Roch OG, Coker RD (1994) A case-study on the de-velopment of a sampling and testing protocol for aflatoxin levels in edible nuts and oil-seeds. J R Soc Series D (The Statistician) 43:267-75.
Shotwell OL, Goulden ML, Bothast RJ, Hesseltine CW (1975) Mycotoxins in hot spots in grains. 1. Aflatoxin and zeara-lenone occurrence in stored corn. Cereal Chem 52:687-697. Stroka J, Anklam E, Jörissen U, Gilbert J (2000) Immunoaffinity
nut butter, pistachio paste, fig paste, and paprika powder: collaborative study. J AOAC Int 83:320-340.
Sulyok M, Krska R, Schuhmacher R (2007) A liquid chromatog-raphy/tandem mass spectrometric multi-mycotoxin method for the quantification of 87 analytes and its application to semi-quantitative screening of moldy food samples. Anal Bioanal Chem 389:1505-1523.
Sweeney MJ, Dobson ADW (1998) Mycotoxin production by Aspergillus, Fusarium and Penicillium species. Int J Food Microbiol 43:141-158.
Tittlemier SA, Varga E, Scott PM, Krska R (2011) Sampling of cereals and cereal-based foods for the determination of ochratoxin A: an overview. Food Addit Contam: part A 28:775-778.
Vargas EA, Whitaker TB, Dos Santos EA, Slate AB, Lima FB, Franca RCA (2006) Design of a sampling plan to detect ochratoxin A in green coffee. Food Addit Contam.: part A 23:62-72.
Whitaker TB, Whitten ME, Monroe RJ (1976) Variability associ-ated with testing cottonseed for aflatoxin. J Am Oil Chem Soc 53:502-505.
Whitaker TB, Dowell FE, Hagler WM, Giesbrecht FG, Wu J (1994) Variability associated with sampling, sample prepa-ration, and chemically testing for aflatoxin in farmers’ stock peanuts. J AOAC Int 77:107-116.
Whitaker TB, Trucksess MW, Johansson AS, Giesbrecht FG, Hangler WM, Bowman DT (1998) Variability associated with testing corn for fumonisin. J AOAC Int 81:1162-1168. Whitaker TB, Sampling for mycotoxins (2004) In: Magan, N.;
Olsen, M. (eds). Mycotoxins in food: detection and control. Cambridge, UK, Woodhead Publishing Ltd., p.69-87. Whitaker TB, Slate A, Doko B, Maestroni B, Cannavan A (2011)
Sampling procedures to detect mycotoxins in agricultural commodities. Springer, New York, USA.
All the content of the journal, except where otherwise noted, is licensed under a Creative Commons License CC BY-NC.