Chemical Safety of Drinking Water Networks
Mónica Sofia Freitas dos Santos
Dissertation presented to obtain the degree of
DOCTOR IN ENVIRONMENTAL ENGINEERING
by
U
NIVERSITY OFP
ORTOSUPERVISION
DOCTOR MARIA ARMINDA COSTA ALVES
DOCTOR LUÍS MIGUEL PALMA MADEIRA
P
ORTO,
2013
I dedicate this thesis to
my parents, Aurora and Américo
my brother, Américo
I wish to thank the Faculty of Engineering of the University of Porto (FEUP), the Chemical Engineering Department (DEQ) and the Laboratory for Process, Environmental and Energy Engineering (LEPAE) for the facilities that allowed me to conduct the scientific experiments.
I am also grateful to “Fundação para a Ciência e a Tecnologia” (FCT) for my PhD grant (SFRH/BD/61302/2009) and for the financial support through the project Acquasafe (PTDC/AAC-AMB/101687/2008).
I also wish to thank to the European commission within the 7th Framework Programme
FP7-SEC-2007-1 - “Security; Increasing the security of Citizen; Water distribution surveillance” for the financial support of the European Research Project SecurEau (http://www.secureau.eu/ – Contract no. 217976).
I would like to express my deep sense of gratitude to my supervisor Professor Arminda Alves and co-supervisor Professor Luís Miguel Madeira for believing in me and for giving me the opportunity to participate in this interesting and challenging work. Thank you for your continuous support and availability, as well as, for the scientific suggestions and recommendations. It has been a great honor and privilege to work and learn with them. My special thanks to Professor Luís Melo, head of the SecurEau research team in Portugal, for accepting me as member of such great group, for helping me every time I needed and for giving me the opportunity to participate in all SecurEau meetings.
I would like also to thank Professor Lúcia Santos for advising me to the SecurEau project. I have no doubt that I am also writing this thesis today because of her.
My acknowledgement also go to Dr. Gabriela Schaule from the IWW Water Centre (Rheinisch-Westfälisches Institut für Wasserforschung gemeinnützige GmbH – Mülheim an der Ruhr, Germany) for kindly supplying the deposits from drinking water networks. I wish to thank Syngenta Crop Protection, Lda, particularly Eng. Mónica Teixeira, for supplying Gramoxone.
I am also grateful to Águas do Douro e Paiva company (AdDP), specially to Dr. João Vilaça e Engª Rita Reis for supplying the detailed information about drinking water distribution systems of the South Oporto metropolitan area.
My special thanks to Carmen Rodrigues (from FEUP) for being always available for helping me in the respirometry technique and actinometry experiments.
To Cátia Oliveira (from FEUP), with whom I worked during this period, I wish to thank the availability and all dedication.
I am grateful to Dina Martins (from FEUP) for supplying cells of Pseudomonas fluorescens and clay for my scientific experiments, as well as, the respective composition/characterization of the materials.
My gratitude is also towards my lab colleagues for the company, friendship and support during these years: José, Vera, Raquel, Leandro, Nuno, Patrícia and Marzieh. I also thank the joy and cheerfulness of our “pitufos”: Vera, Rúben, Carina, Sara, Eduardo and Mariana. My special thanks to the technicians Sr. Serafim, Fátima, José Luís, Liliana and Luís Carlos.
Thank you to all my friends for their support, encouragement and for the good times we shared.
I am grateful to my family, especially to my parents and my brother, for their love, patience, endless support and encouragement. Thank you for helping me to build a future that I think is always better. I am indebted to you forever. Special thanks also to Jorge, for his love, friendship, infinite patience and for helping and understanding me during the past few years. Simão, my godson, you are still a child but I would like you to know that your smile cheered me up in the less easy moments and was an inspiration for me. I hope you will be very proud of your godmother.
This PhD thesis was developed at LEPAE (Laboratory for Process, Environmental and Energy Engineering), in the Chemical Engineering Department of the Faculty of Engineering-University of Porto (DEQ-FEUP), throughout the period between 2009 and 2013 and under the scholarship SFRH/BD/61302/2009 and the European Project SecurEau (FP7-SEC-2007-1, www.secureau.eu).
The main objective of SecurEau project was to limit the impact on the population due to safe water privation in a contamination event and to launch an appropriate response for rapidly restoring the use of the drinking water networks, particularly after a deliberate contamination. For defining a general strategy of rehabilitation of the distribution network after a terrorist attack, SecurEau consortium proposed to work with representative chemical (paraquat, chlorfenvinphos, carbofuran, BDE-100 and mercury), biological (Bacillus anthracis, E. Coli. O157, Francisella tularensis) and radiological (radionuclides such as Co, Sr, Cs, U, Po, Ir and Am) agents and surrogates. The CBRN (Chemical, Biological and Radionuclides) listed above were selected based on several criteria and represent strong candidates to be used in deliberate contamination activities. SecurEau, acting as a demonstration project for designing and implementing an effective and timely response upon a CBRN attack, was built with the aim to address the following points:
1) detection of unexpected changes in water quality which could be in relation with a deliberate contamination event, by applying commercially available or recently developed generic sensors placed throughout the distribution systems;
2) adaptation of known analytical methods to rapidly detect specific CBRN contaminants in water and in biofilms/deposits and to control the cleaning procedures;
3) localization of the point source (s) of contamination and subsequently the contaminated area (via modeling reactive transport) allowing delimitation of the corrective actions;
4) implement decontamination procedures of the distribution system including the treatment of water extracted and used for flushing the pipe walls;
5) controlling the efficacy of the corrective actions by analyzing the water bulk and specially the pipe walls and the deposits.
The present work was centered in the second and fourth topics of SecurEau project and two key chemicals: paraquat dichloride (PQ) and a polybrominated diphenyl ether (BDE-100).
The dissertation is organized in nine chapters. The first one (which constitutes Part I) corresponds to a general introduction, including a review on the state of the art of the topics of interest: analytical methods for detection and quantification of the key chemicals in waters and soils (because no studies were found for deposits from drinking water networks); adsorption/desorption studies of such chemicals on solid matrices and degradation technologies for the treatment of waters contaminated with the considered chemicals. The Chapters 2 to 5 and 6 to 7 were organized in Part II (paraquat) and Part III (BDE-100), respectively.
In Chapter 2, three analytical methodologies are described for the quantification of PQ in waters in response to different scenarios: in case of a deliberate contamination event (higher concentrations); for drinking water quality control in accordance with the European Union legislation (lower concentrations), and for PQ confirmation purposes and identification of PQ degradation by-products. All methods were validated and the global uncertainty associated to the results was determined.
The analytical methodology for PQ quantification in deposits from drinking water networks is reported in Chapter 3. The method was validated and its applicability to the quantification of diquat in the same matrix was also tested.
Chapter 4 is mostly addressed to the interaction between PQ and three deposits representative of those found in drinking water networks. The effect of some parameters such as stirring speed, particle size, initial PQ concentration and temperature on the adsorption kinetics was evaluated. Herein, the adsorption isotherms at two different temperatures were also obtained and some desorption experiments were conducted. The treatment of PQ-contaminated waters by oxidation with Fenton’s reagent was examined in the last chapter of Part II (Chapter 5), where a parametric study was carried out to study the effect of some variables on the PQ degradation. A semi-empirical kinetic model is proposed to describe the PQ concentration histories under such a wide range of conditions, and the biodegradability of the final effluent was assessed. Additionally, the PQ degradation performance by the classic Fenton process is compared to the photo-Fenton one.
In Chapter 6 (Part III), a dispersive liquid-liquid microextraction – gas chromatography – mass spectrometry method was developed and validated for BDE-100 identification and quantification in water matrices. The effect of the extraction and dispersive solvents, extraction solvent volume, dispersive solvent volume, extraction time and salt addition on the extraction efficiency was studied. Moreover, the suitability of the developed method for the quantification of other environmental abundant polybrominated diphenyl ethers in waters was evaluated.
Chapter 7 is a preliminary study about degradation of BDE-100 in waters by photolysis and photo-Fenton. Concerning the photolysis process, the degradation efficiency was examined for different UV-Vis light intensities. The applicability of photo-Fenton methodology for the treatment of BDE-100 contaminated waters is a completely new research topic, for which preliminary results were reached by now.
Finally, Chapters 8 and 9 (Part IV) compile the main conclusions and the suggestions for future work, respectively.
Acknowledgements v
Preface vii
Abstract xix
Resumo xxi
Figure captions xxiii
Table captions xxix
Nomenclature xxxiii
Chapter 1 – Introduction 3
1.1 Paraquat 5
6 1.1.1 Analytical methods for paraquat detection and quantification in waters
1.1.1.1 The particular case of electrochemical methods 8 1.1.1.2 The particular case of liquid chromatography methods 13 1.1.2 Analytical methods for paraquat quantification in deposits from drinking water networks
22 1.1.2.1 Characterization of deposits from drinking water distribution systems
23 1.1.3 Sorption of paraquat on deposits from drinking water networks 28 1.1.4 Degradation technologies for paraquat in waters 33
1.2 Polybrominated diphenyl ethers (PBDEs) 38
1.2.1 Analytical Methods for PBDEs in waters 41
1.2.2 Analytical methods for PBDEs in deposits from drinking water networks
45 1.2.3 Sorption of PBDEs on deposits from drinking water networks 49 1.2.4 Degradation technologies for PBDEs in waters 52
Part I – General Introduction
1.2.4.1 Overview 52 1.2.4.2 The particular case of the photolysis process 55
1.3 References 61
Chapter 2 – Paraquat quantification in waters 83
Abstract 83
2.1 Introduction 84
2.2 Experimental Section 85
2.2.1 Standard solutions and samples 85
2.2.2 Instrumentation 85
2.2.2.1 LC-DAD 85
2.2.2.2 LC-MS 86
2.2.3 SPE procedure for the SPE-LC-DAD method 86
2.2.4 Validation parameters 86
2.2.4.1 Recovery assays for the DI-LC-DAD method 87 2.2.5 Interference studies of Fenton’s species on PQ quantification by DI-LC-DAD
89
2.3 Results and discussion 90
2.3.1 Validation of the DI-LC-DAD method for high PQ concentrations 90 2.3.1.1 Linearity range and limits of detection and quantification 90
2.3.1.2 Precision 91
2.3.1.3 Accuracy 92
2.3.1.4 Estimation of the global uncertainty associated to the DI-LC-DAD method
93 2.3.1.5 Specificity of the method – study of interferences from Fenton’s reaction
95 2.3.2 Validation of the SPE-LC-DAD method for low PQ concentrations 99
2.3.2.1 Extraction technique 99
Part II – Paraquat
2.3.2.2 Quantitative analysis 101
2.3.2.3 Precision and accuracy 102
2.3.2.4 Estimation of the global uncertainty associated to the SPE-LC-DAD method
102 2.3.3 Validation of the DI-LC-MS method for confirmation purposes 104
2.3.3.1 Solvents/ Mobile phase selection 104
2.3.3.2 MS optimization procedures 104
2.3.3.3 Linearity and limits of detection and quantification 105
2.3.3.4 Precision and accuracy 107
2.3.3.5 Estimation of the global uncertainty associated to the LC-MS method
107
2.4 Conclusions 109
2.5 References 109
Chapter 3 – Paraquat quantification in deposits from drinking water networks 113
Abstract 113
3.1 Introduction 113
3.2 Experimental section 115
3.2.1 Reagents and working solutions 115
3.2.2 Deposits 115
3.2.3 Equipment and operating conditions 115
3.2.4 Spiking of deposits with PQ/DQ 116
3.2.5 Extraction procedure for the analytical determination 116
3.2.6 Validation 116
3.3 Results and discussion 117
3.3.1 Optimization of the extraction technique 117 3.3.1.1 Effect of extraction solvent type 117 3.3.1.2 Effect of extraction solvent volume 118
3.3.1.3 Effect of the extraction time 120
3.3.2 Quantitative analysis 120
3.3.2.1 Interference studies 120
3.3.2.2 Linearity and limits of detection and quantification 121
3.3.2.3 Precision and Accuracy 122
3.3.2.4 Estimation of the global uncertainty associated to the results 122 3.3.3 Paraquat quantification in different deposits 124 3.3.4 Suitability of the extraction methodology for Diquat 125
3.4 Conclusions 126
3.5 References 126
Chapter 4 – Adsorption of paraquat herbicide on deposits from drinking water networks
129
Abstract 129
4.1 Introduction 129
4.2 Experimental Section 130
4.2.1 Pesticides and chemicals 130
4.2.2 Deposits and other materials 130
4.2.3 Adsorption experiments with suspended particles (clay, or from real “loose deposits”)
131
4.2.4 Desorption experiments 132
4.2.5 Analytical methods 132
4.3 Results and discussion 132
4.3.1 Adsorption kinetics 132
4.3.1.1 Parameters affecting external and internal mass transfer: effect of the stirring speed and particle diameter
139 4.3.1.2 Effect of initial paraquat concentration 139
4.3.1.3 Effect of the temperature 140
4.3.2 Adsorption isotherms 140
4.3.3 Desorption studies 146
4.4 Conclusions 148
4.5 References 148
Chapter 5 – Paraquat removal from water by oxidation with Fenton’s reagent 153 Abstract 153 5.1 Introduction 153 5.2 Experimental section 154 5.2.1 Reagents 154 5.2.2 Standards preparation 155 5.2.3 Analytical methods 155
5.2.4 Oxidation with Fenton’s reagent 156
5.2.5 Biodegradability and Toxicity of Fenton’s reaction effluents 157
5.2.6 Oxidation by Photo-Fenton 158
5.3 Results and Discussion 158
5.3.1 Parametric study of the variables affecting the Fenton’s reaction 158
5.3.1.1 Effect of the temperature 158
5.3.1.2 Effect of iron salt concentration 160 5.3.1.3 Effect of the H2O2 concentration 162
5.3.1.4 Effect of the initial pH 163
5.3.1.5 Effect of iron salt source 165
5.3.1.6 Effect of the initial paraquat concentration 167 5.3.1.7 Effect of the mode of oxidant addition 167 5.3.2 Commercial paraquat degradation under optimal conditions 169 5.3.3 Kinetic model for paraquat degradation with the Fenton’s process 170 5.3.4 Biodegradability and toxicity of oxidation products 180 5.3.5 Preliminary experiments using photo-Fenton reaction 182
5.4 Conclusions 183
5.5 References 183
Chapter 6 – Nanogram per liter level determination of PBDEs in water by a simple DLLME-GC-MS method 189 Abstract 189 6.1 Introduction 189 6.2 Experimental Section 190 6.2.1 Reagents 190
6.2.2 Standard solutions and samples 191
6.2.3 Instrumentation 191
6.2.4 DLLME procedure 192
6.2.5 Validation parameters 192
6.3 Results and discussion 192
6.3.1 Optimization of DLLME 193
6.3.1.1 Effect of extraction and dispersive solvents 193 6.3.1.2 Effect of the extraction solvent volume 195 6.3.1.3 Effect of dispersive solvent volume 196
6.3.1.4 Effect of extraction time 196
6.3.1.5 Effect of salt addition 197
6.3.2 Quantitative analysis 197
6.3.2.1 Response linearity and detection and quantification limits 198
6.3.2.2 Precision and Accuracy 198
6.3.2.3 Estimation of the global uncertainty associated to the results 199 6.3.3 Suitability of the extraction methodology to other PBDEs 201
6.4 Conclusions 202
6.5 References 203
Part III – BDE-100
Chapter 7 – Preliminary results on the degradation of BDE-100 in waters by photolysis and photo-Fenton
207 Abstract 207 7.1 Introduction 207 7.2 Experimental Section 208 7.2.1 Reagents 208 7.2.2 Standard solutions 208
7.2.3 Photocatalytic reactor and light source 209
7.2.4 Degradation experiments 211
7.2.4.1 Photolysis 211
7.2.4.2 Classic dark Fenton 211
7.2.4.3 Photo-Fenton 212
7.2.5 Analytical methods 212
7.3 Results and discussion 212
7.3.1 Degradation by photolysis 212
7.3.2 Degradation by Fenton and photo-Fenton 215
7.4 Conclusions 217
7.5 References 218
Chapter 8 – General Conclusions 221
Chapter 9 – Future work 225
Annex I – Estimation of the global uncertainty associated to the analytical results 229
Part IV – General Conclusions and Future Work
Annex
This work is part of a larger research project – SecurEau – which intended to contribute to the suppression of some gaps related to the restoring of the normal function of a drinking water distribution system after a deliberate contamination event. In particular, this thesis aims to develop appropriate analytical methodologies to quantify and identify chemical contaminants in water and deposits from drinking water networks, to evaluate the sorption and affinity of the chemical contaminants to the walls/deposits/biofilms of the pipelines and to develop cleaning/decontamination techniques able to efficiently remove the threat.
Two chemical compounds, of the five target ones selected by SecurEau consortium, were explored herein: paraquat dichloride (PQ) and a polybrominated diphenyl ether (BDE-100).
In case of a suspicion of contamination, there is an urgent need to identify the specific cause of the threat and the definition of a minimum response time is essential to mitigate the impact of an attack. For PQ, analytical methods in water were developed and validated for screening purposes (to detect high concentrations as those predictable in emergency situations) by direct injection-liquid chromatography-diode array detector (DI-LC-DAD), for trace analyses by solid phase extraction-liquid chromatography-diode array detector (SPE-LC-DAD) and for confirmation purposes and identification of degradation by-products by direct injection-liquid chromatography-mass spectrometry detector (MS). Limits of detection of 10 µg/L, 0.04 µg/L and 20 µg/L were achieved for DI-LC-DAD, SPE-LC-DAD and DI-LC-MS methods, respectively. Moreover, global uncertainties below 13, 11 and 6% were found for the most part of the calibration ranges of the same methods, respectively. Different demands were recognized for BDE-100, whose quantification in water was only accounted for a dispersive liquid-liquid microextraction-gas chromatography-mass spectrometry detector (DLLME-GC-MS) method due to its extremely low water solubility. The same method could be applied for the quantification of other PBDEs (BDEs 28, 47, 85, 99, 153, 154 and 183) in waters with limits of quantification ranging from 2 ng/L (BDE-100) to 113 ng/L (BDE-183). All these methods proved to be suitable for the purpose that they were designed.
Concerning the deposits, one simple and fast analytical methodology was successfully implemented for PQ quantification in this matrix. For such purpose, three deposits representative of those found in drinking water networks were considered: herein called S2 and S3 (iron rich deposits) and S4 (calcium rich deposit). A limit of detection of 0.1 µgPQ/gS3 was obtained for PQ-S3 system with the expanded uncertainty ranging from 10-54% for concentrations between 193 and 5 µgPQ/gS3, respectively. The method proved to be reliable for the quantification of PQ in all of the above mentioned deposits. Additionally, it was demonstrated that this method is also suitable for the screening of diquat in these samples.
The PQ adsorption on those deposits follows a pseudo-second order kinetic model and Langmuir adsorption capacities of 5.7, 11 and 0.40 mg/g were achieved at 20 °C for S2, S3 and S4 deposits, respectively. The adsorption studies indicated that, in case of a contamination event, it is unlikely that PQ would adsorb on such materials, unless there is a stagnancy of the fluid for a very long period of time (closer to batch conditions). However, adsorption of PQ in loose deposits that are transported with the flowing water is much more insidious and cannot be neglected. On the other hand, S2 (brown) and S3 (tubercle) deposits can be used as low-cost adsorbents (often discarded upon pipes cleaning/maintenance operations) for the treatment of PQ-contaminated waters.
Finally, the degradation of both chemicals in water was studied using procedures based on advanced oxidation processes. Complete PQ degradation is reached after 4 h of classic dark Fenton reaction in batch mode (T =30 °C, [Fe2+]0 = 5.0×10⁻⁴ M, [H2O2]0 = 1.6×10⁻² M,
and pH0 = 3.0, for [PQ]0 = 100 mg/L). Although only 40% of mineralization was recorded
after these 4 h of reaction, it was proved that the final effluent is less toxic than the original one. The photo-Fenton process represents an attractive alternative for classic dark Fenton in off-line applications because higher mineralization degrees were reached (96% after 1 h of reaction). Concerning BDE-100, nearly 68% of the initial concentration of this chemical in water was degraded after 5 min of exposition to UV-Vis light ([BDE-100]0
= 50 µg/L and 1.6×10⁻⁶ Einstein/s).
O presente trabalho enquadra-se no âmbito de um projeto mais abrangente – SecurEau – que pretende contribuir para a supressão de algumas lacunas relacionadas com o restabelecimento do funcionamento normal de um sistema de distribuição de água potável após um episódio de contaminação deliberada. Em particular, esta tese tem como objetivo desenvolver metodologias analíticas apropriadas para a quantificação e identificação de contaminantes químicos em águas e depósitos de uma rede de água potável, avaliar a sorção e afinidade dos contaminantes químicos para as paredes/depósitos/biofilmes das tubagens e desenvolver técnicas de limpeza/descontaminação capazes de remover eficazmente a ameaça.
Esta tese focou-se em dois compostos químicos, dos cinco selecionados pelo grupo SecurEau: dicloreto de paraquato (PQ) e um éter difenílico polibromado (BDE-100).
Em caso de suspeição de contaminação, há uma urgente necessidade de identificar a causa específica da ameaça e a definição de um tempo mínimo de resposta é essencial para atenuar o impacto de um ataque. Para o PQ, desenvolveram-se e validaram-se métodos analíticos em águas para fins de rastreio (para detetar elevadas concentrações como as previstas em situações de emergência) por injeção direta- cromatografia líquida-deteção por arranjo de díodos (DI-LC-DAD), para análises vestigiais por extração em fase sólida-cromatografia líquida-deteção por arranjo de díodos (SPE-LC-DAD) e para fins de confirmação e identificação de sub-produtos de degradação por injeção direta-cromatografia líquida-deteção por espectrometria de massa (DI-LC-MS). Obtiveram-se limites de deteção de 10 µg/L, 0.04 µg/L and 20 µg/L para os métodos DI-LC-DAD, SPE-LC-DAD e DI-LC-MS, respetivamente. Para além disso, encontraram-se incertezas globais abaixo de 13, 11 e 6% para a maior parte da gama de linearidade dos mesmos métodos, respetivamente. Diferentes necessidades foram reconhecidas para o BDE-100, cuja quantificação em água foi apenas assegurada pelo método de microextracção dispersiva líquido-líquido-cromatografia gasosa-deteção por espectrometria de massa devido à sua solubilidade em água ser extremamente baixa. O mesmo método poderá ser aplicado para a quantificação de outros PBDEs (BDEs 28, 47, 85, 99, 153, 154 e 183) em águas com limites de quantificação que variam de 2 ng/L (BDE-100) a 113 ng/L (BDE-183). Todos os métodos provaram ser adequados para o fim a que foram desenvolvidos.
Relativamente aos depósitos, implementou-se uma metodologia analítica simples e rápida para a quantificação de PQ nesta matriz. Para tal, consideraram-se três depósitos representativos dos encontrados em redes de distribuição de água potável: aqui designados por S2 e S3 (depósitos ricos em ferro) e S4 (depósito rico em cálcio). O método provou ser adequado para a quantificação de PQ em todos os depósitos acima mencionados. Adicionalmente, foi demonstrado que o método é também apropriado para a quantificação de diquato nestas amostras.
A adsorção de PQ nestes depósitos segue um modelo cinético de pseudo-segunda ordem e alcançaram-se capacidades de adsorção de Langmuir de 5.7, 11, 0.40 mg/g a 20 °C para os depósitos S2, S3 and S4, respetivamente. Os estudos de adsorção indicaram que, em caso de contaminação, é improvável que o PQ possa adsorver em tais depósitos, a menos que haja uma estagnação do fluído por um longo período de tempo (próximo das condições batch). Contudo, a adsorção de PQ nos depósitos que são transportados com a corrente de água é muito mais insidiosa e não pode ser negligenciada. Por outro lado, os depósitos S2 (castanho) e S3 (tubérculo) podem ser usados como adsorventes de baixo custo (frequentemente descartados nas operações de manutenção e limpeza de condutas) para o tratamento de águas contaminadas com PQ.
Finalmente, a degradação de ambos os químicos em água foi estudada usando procedimentos baseados em processos de oxidação avançados. Atingiu-se completa degradação de PQ após 4 h de reação por Fenton clássico em modo batch (T =30 °C,
[Fe2+]
0 = 5.0×10⁻⁴ M, [H2O2]0 = 1.6×10⁻² M, e pH0 = 3.0, para [PQ]0 = 100 mg/L). Apesar de
serem registados níveis de mineralização de apenas 40% após 4 h de reação, provou-se que o efluente final é menos tóxico que o original. O processo de foto-Fenton constitui uma alternativa atrativa ao Fenton clássico em aplicações off-line porque permite alcançar maiores níveis de mineralização (96% após 1 h de reação). No que diz respeito ao BDE-100, aproximadamente 68% da concentração inicial deste químico em água foi degradada após 5 min de exposição à luz UV-Vis (([BDE-100]0 = 50 µg/L e 1.6×10⁻⁶
Einstein/s).
Figure 1.1. Relative contribution of the different analytical methodologies used for paraquat quantification in water matrices (search in data base Scopus, from 1993 to 2013).
8
Figure 1.2. Chemical structure of PBDEs (adapted from [151]). 38 Figure 1.3. Relative contribution of the different degradation technologies used for the treatment of liquids contaminated with PBDEs (search in Scopus data base, from 2003 to 2013).
53
Figure 1.4. Most studied PBDEs congeners (search in Scopus data base, from 2003 to 2013).
53
Figure 1.5. Number of publications performed with BDE-209, BDE-47 and others using different degradation processes (search in data base Scopus, from 2003 to 2013).
54
Figure 1.6. Percentage of publications about PBDEs degradation in liquids conducted at ppm and ppb levels and analytical techniques used.
55
Figure 2.1. Calibration curve for PQ quantification in water by DI-LC-DAD. 91 Figure 2.2. Relative weight of each individual source of uncertainty (bottom-up approach/EURACHEM) for PQ quantification in waters by DI-LC-DAD.
94
Figure 2.3. Global uncertainty of the analytical methodology for PQ quantification in waters by DI-LC-DAD.
95
Figure 2.4. Influence of the presence of FeSO4 in paraquat quantification by
DI-LC-DAD.
96
Figure 2.5. Influence of the presence of Na2SO3 and H2O2 in PQ quantification by
DI-LC-DAD.
97
Figure 2.6. Calibration curve for PQ quantification in water and in different concentrations of Na2SO3 by DI-LC-DAD.
98
Figure 2.7. Optimization of solid phase extraction methodology. 101 Figure 2.8. Relative weight of each individual source of uncertainty (bottom-up approach/EURACHEM) for PQ quantification in waters by SPE-LC-DAD.
103
Figure 2.9. Global uncertainty of the analytical methodology for PQ quantification in waters by SPE-LC-DAD.
103
Figure 2.10. Calibration curve for PQ quantification in water by DI-LC-MS. 106 Figure 2.11. Relative weight of each individual source of uncertainty (bottom-up approach/EURACHEM) for PQ quantification in waters by DI-LC-MS.
108
Figure 2.12. Global uncertainty of the analytical methodology for PQ quantification in waters by DI-LC-MS.
108
Figure 3.1. Effect of some parameters on the percentage of PQ extraction from S3 deposit and on the concentration factor (CF): (a) Effect of extraction solvent type – 0.5 g S3, 10 mL of extraction solvent, 24 h, 20 °C; (b) Effect of extraction solvent
volume – 0.5 g S3, saturated ammonium chloride solution, 24 h, 20 °C and (c)
effect of extraction time – 0.5 g S3, 1 mL saturated ammonium chloride solution, 20 °C. Error bars correspond to standard deviation.
119
Figure 3.2. Interference studies in the paraquat and diquat quantification. 121 Figure 3.3. Calibration curve obtained for PQ-S3 system by LC-DAD. 122 Figure 3.4. (a) Contribution of each source of uncertainty to the global uncertainty for different PQ contamination levels and (b) combined and expanded global uncertainty for PQ analysis in the S3 deposit.
123
Figure 4.1. Effect of stirring speed (a) and particle size (b) on the adsorption of PQ on S3 deposit; (a) 50 mg/L PQ, 7 g/L S3, 20 °C, average particle diameter of 165 µm
and pH = 7.2; (b) 50 mg/L PQ, 7 g/L S3, 20 °C, stirring speed of 583 rpm and pH =
7.2. Dashed line corresponds to the pseudo-second order fitted model.
136
Figure 4.2. Effect of the initial PQ concentration on the adsorption of PQ on different pipe deposits: (a) S2 – 3 g/L S2, 20 °C, 583 rpm and pH = 3.3 (a); (b) S3 – 7
g/L S3, 20 °C, 583 rpm and pH = 7.2; (c) S4 – 7 g/L S4, 20 °C, 583 rpm and pH = 9.0.
Dashed lines correspond to the pseudo-second order fitted model.
137
Figure 4.3. Adsorption of PQ on clay – 0.3 g/L clay, 5 mg/L PQ, 20 °C, 583 rpm and
pH = 5.3. Dashed line corresponds to the pseudo-second order fitted model.
138
Figure 4.4. Temperature effect in the kinetic adsorption of PQ on different pipe deposits: (a) S2 – 20 mg/L PQ; 3 g/L S2, 583 rpm and pH = 3.3 (a); (b) S3 – 50 mg PQ/7 g S3, 583 rpm and pH = 7.2; (c) S4 – 5 mg PQ/7 g S4, 583 rpm and pH = 9.0. Dashed lines correspond to the pseudo-second order fitted model.
141
Figure 4.5. Temperature effect in the adsorption isotherm of PQ on different pipe deposits: (a) S2 – 3 g/L S2, 583 rpm and pH = 3.3 (a); (b) S3 – 7 g/L S3, 583 rpm and pH = 7.2; (c) S4 – 7 g/L S4, 583 rpm and pH = 9.0. Lines represent fit by Langmuir model.
143
Figure 4.6. Variation of PQ desorption percentage in successive extractions of deposits with CaCl2.
147
Figure 5.1. Emission spectrum of a 150 W medium-pressure mercury vapor lamp from Heraeus.
158 Figure 5.2. Temperature effect on the PQ concentration evolution (a) and on the TOC removal (b) as a function of time ([H2O2]0 = 3.4×10⁻² M, [Fe2+]0 = 5.0×10⁻⁴ M,
pH0 = 3.0 and [PQ]0 = 3.9×10⁻⁴ M). Dashed lines are merely illustrative of the data
trend.
160
Figure 5.3. Fe2+ concentration effect on the PQ degradation (a) and on the TOC removal (b) as a function of time (T = 30.0 °C, pH0 = 3.0, [H2O2]0 = 3.4×10⁻² M, and
[PQ]0 = 3.9×10⁻⁴ M). Dashed lines are merely illustrative of the data trend.
161
Figure 5.4. H2O2 concentration effect on the PQ degradation (a) and on the TOC
removal (b) as a function of time (T = 30.0 °C, pH0 = 3.0, [Fe2+]0 = 5.0×10⁻⁴ M, and
[PQ]0 = 3.9×10⁻⁴ M). Dashed lines are merely illustrative of the data trend.
163
Figure 5.5. Initial pH effect on the PQ degradation (a) and on the TOC removal (b) as a function of time (T = 30.0 °C, [Fe2+]0 = 5.0×10⁻⁴ M, [H2O2]0 = 1.6×10⁻² M, and
[PQ]0 = 3.9×10⁻⁴ M). Dashed lines are merely illustrative of the data trend.
164
Figure 5.6. Iron salt effect on the PQ degradation at pH0 = 2 (a), pH0 = 3 (b) and at
pH0 = 5 (c) as a function of time (T = 30.0 °C, [Fe2+ or Fe3+]0 = 5.0×10⁻⁴ M, [H2O2]0 =
1.6×10⁻² M, [PQ]0 = 3.9×10⁻⁴ M). Dashed lines are merely illustrative of the data
trend.
166
Figure 5.7. Initial PQ concentration effect on the PQ degradation (a) and on the TOC removal (b) as a function of time (T = 30.0 °C, [Fe2+]0 = 5.0×10⁻⁴ M, [H2O2]0 =
1.6×10⁻² M, and pH
0 = 3.0). Dashed lines are merely illustrative of the data trend.
168
Figure 5.8. Mode of hydrogen peroxide addition effect on the PQ degradation (T = 30.0 °C, [Fe2+]0 = 5.0×10⁻⁴ M, [H2O2]T = 1.6×10⁻² M, [PQ]0 = 3.9×10⁻⁴ M and pH0 =
3.0). Dashed lines are merely illustrative of the data trend.
169
Figure 5.9. Gramoxone commercial PQ vs. analytical standard degradation as a function of time (T = 30.0 °C, [Fe2+]0 = 5.0×10⁻⁴ M, [H2O2]0 = 1.6×10⁻² M, [PQ]0 =
3.9×10⁻⁴ M and pH
0 = 3.0). Dashed lines are merely illustrative of the data trend.
172
Figure 5.10. Physical meanings of m and b terms of the Behnajady et al. [24] model.
171
Figure 5.11. Linearization of the kinetic model (equation 5.7) for one experiment (pH0 = 3.0; [PQ]0 = 3.9×10⁻⁴ M; [H2O2]0 = 1.6×10⁻² M; [Fe2+]0 = 5.0×10⁻⁴ M and T =
30.0 °C).
172
Figure 5.12. Relation between the initial hydrogen peroxide concentration and the inverse of the term m (equation 5.8).
175
Figure 5.13. Relation between the initial hydrogen peroxide concentration and the inverse of the term b (equation 5.9).
175
Figure 5.14. Relation between the inverse of the absolute temperature and the inverse of the term m (equation 5.10).
176
Figure 5.15. Relation between the absolute temperature and the inverse of the term b (equation 5.9).
176
Figure 5.16. Comparison of the experimental data with the model predictions by equations 5.3, 5.13 and 5.14 - continuous lines.
178
Figure 5.17. Assessment of the model response (continuous lines) for two different experiments conducted under conditions (a) within the range considered in the parametric study [a1 - ([H2O2]0= 3.4x10⁻² M, [Fe2+]0= 5.0x10⁻⁴ M, [PQ]0= 3.9x10⁻⁴
M, pH0= 3 and T= 40 °C); a2 - ([H2O2]0= 1.0x10⁻² M, [Fe2+]0= 5.0x10⁻⁴ M, [PQ]0=
3.9x10⁻⁴ M, pH0= 3 and T= 30 °C)] and (b) out of the range of conditions considered
in the parametric study [b1 - ([H2O2]0= 3.4x10⁻² M, [Fe2+]0= 8.0x10⁻⁵ M, [PQ]0=
3.9x10⁻⁴ M, pH0= 3 and T= 30 °C); b2 - ([H2O2]0= 3.0x10⁻³ M, [Fe2+]0= 5.0x10⁻⁴ M,
[PQ]0= 3.9x10⁻⁴ M, pH0= 3 and T= 30 °C)].
179
Figure 5.18. Parity plot comparing data used in the kinetic model and data gathered in and out of the range considered to develop the model.
180
Figure 5.19. Proposed pathway for PQ degradation during classic Fenton (adapted from [2]).
181
Figure 5.20. Treatment of PQ-contaminated waters by photo-Fenton (T= 30 °C,
[Fe2+]0 = 5.0×10⁻⁴ M, [H2O2]0 = 1.6×10⁻² M, and pH0= 3.0, for [PQ]0 = 100 mg/L): (a)
PQ degradation and (b) mineralization degree along time.
182
Figure 6.1. Effect of chlorobenzene volume (a), acetonitrile volume (b), extraction time (c) and salt addition (d) on the enrichment factor and extraction recovery for BDE-100.
195
Figure 6.2. Contribution of each source of uncertainty to the total uncertainty – U1: standards preparation, U2: calibration curve, U3: precision and U4: accuracy (a) and global uncertainty (b) for BDE-100 analysis in water by DLLME-GC-MS.
200
Figure 6.3. Chromatogram of a standard solution of PBDEs at individual concentration of 1 µg/L.
202
Figure 7.1. Emission spectrum of a 150 W medium-pressure mercury vapor lamp from Heraeus.
209
Figure 7.2. BDE-100 degradation in water by photolysis using different light intensities ([BDE-100]0= 50 µg/L; pH0= 3.0 and T= 25±3 °C).
213
Figure 7.3. Dye concentration along the degradation of BDE-100 by photolysis. 215 Figure 7.4. BDE-100 degradation in water by photolysis (A – [BDE-100]0 = 50 µg/L,
1.6×10⁻⁶ Einstein/s) and photo-Fenton (B – [BDE-100]
0 = 50 µg/L, [H2O2]0 = 1×10⁻⁴
M, [Fe2+]
0 = 3×10⁻⁶ M, 1.6×10⁻⁶ Einstein/s).
216
Figure 7.5. BDE-100 degradation in water by photolysis (A – [BDE-100]0 = 50 µg/L,
1.6×10⁻⁶ Einstein/s) and photo-Fenton (B – [BDE-100]0 = 50 µg/L, [H2O2]0 = 2×10⁻⁴
M, [Fe2+]0 = 3×10⁻⁶ M, 1.6×10⁻⁶ Einstein/s; C – [BDE-100]0 = 50 µg/L; [H2O2]0 =
1×10⁻⁴ M, [Fe2+]0 = 6×10⁻⁶ M, 1.6×10⁻⁶ Einstein/s).
217
Table 1.1. Physical and chemical properties of paraquata. 6 Table 1.2. Studies found in the literature concerning the determination of paraquat in waters by electrochemical methods.
10
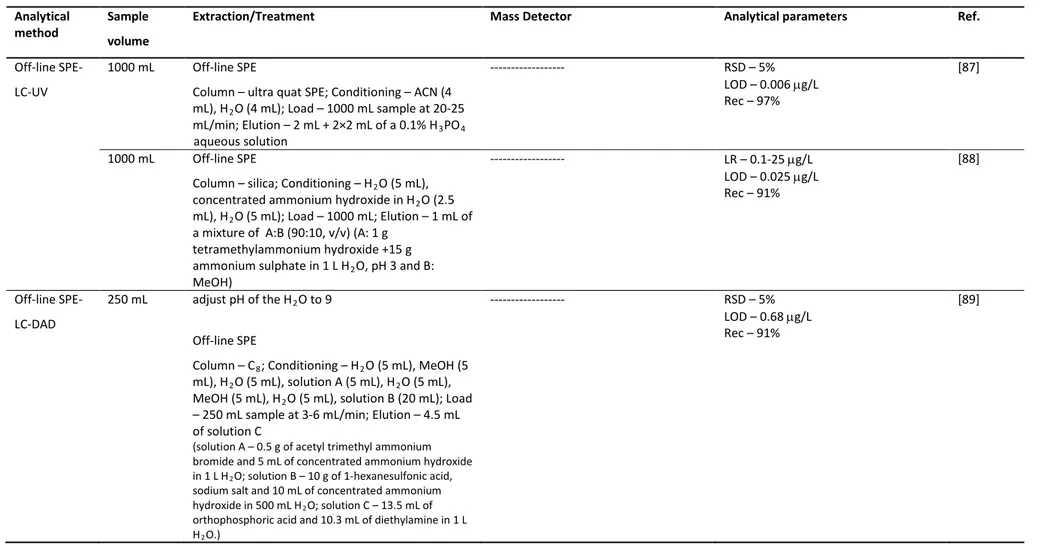
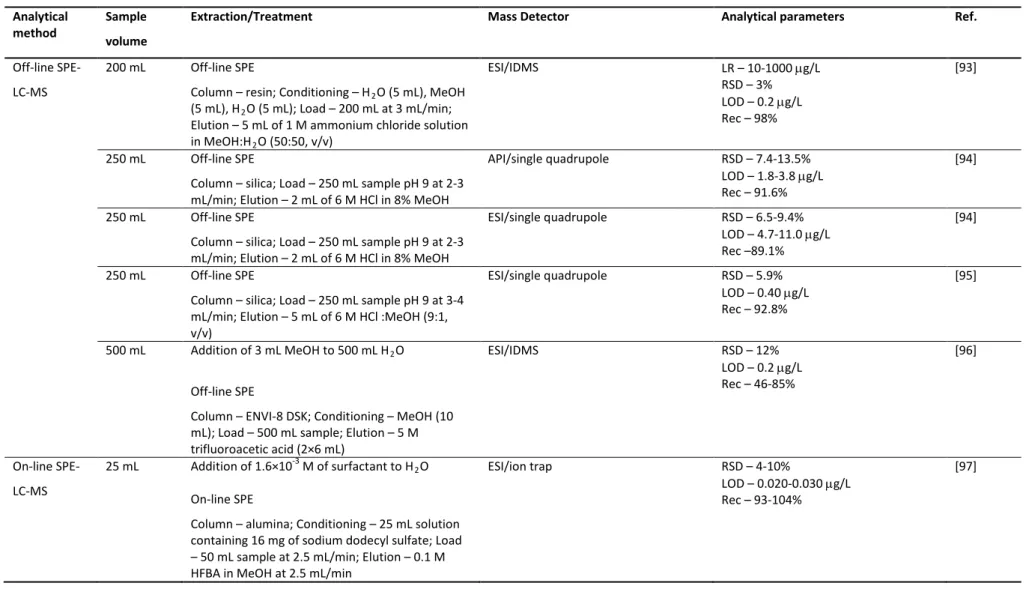
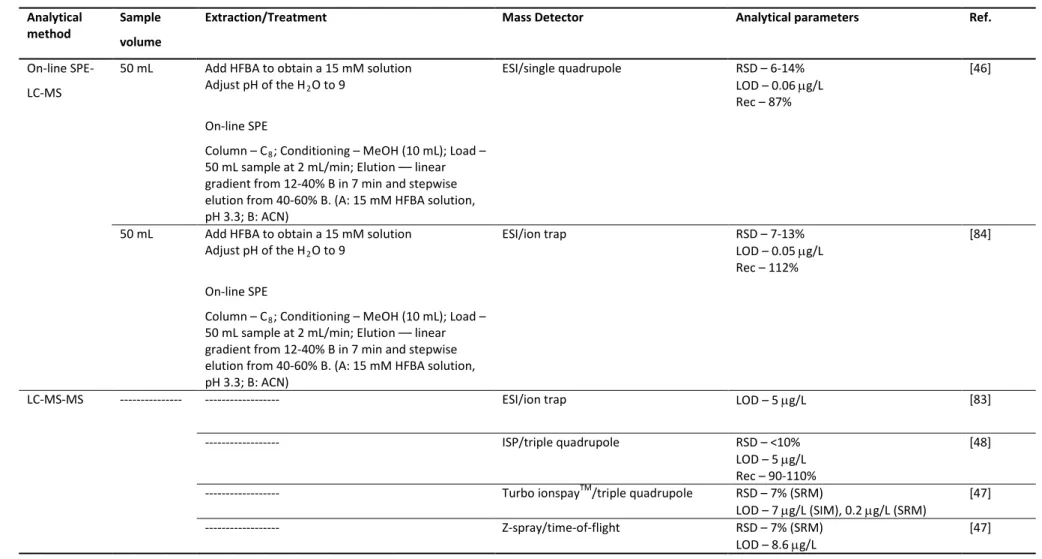
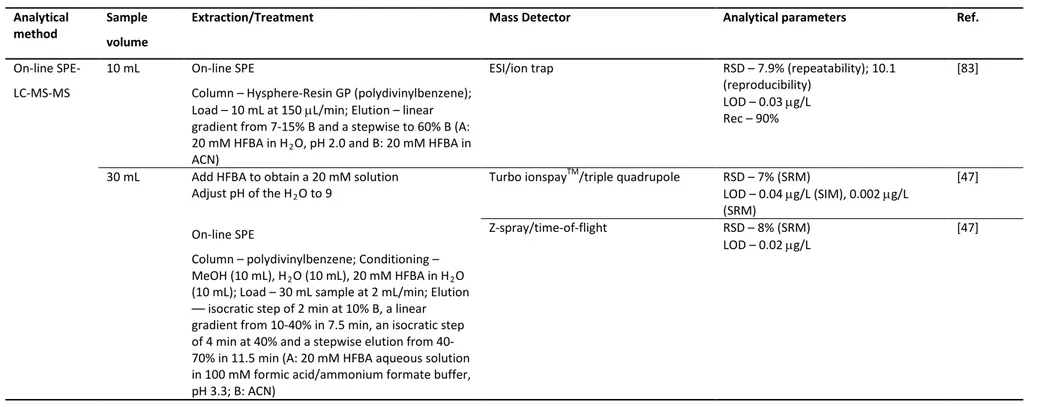
Table 1.3. Studies found in the literature concerning the determination of paraquat in waters by liquid chromatography.
14
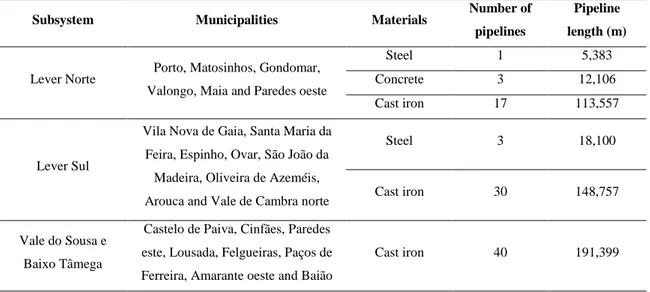
Table 1.4. Constitution of the water supply network of the South Oporto metropolitan area, Portugal (information supplied by AdDP).
24 Table 1.5. Studies found in the literature concerning the analytical methods for paraquat quantification in soils.
26
Table 1.6. Studies found in the literature about paraquat adsorption on soils, clays and other solids.
30
Table 1.7. Studies reported in the literature about paraquat degradation in water by AOPs.
35
Table 1.8. Physical and chemical properties of technical PBDE mixtures (adapted from [163]).
40
Table 1.9. Some physical and chemical properties of BDE-100. 40 Table 1.10. Studies found in the literature about the analytical methods for PBDEs quantification in waters.
42
Table 1.11. Studies found in the literature about the analytical methods for PBDEs quantification in soils.
46
Table 1.12. Studies found in the literature concerning the photodegradation studies of PBDEs in liquid mediums.
56
Table 2.1. Physical-chemical composition of the deposits [4] and clay and main characteristics.
88
Table 2.2. Precision of the DI-LC-DAD method for analytical standards. 92 Table 2.3. Recovery assays of the DI-LC-DAD analytical method. 93 Table 2.4. Quantitative parameters obtained from PQ analysis in water by SPE-LC-DAD.
101
Table 2.5. Optimal mass spectrometry conditions for PQ determination. 105 Table 2.6. Quantitative parameters obtained from PQ analysis in water by DI-LC-MS.
106
Table 2.7. Analytical method precision for analytical standards. 107 Table 3.1. Extraction percentages, precision and recovery for PQ-S2 and PQ-S4 systems.
124
Table 4.1. Physical-chemical composition of the real deposits [4] and clay. 131 Table 4.2. Kinetic parameters for adsorption of PQ on deposits and clay. 135 Table 4.3. Parameters of adsorption isotherms for PQ on deposits and clay. 144 Table 5.1. Condition employed in all the experiments done and obtained m and b parameters for each case (equation 5.7).
173
Table 5.2. Estimative apparent order dependency of parameters m and b on the oxidant, catalyst and parent compound concentrations and the absolute temperature – equations 5.11 and 5.12.
177
Table 6.1. Retention time, quantification and qualifier ions for each PBDE by GC-MS.
192
Table 6.2. Analytical responses and extraction recoveries obtained when different extraction and dispersive solvents were used on DLLME technique.
194
Table 6.3. Precision and recoveries obtained for BDE-100 standards and spiked water samples.
199
Table 6.4. Extraction recoveries, precision and estimated LOQ for all PBDEs by DLLME-GC-MS.
201
Table 7.1. Intensity of incident light, for different dye concentrations, determined by potassium ferrioxalate actinometry at 366 nm.
213
Abbreviations
AC – acetone ACN – acetonitrile AO – anodic oxidationAPI – atmospheric pressure ionization BFRs – brominated flame retardants BiFE – bismuth-film electrode CAC – activated carbon F300 CB – chlorobenzene
CCG – chemically converted graphene
CDPV – cathodic differential pulse voltammetry CF – chloroform
CFe – classic Fenton
CPE – cloud point extraction CTC – carbon tetrachloride CV% – coefficient of variation
CZE-DAD – capillary zone electrophoresis with diode array detector DAD – diode array detector
DCM – dichloromethane
DI-LC-DAD – direct injection-liquid chromatography-diode array detector DI-LC-MS – direct injection-liquid chromatography-mass spectrometry detector DLLME – dispersive liquid-liquid microextraction
DLLME-GC-MS – dispersive liquid-liquid microextraction-gas chromatography-mass spectrometry detector
DNA/CILE – carbon ionic liquid electrode modified by a deoxyribonucleic acid film DPV – differential pulse voltammetry
DQ – diquat
DWDS – drinking water distribution system ECD – electron capture detector
EDTA – ethylenediaminetetraacetic acid EFe – electro-Fenton
EF – enrichment factor
EI – electronic impact ionization
EPS – extracellular polymeric substances %ER – extraction recovery in percentage ESI – electrospray ionization
FAP-CPE – carbon paste electrode impregnated with fluoroapatite FR – flame retardants
GA-MSPD – graphene-assisted matrix solid-phase dispersion GC – gas chromatography
GC-MS – gas chromatography-mass spectrometry
GE/AuNPs – gold electrode modified with gold nanoparticles
GE/AuNPs/DNA – gold electrode modified with gold nanoparticles and deoxyribonucleic acid
GMX – gramoxone
GPC – gel permeation chromatography
HAP/CPE – carbon paste electrode modified by hydroxyapatite HFBA – heptafluorobutyric acid
HF-LPME – hollow-fiber liquid phase microextraction
HF-MMLLE – hollow-fiber microporous membrane liquid-liquid extraction HRGC-HRMS – high resolution gas chromatography and mass spectrometry HS-SPME – headspace solid-phase microextraction
IDMS – isotope dilution mass spectrometry
ISO – International Organization for Standardization ISP – ionspray ionization
LC – liquid chromatography
LC-DAD – liquid chromatography-diode array detector LC-MS – liquid chromatography-mass spectrometry detector LC-MS-MS – liquid chromatography-tandem mass spectrometry LC-TSP-MS – liquid chromatography thermospray mass spectrometry LC-UV – liquid chromatography-ultraviolet detector
LLE – liquid-liquid extraction
LLE-LC-MS/MS – liquid-liquid extraction–liquid chromatography–tandem mass spectrometry
LOD – limit of detection LOQ – limit of quantification LR – linearity range
MAE – microwave-assisted extraction MeOH – methanol
MS –mass spectrometry detector
MSWV – multiple square-wave voltammetry MTBE – methyl tert-butyl ether
MWCNTs-DHP/CG electrode – glassy carbon electrode modified with multiwalled carbon nanotubes within a dihexadecylhydrogen phosphate film
NCGCE – nafion coated glassy carbon electrode NCME – nafion/clay modified electrode
NFGCE – nafion film coated glassy carbon electrode
NP-CPE – carbon paste electrode modified with natural phosphate
OPG/CoPc – ordinary pyrolitic graphite electrode modified by cobalt phthalocyanine OUR – oxygen uptake rate
PBDEs – polybrominated diphenyl ethers PBDFs – polybrominated dibenzofurans PCBs – polychlorinated biphenyls PDMS – polydimethylsiloxane PEF – photoelectro-Fenton; PLE – pressurized liquid extraction
PM-β-CD/OH-TSO – permethylated-β-cyclodextrin/hydroxyl-termination silicon oil POPs – persistent Organic Pollutants
PP – polypropylene PQ – paraquat dichloride QA – quaternary ammonium Rec% – recovery in percentage RSD% – relative standard deviation
SBSE – stir bar sorptive extraction SDME – single-drop microextraction
SFOME – solidification of floating organic drop microextraction SIA – sequential injection analysis
SIM – selected ion-monitoring
SIMS – static secondary ion mass spectrometry SOM – soil organic matter
SP – solid phase
SPE – solid phase extraction
SPE-LC-DAD – solid phase extraction-liquid chromatography-diode array detector SRM – selected reaction monitoring
SWV – square-wave voltammetry TAC – tire-derived adsorbent
TA-IL-DLLME – temperature-assisted–ionic liquid–dispersive liquid-liquid microextraction TCE – 1,1,2,2-Tetrachloroethane
TD-GC-MS – thermal desorption-gas chromatography-mass spectrometry THF – tetrahydrofuran
UABE – ultrasound assisted back extraction UAE – ultrasound-assisted extraction
USAEME – ultrasound-assisted emulsification-microextraction UV – ultraviolet
WWTP - waste water treatment plant µECD – micro-cell electron capture detector µSPE – micro-solid-phase extraction
Notation
ocK – organic carbon-normalized sorption coefficient
max
q – maximum adsorption capacity of Langmuir isotherm (mg/g) L
K – adsorption equilibrium constant of Langmuir isotherm (L/mg) MSC – mathematic/model selection criterion
f
K – adsorption equilibrium constant of Freundlich isotherm (mg/g/(mg/L)1/n)
n – constant of Freundlich isotherm
A– constant of Temkin isotherm (L/mol) B– constant of Temkin isotherm (Jg/mol2) R – correlation coefficient
T – temperature (K or °C)
Ea– apparent activation energy (kJ/mol) e
q – paraquat concentration in the solid in the equilibrium(mg/g)
q – paraquat concentration in the solid at time t (mg/g)
t – time (min or h)
1
k – adsorption kinetic constant of pseudo-first order model (L/g/min)
2
k – adsorption kinetic constant of pseudo-second order model (L2/min/g/mg)
Greek symbols
ϕ – photonic flux (Einstein/s)
Although our planet is called “blue planet” (once 70% of it is covered with water), only 2% is freshwater for human use, because the major part corresponds to oceans, where the water is too salty to drink and inadequate for many applications. Of the freshwater available on Earth, about 99% is in ice and groundwater (water underground in aquifers). Although groundwater resources exceed salt-free surface water on earth, typically only individual households and small towns may be served sufficiently by groundwater from wells or springs. Large cities tend to use surface water and centralize water treatment and distributions systems. The amount of surface water available to drink is dramatically affected by the seasons, weather patterns and long-term shifts in climate. Additionally, surface water is more likely to suffer anthropogenic contamination than groundwater due to its proximity. Surface, and in some cases groundwater, could be polluted by exposition to acid rain, storm water runoff, sewage overflow, agricultural runoff and industrial waste. Microbial pollution of drinking water has been considered the most threat for human health for many years [1] but there are well established and robust methods for protecting drinking water from that [2]. On the other hand, while the consequences of microbial contamination are quickly and fairly easily identified, chemical contamination is usually much more insidious with effects not seen until the source has been in use for a considerable period, usually many years.
Water plays an important role in our life being imperative to human and ecosystem health and is the base for an economic welfare. Due to the extreme importance of this source, water and particularly drinking water has been often a political or military target [3]. For that also contribute the several points of vulnerability of a water distribution system: the catchment, the raw water transport system, the treatment facilities, the water reservoirs and the distribution systems. In this perspective, Peter H. Gleick reports a lot of situations where water or systems were used as delivery vehicles to cause violence to a human population [4]. A great concern about this issue has been generated and a lot of measures have been taken to limit the impact that these kind of attacks could represent for human life. Protection and surveillance of water infrastructures, the detection of water quality deterioration in drinking water distribution systems and operational procedures for decontamination of water infrastructures are needed to 3
prevent or to restore quickly the functionality of the distribution system after a deliberate (or accidental) contamination. In this context, and with some experience gained in the past with other related projects, SecurEau, an European project (FP7-SEC-2007-1), entitled “Security and decontamination of drinking water distribution systems following a deliberate contamination”, was established [5]. As mentioned before, the intent of SecurEau was to serve as a demonstration project for designing and implementing an effective and timely response on CBRN (chemical, biological and radionuclide) agents. The work done during the four years of the project duration and now presented in this thesis had the intention to minimize some gaps related to the feasibility of the detection and remediation methods, to quickly detect and eliminate the contamination, especially that originated by emergent chemicals. The work done in this thesis was focused in two chemicals (an herbicide and a flame retardant) among the five ones selected by SecurEau team. Paraquat (herbicide) and BDE-100 (flame retardant) were chosen to be target compounds due to their different physical-chemical characteristics which determine the final effects in consumers as well as in sorption, dispersion and the accumulation patterns in case of a deliberate contamination of drinking water distribution systems. Paraquat is included in the “old” toxicants that may be easily acquired and manipulated, despite of the effective control measures, and BDE-100 represents the “new” ones with lethal effects at extremely low doses.
A state of the art concerning the topics covered during the thesis period is set out below. First, a literature review about analytical methods for identification and quantification of each chemical in water and soils (because no studies were found for deposits from drinking water networks) was made. Indeed, in case of a deliberate or accidental contamination event, appropriate analytical methodologies should be used to rapidly detect and quantify the contaminants in these matrices. Water should be the first matrix of being contaminated but, depending on the affinity of such compounds for the pipe walls, deposits and/or biofilms could also be crucial zones of contaminants accumulation. So, it has to be made sure that the deposits are not long-term reservoirs from which the contaminants leach into the system, possibly with patches release from the surfaces. Since the adsorption/desorption of the contaminants on deposits from drinking water networks dictates the dispersion and accumulation of them throughout the network, the interaction of the target chemicals on solids was other topic well reviewed (again no 4
published data was found concerning interactions with pipe deposits). Finally, an overview of the existing degradation methodologies for the treatment of waters contaminated with the target chemicals was performed. Actually, the implementation of efficient cleaning procedures is one of the main goals of this study.
1.1 Paraquat
Paraquat was first synthesized in 1882 [6]. Since 1933, it has been used as redox indicator (under the name methyl viologen) in chemical laboratories [6]. Its herbicidal properties were discovered in 1957 and one year later paraquat was introduced by Imperial Chemical Industries [6]. In 1962, paraquat began to be marketed as a highly effective contact herbicide [6]. Nowadays, this bipyridylium compound is widely used as herbicide around the world (nearly 90 countries), despite of being prohibited in Europe [7]. Its popularity is related to its quick and non-selective action to kill green plant tissue upon contact. Some studies proved that paraquat is one of the few herbicides capable of controlling the growth of weeds that became resistant as a result of over-use of non-selective glyphosate herbicides [8, 9]. Paraquat is denoted as a class I toxicological agent, being considered as possible carcinogenic and mutagenic molecule [10-12]. Its toxicity is associated with the reduction of the bivalent cation (PQ2+) to a free radical (PQ•+), which reacts with oxygen to form a superoxide radical (O2-•), hydrogen peroxide (H2O2) and
hydroxyl radical (OH•) [12]. Since the produced radicals are unstable and reactive, they cause lesions in the cellular membrane, protein and DNA [13]. Paraquat is often encountered in cases of poisoning [14-16]. Chronic and acute exposition effects caused by casual ingestion or poisoning with paraquat are well known and have been documented in the literature [17-19]. Some of these studies report respiratory distress [16, 20], neurodegenerative disorder of the nervous system (such as Parkinson’s disease) [21, 22] and effects on the kidneys [20].
The uncontrolled and abusive use of paraquat has generated a great concern related to the potential risk that it represents to humans, animals and the environment [23]. For such feelings have contributed the long residence time of paraquat in the environment (it is a non-biodegradable and highly persistent molecule), its elevated toxicity, even at low doses, its large availability and its relatively low cost [10, 11, 24].
The main physical-chemical characteristics of paraquat are indicated in Table 1.1, where it can be seen that this chemical has extremely high water solubility.
Table 1.1. Physical and chemical properties of paraquata.
Chemical structure Common Name CAS n.º Molecular formula Molecular weight Solubility in water at 25 °C (g/L) Melting point (°C) Boiling point (°C) Vapor pressure (mmHg) Henry’s constant
(atm. m3/mol) Log Kow
Paraquat 1910-42-5 C12H14N2Cl2
257.18 g/moL
620 108.59 351.92 1.01×10⁻⁷ 3.22×10⁻¹³ -4.5
aValues were extracted from EPI Suite TM, copyright 2000-2012 Environmental Protection Agency, United States.
This property together with those presented before, such as availability, low cost and high toxicity, support the idea that it could be a strong candidate to be used in a deliberate contamination; that’s why it was selected as model compound in SecurEau project. Additionally, this polar herbicide is positively charged, non-volatile, thermally stable and stable in acidic conditions [25]. Paraquat hydrolyzes at pH levels above 12 [26]. Concerning the European Union drinking water legislation, there are no established values specifically for paraquat, but a maximum individual pesticide concentration in drinking water was set at 0.1 µg/L [27].
1.1.1 Analytical methods for paraquat detection and quantification in waters Due to the intensive use of paraquat and other pesticides on agriculture, and because the interaction between such compounds with soils determines their biological activity, mobility and degradation, the sorption of pesticides on soil has been subject of numerous studies [28-36]. Indeed, the inaccessibility of micropores to microbes, the surface stabilization against desorption of the pesticide and the reduction of aqueous-phase concentrations to levels below those necessary for microbial utilization, compromise the microbial attack of the compounds that are sorbed to inorganic/organic surfaces [37]. In the particular case of paraquat, the interaction with clays, which are the main components of the mineral fraction of soils, and organic matter, is very rapid and strong [34, 38, 39]. In some cases, this non-selective herbicide is inactivated by irreversible 6
adsorption on clays [40, 41]. Although this fact may induce the conclusion that paraquat could be considered as safe for many agricultural uses, it has been detected in waters. Watercourse contamination may result from a vertical transport through the soil profile promoted by the dissolved colloids such as dissolved organic matter and dispersed colloidal clay [29]. Fernández et al. analyzed water samples from irrigation channels, rivers and lagoons taken from three different marsh areas of the Valencian community (Spain) and a paraquat concentration of 3.95 µg/L was detected [42]. More recently (2006), paraquat concentrations between 1.5 and 18.9 µg/L and 9.3 and 87.0 µg/L were found in ground and surface water of Thailand, respectively [36]. Even at very low doses, this herbicide can pass some treatment steps and reach the water distribution systems, posing a threat to human health. Beyond the natural occurrence of paraquat in drinking water due to its large usage in some countries, its presence may be the result of a deliberate or accidental contamination [43, 44], which is the main focus of this thesis [5]. In those circumstances, the paraquat concentration in water could be very high, partially due to its high solubility in water. Thus, effective analytical methods for paraquat quantification in waters are required.
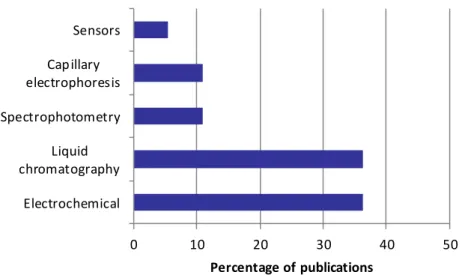
Paraquat is a cationic compound extremely soluble in water and non-volatile, which makes its analysis rather difficult [45-47]. Many analytical approaches have been proposed for paraquat determination in water matrices: liquid chromatography, gas chromatography, voltammetry, capillary electrophoresis, spectrophotometry and sensors. The number of publications found in the literature about the application of each technique for such purpose is depicted in Figure 1.1.
As shown, the two most used techniques for paraquat quantification in water matrices are liquid chromatography and electrochemical processes, followed by spectrophotometry and capillary electrophoresis. Sensors represent the less popular alternative (5% of the studies). Gas chromatography was not accounted for this list because its applicability is quite difficult under this context, unless an extensive sample preparation and derivatization procedures were programmed before the analysis [48]. Sensors offer some advantages over the conventional chromatographic and electrophoretic based methods, such as lower cost and higher simplicity of use, ability to measure pollutants in complex matrices with minimal sample preparation and possibility of miniaturization and portability, which allows their use as field devices working on-site 7
[49]. Nevertheless, they are not the preferred technique, as demonstrated by Figure 1.1, which may be due to the higher detection limits attained [50, 51] and the necessity of confirmation methods, even if the contaminant is detected. Although eleven percent of the all studies are related with capillary electrophoresis, the application of this technique combined with ultraviolet (UV), diode array (DAD) or even mass spectrometry (MS) detectors generally leads to limits of detection higher than the EU legislated level (0.1 µg/L) [47]. 0 10 20 30 40 50 Electrochemical Liquid chromatography Spectrophotometry Capillary electrophoresis Sensors Percentage of publications
Figure 1.1. Relative contribution of the different analytical methodologies used for paraquat quantification in water matrices (search in data base Scopus, from 1993 to 2013).
On the other hand, capillary electrophoresis suffers from the instability of reagents, interferences, extensive sample treatment and high cost per analysis [23, 24]. Spectrophotometry contributes with the same percentage as capillary electrophoretic methods for the overall studies reported in the literature.
The two most popular methodologies (liquid chromatography and voltammetry) are explored in detail below.
1.1.1.1 The particular case of electrochemical methods
Electrochemical methods offer countless advantages in time and cost savings, as well as simplicity. They present many of the requirements for field chemical analysis due to the 8
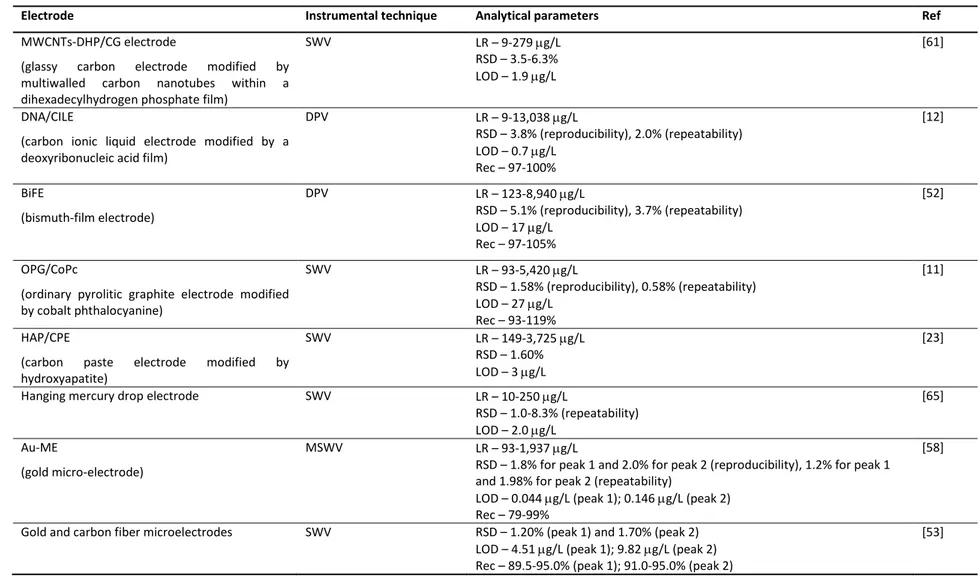
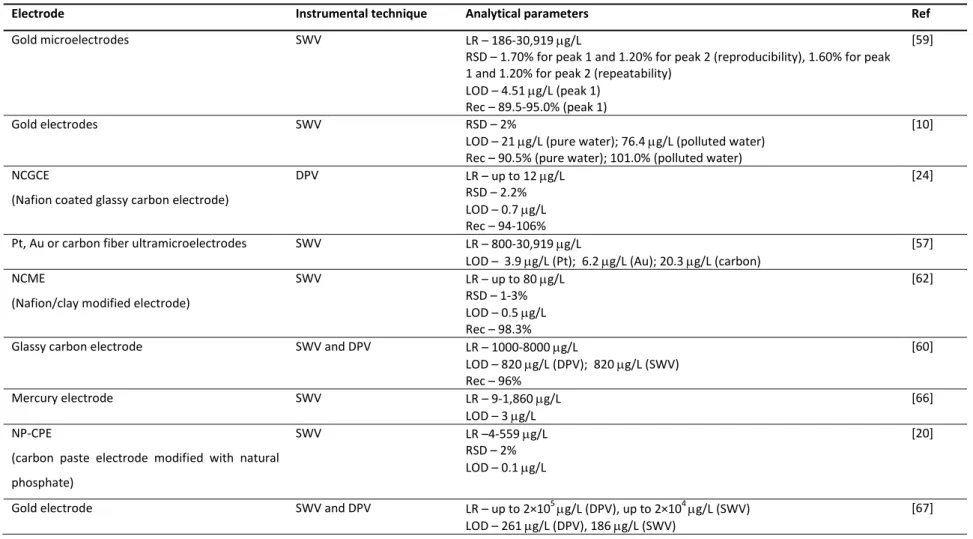
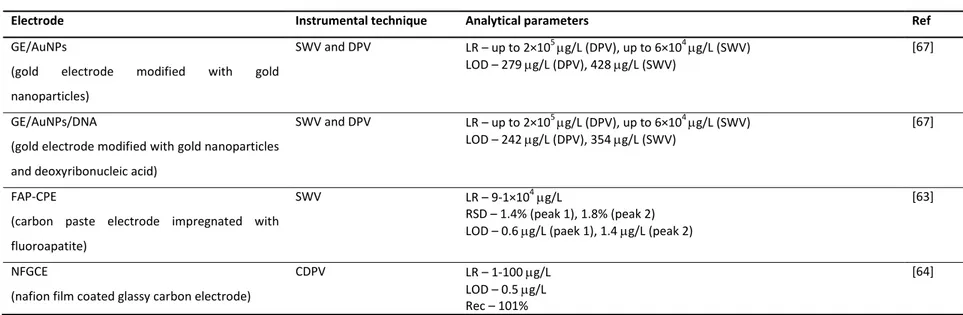
speed in the acquisition of the results, portability and good sensitivity [52]. Table 1.2 compiles all developed electrochemical methods for paraquat quantification in waters. Generally, voltammetric analytical techniques are based on processes occurring at Hg based-surfaces because they allow a well-known and defined electrochemical behavior, high hydrogen overpotential, good stability, reproducibility and sensitivity [53, 54]. However, the high toxicity of mercury has triggered the search for safer alternative electrodes [54-56]. In this context, different electrode materials have been used for paraquat quantification in waters such as gold [10, 53, 57-59], platinum [57] and carbon-based composites [23, 53, 57, 60]. Nevertheless, in the last few years, the development of different types of chemically-modified electrodes has been one of the most promising areas [11]. Chemically-modified electrodes are electrodes made of a conducting or semiconducting material, coated or mixed with a chemical modifier by charge-transfer reactions or interfacial contact [11]. The great advantage of using these electrodes is related to their capacity to act as redox mediators, increasing the charge transfer between the electrode and the redox species, thus promoting an improvement in the analytical sensitivity [11]. With this purpose in mind, different compounds have been studied as chemical modifiers in some electrode types. Concerning paraquat analysis in water, different chemically-modified electrodes are listed in Table 1.2., which exhibit similar (1.9 and 3 µg/L) [23, 61] or higher sensitivity (0.1-0.7 µg/L) [12, 20, 24, 62-64] than mercury electrodes (2 and 3 µg/L) [65, 66]. Although some of these modified electrodes have attractive limits of detection, serious interferences from surfactants and humic substances are sometimes reported [24].
Beyond the electrode surface composition, the size of this device is another factor that may influence the sensitivity of the method. Microelectrodes [53, 58, 59] and ultramicroelectrodes [57] proved to provide lower limits of detection (4-20 µg/L) than the others of the same material (20-820 µg/L) [10, 60, 67]. The ultramicroelectrodes promote a significant improvement of the quality of the results by increasing the resolution and the current density and decreasing the resistance effects of the solution [68].
Table 1.2. Studies found in the literature concerning the determination of paraquat in waters by electrochemical methods.
Electrode Instrumental technique Analytical parameters Ref
MWCNTs-DHP/CG electrode
(glassy carbon electrode modified by multiwalled carbon nanotubes within a dihexadecylhydrogen phosphate film)
SWV LR – 9-279 µg/L
RSD – 3.5-6.3% LOD – 1.9 µg/L
[61]
DNA/CILE
(carbon ionic liquid electrode modified by a deoxyribonucleic acid film)
DPV LR – 9-13,038 µg/L RSD – 3.8% (reproducibility), 2.0% (repeatability) LOD – 0.7 µg/L Rec – 97-100% [12] BiFE (bismuth-film electrode) DPV LR – 123-8,940 µg/L RSD – 5.1% (reproducibility), 3.7% (repeatability) LOD – 17 µg/L Rec – 97-105% [52] OPG/CoPc
(ordinary pyrolitic graphite electrode modified by cobalt phthalocyanine) SWV LR – 93-5,420 µg/L RSD – 1.58% (reproducibility), 0.58% (repeatability) LOD – 27 µg/L Rec – 93-119% [11] HAP/CPE
(carbon paste electrode modified by hydroxyapatite)
SWV LR – 149-3,725 µg/L
RSD – 1.60% LOD – 3 µg/L
[23]
Hanging mercury drop electrode SWV LR – 10-250 µg/L
RSD – 1.0-8.3% (repeatability) LOD – 2.0 µg/L [65] Au-ME (gold micro-electrode) MSWV LR – 93-1,937 µg/L
RSD – 1.8% for peak 1 and 2.0% for peak 2 (reproducibility), 1.2% for peak 1 and 1.98% for peak 2 (repeatability)
LOD – 0.044 µg/L (peak 1); 0.146 µg/L (peak 2) Rec – 79-99%
[58]
Gold and carbon fiber microelectrodes SWV RSD – 1.20% (peak 1) and 1.70% (peak 2) LOD – 4.51 µg/L (peak 1); 9.82 µg/L (peak 2) Rec – 89.5-95.0% (peak 1); 91.0-95.0% (peak 2)
[53]
Table 1.2. Studies found in the literature concerning the determination of paraquat in waters by electrochemical methods (continued).
Electrode Instrumental technique Analytical parameters Ref
Gold microelectrodes SWV LR – 186-30,919 µg/L
RSD – 1.70% for peak 1 and 1.20% for peak 2 (reproducibility), 1.60% for peak 1 and 1.20% for peak 2 (repeatability)
LOD – 4.51 µg/L (peak 1) Rec – 89.5-95.0% (peak 1)
[59]
Gold electrodes SWV RSD – 2%
LOD – 21 µg/L (pure water); 76.4 µg/L (polluted water) Rec – 90.5% (pure water); 101.0% (polluted water)
[10] NCGCE
(Nafion coated glassy carbon electrode)
DPV LR – up to 12 µg/L
RSD – 2.2% LOD – 0.7 µg/L Rec – 94-106%
[24]
Pt, Au or carbon fiber ultramicroelectrodes SWV LR – 800-30,919 µg/L
LOD – 3.9 µg/L (Pt); 6.2 µg/L (Au); 20.3 µg/L (carbon)
[57] NCME
(Nafion/clay modified electrode)
SWV LR – up to 80 µg/L
RSD – 1-3% LOD – 0.5 µg/L Rec – 98.3%
[62]
Glassy carbon electrode SWV and DPV LR – 1000-8000 µg/L
LOD – 820 µg/L (DPV); 820 µg/L (SWV) Rec – 96% [60] Mercury electrode SWV LR – 9-1,860 µg/L LOD – 3 µg/L [66] NP-CPE
(carbon paste electrode modified with natural phosphate)
SWV LR –4-559 µg/L
RSD – 2% LOD – 0.1 µg/L
[20]
Gold electrode SWV and DPV LR – up to 2×10⁵ µg/L (DPV), up to 2×10⁴ µg/L (SWV)
LOD – 261 µg/L (DPV), 186 µg/L (SWV)
[67]
Table 1.2. Studies found in the literature concerning the determination of paraquat in waters by electrochemical methods (continued).
Electrode Instrumental technique Analytical parameters Ref
GE/AuNPs
(gold electrode modified with gold nanoparticles)
SWV and DPV LR – up to 2×10⁵ µg/L (DPV), up to 6×10⁴ µg/L (SWV)
LOD – 279 µg/L (DPV), 428 µg/L (SWV)
[67]
GE/AuNPs/DNA
(gold electrode modified with gold nanoparticles and deoxyribonucleic acid)
SWV and DPV LR – up to 2×10⁵ µg/L (DPV), up to 6×10⁴ µg/L (SWV)
LOD – 242 µg/L (DPV), 354 µg/L (SWV)
[67]
FAP-CPE
(carbon paste electrode impregnated with fluoroapatite)
SWV LR – 9-1×10⁴ µg/L
RSD – 1.4% (peak 1), 1.8% (peak 2) LOD – 0.6 µg/L (paek 1), 1.4 µg/L (peak 2)
[63]
NFGCE
(nafion film coated glassy carbon electrode)
CDPV LR – 1-100 µg/L
LOD – 0.5 µg/L Rec – 101%
[64]
Notes: CDPV – cathodic differential pulse voltammetry; DPV – differential pulse voltammetry; LOD – limit of detection; LR – linearity range; Rec – Recovery; RSD – relative standard deviation; SWV – square wave voltammetry.