Received April 17, 2008 and accepted November 3, 2008. Corresponding author: [email protected]
Simulation of Holstein and Jersey profitability by varying milk price payment
system
1Daniel de Noronha Figueiredo Vieira da Cunha2, José Carlos Pereira3, Oriel Fajardo de Campos4, Sebastião Teixeira Gomes5, José Luis Braga6, Janaina Azevedo Martuscello2
1Financiado pelo CNPq e pela Fapemig.
2Pós-doutorando em Zootecnia – UFV/Departamento de Zootecnia. 3UFV/Departamento de Zootecnia.
4PESAGRO-RJ.
5UFV/Departamento de Economia Rural. 6UFV/Departamento de Informática.
ABSTRACT - The objective of the study was to compare through simulation Holstein and Jersey breed herds, considering the farm size, zootechnical and economic indexes and profitability of the activity, by using different systems of bonus payment for milk price based in percentage of fat and protein in the milk. The comparisons were made, initially, disregarding the bonus payment for milk price based on the increase in the fat and protein percentage in milk. After that, the profitability of the activity was compared considering bonus payment for milk price of the Jersey breed herd, for each unit increment in fat and protein percentage in milk above those obtained with the Holstein breed herd. Finally, the profitability of the activity was compared by using the bonus payment for milk price based on quality of that used by company A systems. When there was no bonus payment for milk price based in the percentage of fat and protein in the milk, the profit obtained with the Holstein breed was higher because of the lower production costs. In order to make the activity more profitable with the Jersey breed, a bonus payment of 5% for milk price would be needed for each percentage unit of fat above the percentage of that obtained with the Holstein breed, or a bonus payment of 10% in the milk price for each percentage unit of protein above the percentage obtained with the Holstein breed. By using the bonus payment system proposed by Gimenes and Ponchio, the annual profit with the Jersey breed was higher than the profit obtained with the Holstein breed. However, with the application of the bonus payment system used by company A, the Holstein breed became more profitable than the Jersey breed.
Key Words: dairy cattle, milk fat, milk protein modeling, simulation
Simulação da rentabilidade de rebanhos Holandês e Jersey variando o
sistema de pagamento pela qualidade do leite
RESUMO -Objetivou-se com este estudo comparar, por meio de simulação, de rebanhos das raças Holandês e Jersey em um sistema de produção de leite em confinamento, considerando o tamanho do rebanho, os índices zootécnicos e econômicos e a lucratividade da empresa, mediante a utilização de um sistema de bonificação pela porcentagem de gordura e proteína do leite. As comparações foram realizadas primeiramente desconsiderando bonificações pela porcentagem de gordura e proteína do leite. Em seguida, a lucratividade foi comparada considerando bonificações no preço pago pelo leite da raça Jersey a cada unidade de acréscimo na porcentagem de gordura e de proteína do leite acima do obtido com a raça Holandesa. Por fim, a lucratividade foi comparada utilizando-se o sistema de bonificação de preço pago com base na qualidade e no preço adotado por uma empresa integrante do mercado de laticínios. Quando não há bonificação no preço pago pelo leite, o lucro obtido com a raça Holandesa é maior, em razão dos menores custos de produção. Para que a atividade com a raça Jersey seja mais lucrativa, é necessária bonificação de 5,0% no preço do leite para cada unidade porcentual de gordura do leite, ou bonificação de 10,0% no preço do leite para cada unidade percentual de proteína do leite, acima daquela obtida com a raça Holandesa. Com a utilização do sistema de bonificação com base na qualidade do leite, o lucro anual com a raça Jersey é maior que o obtido com a raça Holandesa. Entretanto, com a aplicação do sistema de bonificação utilizado pela empresa A, a raça Holandesa torna-se mais lucrativa.
Palavras-chave: gado de leite, gordura do leite, modelagem, proteína do leite, simulação
ISSN 1806-9290 www.sbz.org.br
Introduction
Payment for milk quality has been receiving greater attention in Brazil especially because of the recent creation of the Conselho Nacional de Qualidade do Leite. Because fat and protein are the components of greatest economic value in milk, the payment system should reward them adequately, as it has been done for more than two decades in more developed countries (Madalena, 2000) such as Australia and New Zealand, which are consolidated as large exporter countries.
In countries where there is differentiated payment for milk due to quality, one of the objectives of genetic breeding is to select animals with higher fat and protein productions. In Brazil, the policy of differentiated payment due to milk quality has not been sufficiently publicized yet and what has been happening most often is the establishment of minimum standards to be met for composition or for aspects related to health. However, some dairy plants, interested in acquiring higher standard raw material, have already implemented some type of differentiated payment for fat content, protein and/or total solids. Furthermore, some livestock raisers interested in aggregating value to the product produce some type of dairy derivative from the farm therefore there is interest in changing the milk composition (Cardoso et al., 2004).
In Brazil, most of the systems for producing milk in feedlot use Holstein breed animals or Holstein × Zebu crossbreds, with a “high degree of Holstein blood” (Krug, 2001), such as the Gir breed, which is the most used in the Zebu group. One of the ways to increase the solid content in the milk produced in these systems is to change the genetic group used from Holstein to Jersey. However, this change brings complex impacts, both on the activity income and on the production costs, therefore it should be made based on scientific predictions.
The objective of this study was to assess and to compare, by simulation, the use of herds of the Holstein and Jersey breeds in a milk production system in feedlot, considering the herd size, the technical and economic indices and the profitability of the activity, by using different bonus for payment systems of the price paid for the percentages of milk fat and protein.
Material and Methods
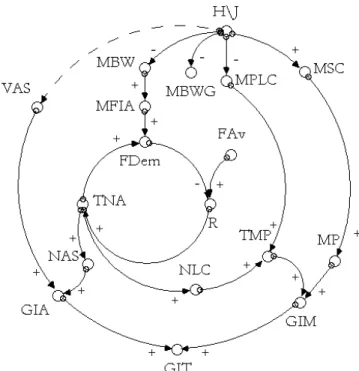
Two diagrams of influences were set out (Figures 1 and 2) to relate the main variables that influence total gross income and the effective operational cost of the activity.
Figure 1 - Main variables of the problem that influence the value of the total gross income of the activity: H\J = change in the genetic group from Holstein to Jersey; VAS = value received per sold animal; MP = milk price; MFIA = mean forage intake per animal; MSC = milk solids; FDem = total forage demand of the herd; FAv = total forage availability on the farm; MBWG = mean body weight gain of the herd; NAS = number of sold animals; TNA = total number of animals; NLC = number of lactating cows; MBW = mean body weight of the animals of the herd; TMP = total milk production; MPLC = milk production per lactating cow; GIA = gross income obtained from the sale of the animals; GIM = gross income obtained from the sale of milk; GIT = total gross income of the production system; R = ratio between total forage demand of the herd and the total forage availability on the farm.
Both the total gross income and the effective operational cost can undergo complex alterations when the change from the Holstein to the Jersey genetic group was considered. Four technical variables are directly influenced by this change: mean body weight of the animals in the herd, mean body weight gain of the animals, milk production per lactating cow and solid concentration in the milk. While the three first variables are reduced, the fourth increases as the genetic group changes.
animal body weight. For this reason, it is expected that the mean forage intake per animal is positively related to the mean body weight of the animals in the herd.
The total forage demand by the herd represents the sum of forage intake of all the animals with the addition of the losses during feed distribution and intake, then, it is positively influenced by the mean forage intake per animal in the head. Forage availability represents the quantity of forage produced on the farm minus the losses in the harvesting and silage processes. Considering the value of forage availability as fixed, the ratio between availability and demand for forage will be negatively influenced only by the total forage demand of the herd.
Assuming the impossibility of buying bulk feeds and replacing part of them by concentrate feeds, the ratio between forage availability and forage demand will determine the total number of animals that can be maintained on the farm under each structure condition of the herd. Because the total number of animals also influences the value of the total forage demand, there is a
feedback loop structure or control feedback of the number of animals in the herd.
In the simulation model used, the ratio between availability and forage demand tended to be 1.0, because at this value the total forage requirement of the herd was equal to forage availability. Because this ratio is smaller than 1.0, the total number of animals is reduced by selling animals from the herd, but when it is greater than 1.0, the total number of animals is increased by purchasing animals on the market.
Fixing the culling rates of animals from the herd, the number of animals sold will be directly related to the total number of animals and, together with the mean price of the animals, it will determine the value of the gross income obtained from the sale of the animals.
Although the change in the genetic group, from Holstein to Jersey, reduces milk production per lactating cow, the total milk production would not necessarily be low, because the mean body weight of the animals in the Jersey herd and the mean forage intake per animal are smaller in this genetic group, therefore, the production system would support a greater total number of animals and a greater number of lactating cows. Furthermore, this change in genetic group results in an increase in the concentration of total milk solids, which in the case of bonus payment of the milk price for increased solids, would positively influence the price paid per liter of milk and the gross income obtained from the sale of the milk.
On the other hand, variations in the milk production values per lactating cow, concentration of milk solids, mean body weight of the animals and mean body weight gain positively influence the average nutritional requirements of the animals in the herd. These requirements are directly related to the mean concentrate intake per animal (Figure 2). Generally, the mean intake of concentrate per animal is negatively related to total forage demand, because of the replacement effect of supplying concentrate over forage intake.
Expenses with using concentrated foodstuffs are directly influenced by the average concentrate intake per animal, the concentrate price and the number of animals in the herd, and they play an important role in the effective operational cost of the company.
Although the change in the genetic group, from Holstein to Jersey, results in a decrease in the value of the average nutritional requirement per animal and, consequently, in a reduction in the mean concentrate intake per animal, expenses with concentrated foodstuffs may not follow the same tendency, because of the greater total number of animals in the herd. This means that, despite of the change in the genetic
group from Holstein to Jersey may result in smaller non-concentrate foodstuff intake per animal, there may be an increase in expenses with the use of concentrated foodstuffs resulting from the greater number of animals in the herd.
The simulation model used was described by Cunha et. al. (2010b). Only the alterations in the model necessary to make the comparison between the herds are described further.
The farm used as a reference for the simulation is in Cajuri Municipality, in the Atlantic Rainforest Zone in the state of Minas Gerais, and it was chosen for the study because of the greater visibility of information in its technical and economic records, in addition to the well known tradition of dairy farming in the region. The farm has an area of 360 ha, of which 66.5 ha are for dairy cattle, so that 60 are used for corn cropping for silage and the remaind areas are occupied with pastures and constructions. All the animals are reared in a feedlot system and are fed corn silage and concentrates except for those in the suckling phase, which only receive concentrate and milk. The mean yield of corn for silage is 40,000 kg as fed/ ha.year. The calving interval used for the simulations was 13 months and the age at first birth, 25 months. In comparisons among cows of the Holstein and Jersey breeds, under the same management and feeding conditions, the Jersey cow milk production corresponded on average to
69.03% of the milk production of Holstein cows (Table 1). In the simulation system, a daily milk production was assumed from the cows from the Jersey breed of 69.0% of the daily milk production of the cow of the Holstein breed. Assuming that there are no differences in the shape of the lactation curve between the Holstein and Jersey breeds, milk production of the Jersey cows was simulated by the reduction of the value of the a parameter of the model by Dijkstra et al. (1997) to 69.0% of the value applied for the Holstein breed.The other parameters, which were responsible for the shape of the lactation curve, were the same as the ones adopted by Cunha et. al. (2010a,b)(Table 2). The model is described in equation 1.
In order to simulate the fat and protein percentages in the milk from the cows of the Holstein and Jersey breed (Figure 3b), the models described in the CNCPS 5.0 Fox et al. (2003) were used, which is shown in equation 2, with the respective parameters recommended by the authors, except for the b parameter in the models applied to the Jersey breed, which were fitted so that the simulated percentages of milk fat and protein were close to those obtained by Bailey et al. (2005). The values adopted for the b parameter were 3.5 and 3.3 for the models for fat and protein percentages, respectively (Figure 3b).
Herd Lactacion number Parameter1
a b c d
Holstein 1 19.00 0.0137 0.0196 0.00281
2 23.00 0.0150 0.0195 0.00380
3 or greater 26 . 0 0 0.0165 0.0248 0.00370
Jersey 1 13 . 1 1 0.0137 0.0196 0.00281
2 15.87 0.0150 0.0195 0.00380
3 or greater 17.94 0.0165 0.0248 0.00370
Table 2 - Parameters of the model of lactation curves for Holstein and Jersey
1Dijkstra et al. (1997).
PP = percentual production of the Jersey in relation to Holstein cows.
Author Number of animals Milk production (L/day) PP (%)
Herd
Holstein Jersey
Janovick et al. (2006) 4 2 35.6 25.7 72.19
White et al. (2002) 1 0 8 28.1 20.2 72.01
White et al. (2001) 3 7 36.7 23 .6 64.31
Bitman et al. (1996) 1 6 32.5 20.8 64.70
Beaulieu & Palmquist (1995) 1 6 36.1 24 .0 66.48
West et al. (1990) 3 2 25.4 18.9 74.41
Blake et al. (1986) 6 8 26.9 18.6 69.14
Minimum 25.4 18.6 64.31
Maximum 36.7 25.7 74.41
Mean 31.6 21.7 69.03
t d c e b t t c
e
a
y
− ⋅− ⋅ −⋅
⋅
=
1 (1)⎟⎟ ⎠ ⎞ ⎜⎜ ⎝ ⎛ + ⋅ − ⋅ ⎟⎟ ⎠ ⎞ ⎜⎜ ⎝ ⎛ + ⋅ ⋅ = 7 1 7
1 c d t
t e
t b a
y (2)
The model by Lopez et al. (2000) described in equation 3 was used to simulate the body weight of the growing animals for the two genetic groups. The a and b parameters were obtained from the literature. The a parameter (corresponding to body weight at birth) was considered as 43 and 28, respectively, for the Holstein and Jersey breeds, as described in the NCR (2001). The value of the b parameter (corresponding to body weight at maturity) was considered as 682 and 454, respectively, for the Holstein and Jersey breeds, as recommended in the NCR (2001). The k parameter (corresponding to the age, in days, on which the animals reached 50% of the body weight at maturity) was considered to be 505, which corresponded to approximately 16.5 months. The c parameter, which corresponds to the sigmoid shape of the curve (Figure 4a), was assumed as 1.45.
c c c c t
t
k
t
b
k
a
y
+
⋅
+
⋅
=
(3)The body weight gain of heifers in gestation was obtained by the difference between the weight at the first insemination and weight at the first calving. The body weight at the first calving was assumed to be 80% of the body weight at maturity. The body weight at the second or greater calving was assumed to be the body weight at maturity.
The body weight and the change in body weight during lactation were simulated by the model by Rotz et al. (1999), shown in equation 4, together with the values of the parameters recommended by these authors for cows in a first and second or greater lactation number (Figure 4b).
⎟ ⎠ ⎞ ⎜ ⎝ ⎛ + ⋅ − ⋅ ⎟ ⎠ ⎞ ⎜ ⎝ ⎛ + ⋅ = h t d c
t b e
t a
y 7
7 (4)
Electronic spreadsheets were used to calculate the nutritional requirements and dietary balance of the animals, elaborated according to the equations from the NCR (2001). The cost of each feed was reduced by using the Microsoft Excel Solver tool. After decreasing the cost, each feed was assessed by using the ZooCalc 1.0 program (Cunha et. al, 2010b).
The composition data of the used feeds were obtained from theses and dissertations and in the feed databank of the CNCPS 5.0 software. The feed used to formulate the feeds were corn silage, corn flour, wheat meal, soybean meal, corn gluten and urea, in addition to whole milk, supplied to calves up to two months of age. All of the feeds formulated were described in Cunha (2010b).
The production cost components were calculated as reported by Cunha et. al (2010b). These sets of installations and machines were considered the same for herds of the Holstein and Jersey breeds, as reported by Elbehri et al. (1993) and Bailey et al. (2005) and summarized by Cunha et. al. (2010b).
Some production cost components and variable and some proportionality indices of these costs were established by following Ávila (2004), relating them to the number of lactating cows or the total number of animals. However, for
Figure 3 - Lactation curves (1st, 2nd and 3rd or greater lactation numbers), (a) and percentage fat and protein curves (b) of cows of the
some of these components, a correction factor was used for the Jersey breed because of the low body weight and the smaller milk production of these animals. The volume applied per dose for most of the medications is based on the animal body weight, thus the medication expenses per animal of the Jersey breed, for example, was considered as being 67% of the medication expenses per animal of the Holstein breed, because, on average, the body weight of the animals of the Jersey breed corresponds to 60% percent of the body weight of the animals of the Holstein breed. The same logic was applied for the milker labor expenses. Considering that the number of man-days of the milker per lactating cow is proportional to the average permanence time per cow in the milking palour, and that the time of permanence per cow is related to milk production per lactating cow, the milker labor expenses per Jersey to lactating cow was considered to be 69.0% of the expense of the Holstein lactating cow.
In the comparisons among the herds, it was firstly compared the indicators of herd size and the technical and economic indices by considering the situation where there is no bonus payment for milk fat or protein in the milk. Next, the profitability of the activity was compared considering bonus payments of 1.0, 2.0, 3.0, 4.0 and 5.0% in the price paid for the milk for each unit of increase in the percentage of milk fat in the Jersey herd, above the percentage of milk fat produced by the herd of the Holstein breed. The profitability of the activity was also compared by considering bonus payment of 2.0, 4.0, 6.0, 8.0 and 10.0% in the price paid for the milk, for each unit of increase in the percentage of protein in the milk produced by the Jersey herd, above the percentage of protein in the milk produced by the Holstein breed. Finally, the profitability of the
activity was compared using the bonus payment system for quality proposed by Gimenes & Ponchio (2006) and the bonus payment system used by an important dairy company that operates in Brazil, called in this article company A. The bonus payment values proposed by Gimenes & Ponchio (2006) and by company A were corrected by the índice geral de preço (IGP-DI) of December 2007.
The simulated time used in each comparison was 10 years and the herd was considered as stabilized during the simulations.
Results and Discussion
The production system maintained a greater number of animals of the Jersey breed than of the Holstein breed (Table 3). Because the simulation model regulates the number of animals in the system by the ratio between bulk feed demand and availability, and the availability of the bulk feeds was considered the same for the two breeds, the difference in the number of animals was due to the low silage intake per animal of the Jersey breed compared to the silage intake per animal of the Holstein breed. On average (per day, on a fed basis) while the lactating cows of the Holstein breed consumed 38.66 kg corn silage, those of the Jersey breed consumed 30.26 kg.
The simulation model proposed by Elbehri et al. (1993) follows the same logic, although from a different point of view. These authors fixed the number of animals in the herd and observed that, to maintain the same number of animals of the Holstein and Jersey breeds, production systems that use the Holstein breed would have to set aside 33.3% to 37.8% more land to crop bulk feeds. The 35.9% value obtained for more calves and heifers, lactating
Figure 4 - Growth curves of calves/heifers (a) and body weight curves of cows (1st, 2nd or greater lactation numbers) of the Holstein and
cows, total of cows and total of animals in the herd was within the limits observed by Elbehri et al. (1993) that proved that, even when starting from different points of view, the two models enable similar results.
As the same rates were considered for discarded and herd structure for the two breeds and that the number of animals of the Jersey breed was greater, the number of calves/heifers sold and cows culled was greater in the system that used the Jersey breed.
Although milk production by Jersey lactating cows corresponded to approximately 69.0% of the milk production per Holstein lactating cow, by using the Jersey herd, the annual milk production in the system corresponded to 93.8% of the production obtained with the use of the Holstein herd. This increase in percentage was due to the greater number of Jersey lactating cows, compared to the number of Holstein lactating cows, resulting from the differences in the farm size of the herd.
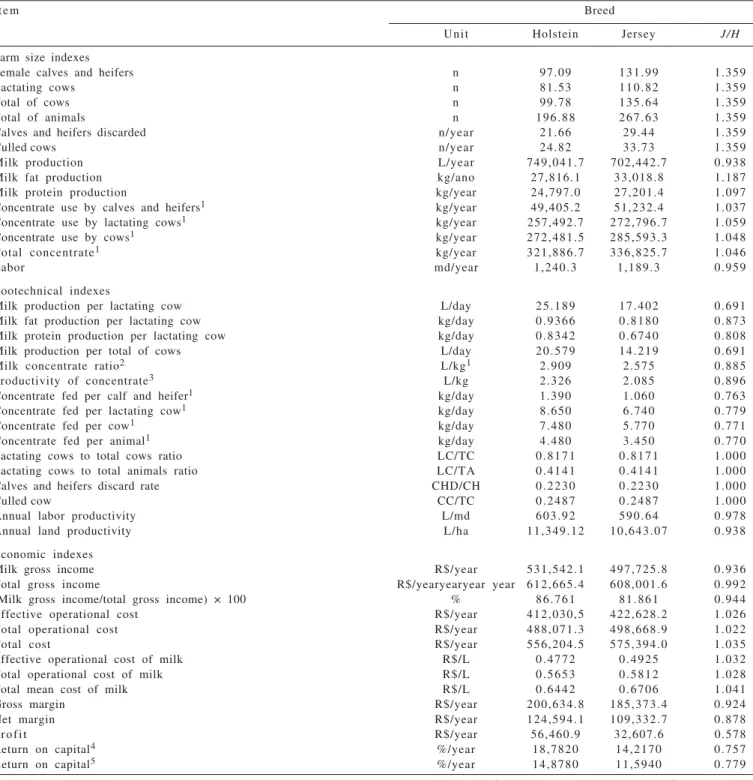
Item Breed
Unit Holstein Jersey J/H
Farm size indexes
Female calves and heifers n 97.09 131.99 1.359
Lactating cows n 81.53 110.82 1.359
Total of cows n 99.78 135.64 1.359
Total of animals n 196.88 267.63 1.359
Calves and heifers discarded n/year 21.66 29.44 1.359
Culled cows n/year 24.82 33.73 1.359
Milk production L/year 749,041.7 702,442.7 0.938
Milk fat production kg/ano 27,816.1 33,018.8 1.187
Milk protein production kg/year 24,797.0 27,201.4 1.097
Concentrate use by calves and heifers1 kg/year 49,405.2 51,232.4 1.037
Concentrate use by lactating cows1 kg/year 257,492.7 272,796.7 1.059
Concentrate use by cows1 kg/year 272,481.5 285,593.3 1.048
Total concentrate1 kg/year 321,886.7 336,825.7 1.046
Labor md/year 1,240.3 1,189.3 0.959
Zootechnical indexes
Milk production per lactating cow L/day 25.189 17.402 0.691 Milk fat production per lactating cow kg/day 0.9366 0.8180 0.873 Milk protein production per lactating cow kg/day 0.8342 0.6740 0.808 Milk production per total of cows L/day 20.579 14.219 0.691
Milk concentrate ratio2 L/kg1 2.909 2.575 0.885
Productivity of concentrate3 L/kg 2.326 2.085 0.896
Concentrate fed per calf and heifer1 kg/day 1.390 1.060 0.763
Concentrate fed per lactating cow1 kg/day 8.650 6.740 0.779
Concentrate fed per cow1 kg/day 7.480 5.770 0.771
Concentrate fed per animal1 kg/day 4.480 3.450 0.770
Lactating cows to total cows ratio LC/TC 0.8171 0.8171 1.000 Lactating cows to total animals ratio LC/TA 0.4141 0.4141 1.000
Calves and heifers discard rate CHD/CH 0.2230 0.2230 1.000
Culled cow CC/TC 0.2487 0.2487 1.000
Annual labor productivity L/md 603.92 590.64 0.978
Annual land productivity L/ha 11,349.12 10,643.07 0.938
Economic indexes
Milk gross income R$/year 531,542.1 497,725.8 0.936
Total gross income R$/yearyearyear year 612,665.4 608,001.6 0.992 (Milk gross income/total gross income) × 100 % 86.761 81.861 0.944 Effective operational cost R$/year 412,030,5 422,628.2 1.026
Total operational cost R$/year 488,071.3 498,668.9 1.022
Total cost R$/year 556,204.5 575,394.0 1.035
Effective operational cost of milk R$/L 0.4772 0.4925 1.032
Total operational cost of milk R$/L 0.5653 0.5812 1.028
Total mean cost of milk R$/L 0.6442 0.6706 1.041
Gross margin R$/year 200,634.8 185,373.4 0.924
Net margin R$/year 124,594.1 109,332.7 0.878
Profit R$/year 56,460.9 32,607.6 0.578
Return on capital4 %/year 18,7820 14,2170 0.757
Return on capital5 %/year 14,8780 11,5940 0.779
md = man days; un = unitt; J/H = ratio between the values obtained for the Jersey and Holstein herds; 1as fed ; 2Concentrates used for lactating cows; 3Concentrates used for all the herd; 4Without payment of the land factor; 5With payment of the land factor.
Despite of the fact that the annual milk production was smaller with the use of animals of the Jersey breed, the annual production of milk fat and protein were, respectively, 18.7 and 9.7% greater, mainly because of the greater number of cows of the Jersey breed in lactation since the productions of milk fat and protein per Jersey lactating cow corresponded to 87.3% and 80.8% of the milk fat and milk protein production per Holstein lactating cow.
The milk fat and protein contents produced by the Jersey breed were, respectively, 4.70% and 3.87%, the same as those reported by Bailey et al (2005). The fat and protein contents in the milk produced by the Holstein breed were 3.72% and 3.31%, respectively. These results were close to the average values of 3.69% fat and 3.24% protein reported by Ribas et al. (2004) when they analyzed 257,540 milk samples taken from expansion tanks on farms that use animals fom the Holstein breed, in the states of Paraná, São Paulo and Santa Catarina.
Although the concentrate fed per animal in all the categories was smaller for the Jersey breed, the annual use of concentrate was smaller for the Holstein herd because of the difference in the number of animals. As the daily amount of concentrate fed per Jersey lactating cow corresponds to 77.9% of the amount supplied per Holstein lactating cow and the milk production per Jersey lactating cow corresponded to about 69.0% of the milk production per Holstein lactating cow, the milk/concentrate ratio and the concentrate productivity were greater for the Holstein herd. This was because of the greater nutritional requirement of the Jersey cow per liter of milk produced, a consequence of the greater percentage of milk solids.
In the labor use assessment, the application of the proportionality indexes regarding the number of lactating cows and the correction factor for the Jersey breed resulted in close values for the two herds, in spite of the greater number of animals of the Jersey breed. Elbehri et al. (1993) considered the use of labor as proportional to the number of cows in the herd, regardless to the breed used. It is possible that this procedure is not suitable, because milk production in the Jersey cow is smaller than that of milk per Holstein cow and because of this, each Jersey cow, on average, remains less time in the milking palour, requiring less labor time from the milker per lactating cow. Furthermore, as the feed intake is smaller for the animals of the Jersey breed, the time and effort used to feed each animal must be lesser. The labor productivity and land productivity were smaller for the Jersey herd, because of the small annual milk production when animals of this breed are used.
Like in the first simulation, no type of bonus payment was considered for the percentages of milk fat and protein.
The milk gross income was greater when animals of the Holstein breed were used. However, the total gross income was practically the same for the two breeds and this is explained for the greater number of animals sold in the Jersey herd, because as the discarding rates were the same between the breeds, a greater number of animals in the Jersey breed resulted in a greater number of animals sold. The participation of the milk gross income in the total gross income of the activity was smaller for the Jersey herd. As the value of the animals of each breed is influenced by a series of factors, including offer and demand, genetics and the negotiating ability of the farmer, the sale price of the animals was considered equal between the breeds.
The effective operational cost was greater in the Jersey herd, mainly because of the greater use of concentrate feed. The difference in the effective operational cost between the two breeds was R$ 10.598,00, which corresponded to 2.6% more costs for the Jersey breed. The difference remained at the same value (R$ 10.598,00,) when the comparison was made for the total operational cost. This can be explained by the fact that some of the labor and depreciation of equipment and machinery were considered the same for the two breeds. The difference between the total cost of the activity using the Holstein breed and the Jersey breed increased to R$ 19.189,50. The greatest difference in the total cost compared to the effective operational cost and the total operational cost occurred because of the greater value of the return on immobilized capital in animals of the Jersey breed, a direct consequence of the greater number of animals of this breed compared to those of the Holstein breed.
The gross margin and the net margin of the activity using the Jersey breed corresponded, respectively, to 92.4% and 87.8% of those obtained for the Holstein breed. The profit of the system using the herd of the Jersey breed was smaller (57.8%) than that obtained with the Holstein breed, which indicated that, when there is no bonus payment for milk fat or protein concentration, the use of herds of the Holstein breed is more profitable than those of the Jersey breed herds.
bonus payments of this order are necessary, so that, in this case, the producer is encouraged to invest in changing the genetic group from Holstein to Jersey.
Gimenes & Ponchio (2006) proposed a bonus payment system that pays the producer, simultaneously, for increases in the milk fat and protein content (Table 4). This system was based on the industrial gains and economic returns resulting from higher milk fat and protein concentrations compared to those of the milk considered standard for the industry.
By applying the system by Gimenes & Ponchio (2006) a greater annual profitability for the Jersey breed herd (R$ 91,302.08) was achieved, compared to the Holstein breed (R$ 70,787.39) (Figure 6a). As this system was based on the economic returns for dairy products coming from the industrial yield in the manufacture of dairy products, it is possible that its application brings benefits for both industry and producer.
The bonus payment system for fat and protein used by dairy factory A (Table 5), compared to that proposed by
Gimenes & Ponchio (2006), had a greater number of bonus payment ranges and began the bonus payment by starting at low levels for both fat and protein.
By applying the bonus payment system used by the dairy factory, unlike the application of the system proposed by Gimenes & Ponchio (2006), it resulted in greater annual profit for the Holstein breed (R$ 92,156.78) compared to the Jersey breed (R$ 85,502.97) (Figure 6b). This occurred because the bonus payment system of the company pays for increases on the percentage of milk.
Figure 5 - Annual profit from the activity using the Jersey breed, considering different bonus payments on the price paid for the milk, for each unit increase in the percentage of fat (a) and protein (b) above the percentage obtained with the Holstein breed. H = annual profit from the activity using the Holstein breed.
F a t Increment Protein Increment
(%) R$/L1 (%) R$/L2
3.41 - 3.60 0.00000 3.11 – 3.20 0.00000 3.61 - 3.80 0.00707 3.21 – 3.30 0.00642 3.81 - 4.00 0.01414 3.31 – 3.40 0.01295 4.01 - 4.20 0.02122 3.41 – 3.50 0.01937 4.21 - 4.40 0.02829 3.51 – 3.60 0.02970 4.41 - 4.60 0.03536 3.61 – 3.70 0.03231 > 4.60 0.04232 3.71 – 3.80 0.03873 > 3.80 0.04526 1Values corrected by the IGP-DI of December 2007.
2A adapted from Gimenes & Ponchio (2006)
Table 4 - Bonus payment system for fat and protein proposed by Gimenes & Ponchio (2006)
1Values corrected by the IGP-DI of December 2007.
F a t Increment Protein Increment
(%) R$/litro1 (%) R$/litro1 ≤3.20 0.00000 ≤3.00 0.00000
3.30 0.00511 3.03 0.00234
3.40 0.01010 3.06 0.00479
3.50 0.01521 3.09 0.00713
3.60 0.01829 3.12 0.00957
3.70 0.02127 3.15 0.01202
3.80 0.02436 3.18 0.01436
3.90 0.02733 3.20 0.01595
4.00 0.03042 3.22 0.01755
4.10 0.03244 3.24 0.01914
4.20 0.03446 3.26 0.02074
4.30 0.03648 3.28 0.02234
4.40 0.03850 3.30 0.02393
4.50 0.04052 3.32 0.02553
≥4.60 0.04254 3.34 0.02712
3.36 0.02872 3.37 0.02957 3.38 0.03031 3.39 0.03116 ≥3.40 0.03191 Table 5 - Bonus payment system for fat and protein used by
Conclusions
Considering the conditions used for the simulation, when there is no bonus payment for milk fat and protein percentage - although using the Jersey breed, the gross income of the activity is close to that obtained with the Holstein breed (99.2%). The profit obtained with the Holstein breed is greater, because of the lower production costs, mainly regarded to the use of concentrated feeds. In the conditions used for the simulation, in order to obtain more profitable activities with the use of the Jersey breed, 5.0% and 10% bonus payment is necessary on the price of milk for each percentage unit of milk fat or protein, respectively, above that obtained with the Holstein breed. Under the conditions assessed in this study, with the use of the bonus payment system proposed by Gimenes & Ponchio (2006), the annual profit with the Jersey breed is greater than that obtained with the Holstein breed. However, with the application of the bonus payment system used by the dairy factory A, the Holstein breed becomes more profitable than the Jersey breed.
References
ÁVILA, W.R.B. Uso da dinâmica de sistemas como suporte à decisão em propriedades produtoras de leite: um estudo de caso. 2004. 127f. Dissertação (Mestrado em Economia Aplicada) -Universidade Federal de Viçosa, Viçosa, MG.
BAILEY, K.W.; JONES, C.M.; HEINRICHS, A.J. Economic return to Holstein and Jersey herds under multiple component pricing. Journal of Dairy Science, v.88, p.2269-2280, 2005. BEAULIEU, A.D.; PALMQUIST, D.L. Differential effects of high
fat diets on fatty acid composition in milk of Jersey and Holstein cows. Journal of Dairy Science, v.78, p.1336-1344, 1995.
Figure 6 - Annual profit of the activity with the use of the Holstein and Jersey breeds, considering the application of the bonus payment system for fat and protein proposed by Gimenes & Ponchio (2006) (a) and used by a dairy factory (b).
BITMAN, J.; WOOD, D.L.; MILLER, R.H. et al. Comparison of milk and blood lipids in Jersey and Holstein cows fed total mixed rations with or without whole cottonseed. Journal of Dairy Science, v.79, p.1596-1602, 1996.
CARDOSO, V.L.; NOGUEIRA, J.R.; VERCESI FILHO, A.E. et al. Objetivos de seleção e valores econômicos de características de importância econômica para um sistema de produção de leite a pasto na Região Sudeste. Revista Brasileira de Zootecnia, v.33, n.2, p.320-327, 2004.
CUNHA, D.N.F.V.; PEREIRA, J.C.; SILVA, F.F. et al. Selection of models of lactation curves to use in models of milk production simulation systems. Revista Brasileira de Zootecnia, v.39, n.4, p.891-902, 2010a.
CUNHA, D.N.F.V.; PEREIRA, J.C.; CAMPOS, O.F. et al. Evaluation of a dynamic simulation model for milk production systems. Revista Brasileira de Zootecnia, v.39, n.4, p.903-912, 2010b. DIJKSTRA, J.; FRANCE, J.; DHANOA. M.S. et al. A model describe growth patterns of the mammary gland during pregnancy and lactation. Journal of Dairy Science, v.80, p.2340-2354, 1997. ELBEHRI, A.; YONKERS, R.D.; FORD, S.A. et al. The relative profitability of Jersey versus Holstein farms under alternative milk pricing systems. Journal of Dairy Science, v.77, p.1296-1305, 1994.
FOX, D.G.; TILUTKI, T.P.; TEDESCHI, L.O. The net carbohydrate and protein system for evaluating herd nutrition and nutrient excretion – CNCPS 5.0. The Cornell University. 2003. 202p.
GIMENES, R.M.; PONCHIO, L.A. Elaboração de sistema de pagamento de leite pela qualidade para fornecedores da empresa A. In: CONGRESSO BRASILEIRO DE QUALIDADE DE LEITE, 2., 2006, Goiânia. Disponível em: <http:// www.terraviva.com.br/IICBQL/p026.pdf>. Acesso em: 20/7/2007. JANOVICK, N.A.G.; CARLSON, D.B.; GARRETT, J.E. et al. Lipid Metabolite Profiles and Milk Production for Holstein and Jersey cows fed rumen-protected choline during the periparturient period. Journal of Dairy Science, v.89, p.188-200, 2006.
KRUG, E.E.B. Sistemas de produção de leite: identificação de Benchmarking. 2001. 256f. Dissertação (Mestrado em Produção Animal) - Universidade Federal do rio Grande do Sul, Porto Alegre.
MADALENA, F.E. Valores econômicas para seleção de proteína e gordura do leite. Revista Brasileira de Zootecnia, v.29, n.3, p.678-684, 2000.
NATIONAL RESEARCH COUNCIL - NRC. Nutrient requirements of dairy cattle. Washington, D.C.: National Academy of Sciences, 2001. 363p.
RIBAS, N.P.; HARTMANN, W.; MONATES, H.D. et al. Sólidos totais no leite em amostras de tanque nos estados do Paraná, Santa Catarina e são Paulo. Revista Brasileira de Zootecnia, v.33, n.6, p.2343-2350, 2003.
ROTZ, C.A.; MERTENS, D.R.; BUCKMASTER, D.R. et al. A dairy herd model for use in whole farm simulations. Journal of Dairy Science, v.82, p.2826-2840, 1999.
WEST, J.W.; JOHNSON JR., J.C. Effects of bovine somatotropin on milk yield and composition, body weight, and condition score of Holstein and Jersey cows. Journal of Dairy Science, v.73, p.1062-1068, 1990.
WHITE, S.L.; BERTRAND, J.A.; WADE, M.R. et al. Comparison of fatty acid content of milk from Jersey and Holstein cows consuming pasture or a total mixed ration. Journal of Dairy Science, v.84, p.2295-2301, 2001.