Recebido para publicação em 13/3/2009 Aceito para publicação em 8/7/2009 (004086)
1 Departamento de Engenharia Química, Universidade Federal de Pernambuco – UFPE, Rua Prof. Artur de Sá, s/n, Cidade Universitária, CEP 50740-521, Recife - PE, Brasil, E-mail: pazoubel@gmail.com
2 Universidade Estadual da Bahia – UNEB, Av. Edgard Chastinet, s/n, São Geraldo, CEP 48905-680, Juazeiro - BA, Brasil
3 Faculdade de Engenharia de Alimentos, Universidade Estadual de Campinas – UNICAMP, CP 6121, CEP 13083-862, Campinas - SP, Brasil *A quem a correspondência deve ser enviada
Restructuring
Passiflora cincinnata
fruit pulp: influence of hydrocolloids
Estruturação de polpa de Passiflora cincinnata: influência de hidrocoloides
Patrícia Moreira AZOUBEL1*, Ana Júlia de Brito ARAÚJO2, Silvana Belém de OLIVEIRA3, Mariana da Rocha AMORIM2
1 Introduction
The botanic genus Passiflora consists of approximately 400 species, among which over 150 are native to Brazil (BRUCKNER; PICANÇO, 2001). Although most studies on the exploitation of this genus have dealt with the P. edulis species, there are other species with great agronomic potential, such as P. cincinnata, which is distributed spontaneously in the semi-arid region of northeast Brazil (CERVI, 1997; NUNES; QUEIROZ, 2001).
The fruit production still comes from extractivism and from areas cultivated in a domestic scale, but it has been increasingly growing with the production of homemade jelly and jams by a local agroindustry (Araújo et al., 2006).
Gelled sweet products are mainly represented by traditional jams and jellies gel specially with high methoxy pectins. However, other products such as fruit bars, desserts, snacks, and restructured fruit are also formulated with fruit, sugar, and combinations of one or more polysaccharides to get the desired texture, along with other functional and sensory characteristics (GLICKSMAN, 1982; TENN, 1985; OLIVIER; GUIGOU; BOUILLETTE, 1988; GRIZOTTO et al., 2005).
The production of restructured fruit with high contents of fruit pulp using hydrocolloids as binding agents could open up a new market alternative for the semi-arid native fruit and
would enlarge the already existing market resulting in higher added value, and in products that can be used in many food formulations, such as in dairy and baking industry.
The objective of this work was to evaluate the effects of mixtures of alginate, pectin, and gelatin on the characteristics of fruit gels containing pulp with an elevated soluble solids level (50 °Brix).
2 Materials and methods
2.1 Plant material
The native fruit (P. cincinnata Mast.) was obtained from the Embrapa Semi-Arid Experimental Field at Petrolina, Pernambuco State (Brazil). The fruits were washed, cleaned, and the pulp was extracted with the seeds being separated using a home grinder, packed in 1 kg plastic bags and immediately frozen at –18 °C.
2.2 Restructuring process
The technological co-adjutants to prepare the restructured
P. cincinnata fruit were commercial sugar (Usina União,
Resumo
Este trabalho avaliou o efeito de misturas de alginato, pectina de baixa metoxilação e gelatina nas características de géis de P. cincinnata, contendo polpa com alto teor de sólidos solúveis (50 °Brix). Os resultados do planejamento experimental central composto mostraram que os modelos obtidos, exceto para a atividade de água e pH, foram preditivos. A gelatina foi o mais importante fator de influência na firmeza e nos parâmetros de cor, sendo que altas concentrações desse hidrocoloide, combinadas com concentrações de alginato e pectina superiores a 1,3% e 1,26%, respectivamente, podem ser utilizadas para obter um produto amarelo claro com firmeza superior a 1,2 kg.
Palavras-chave: alginato; frutas; gelatina; pectina. Abstract
This study evaluated the effect of mixtures of alginate, low methoxy pectin and gelatin on characteristics of P. cincinnata fruit gels, containing pulp with high soluble solids content (50 °Brix). The results of a central composite design showed that the models obtained, except for water activity and pH, were predictive. Gelatin was an important factor affecting firmness and colour parameters since higher concentrations of this hydrocolloid, combined with alginate concentrations greater than 1.3% and pectin quantity up to 1.26%, could be used to obtain clear yellow products with firmness greater that 1.2 kg.
Keywords: alginate; fruits; gelatin; pectin.
refractometer (Cambridge Instruments Inc., Reichert-Jung Abbe Mark II, Buffalo, USA) and a potentiometer (Tecnal, Tec-3MP, Piracicaba, Brazil) were used, respectively. Firmness was measured using a fruit penetrometer (Effegi, FT 327, Milan, Italy) and water activity using a portable hygrometer (Decagon, PawKit, Pullman, USA). Color parameter (L*, a* and b*) measurements were carried out using a portable colorimeter (ColorTec, PCM, Clinton, USA).
2.4 Experimental design and statistical analysis
The restructuring process for P. cincinnata was optimized using the Response Surface Methodology (RSM), as described by Rodrigues and Iemma (2005). The proportions of alginate, pectin and gelatin, along with their codified and real values and following a central composite design, composed of a 23 factorial design with a central point (0) and axial points (±1.68, which correspond to the star design), are shown in Table 1. The central point was repeated three times to provide an estimate of the experimental error, and a total of 17 trials were performed. The following polynomial model was fitted to the data (Equation 1):
2 2
0 1 1 2 2 3 3 11 1 22 2 2
33 3 12 1 2 13 1 3 23 2 3
y x x x x x
x x x x x x x
β β β β β β
β β β β
= + + + + + +
+ + + +
(1)
where ßn are constant regression coefficients; y is the response or dependent variable (water activity, pH, firmness, L*, a* and b*); and x1, x2, and x3 are the independent variables (alginate, pectin and gelatin concentrations).
The statistically significant model parameters were determined, as well as the significance of the model regression investigation by the analysis of variance (ANOVA) and the Primavera, Brazil), sodium alginate (Vetec Química Fina, Rio de
Janeiro, Brazil), low methoxy pectin (CP Kelco, Limeira, Brazil), and 180 Bloom gelatin (Rebière Gelatinas, Amparo, Brazil) such as food grade hydrocolloids, glycerol (C3H5(OH)3) (Vetec Química Fina, Rio de Janeiro, Brazil), as the solute to suppress the water activity, and anhydrous calcium hydrogen phosphate (CaHPO4) (Vetec Química Fina, Rio de Janeiro, Brazil, analytical grade), as the source of calcium.
The proportions of hydrocolloids used were in accordance to an experimental design, as presented in Table 1.
Initially, glycerol was added to the fruit pulp at a rate of 10 g.100g–1 (or 10% of the pulp weight) and, based on the soluble solids content, the amount of sugar required to reach 50 °Brix was calculated. This mixture, previously heated to 60 °C, was transferred to a plastic beaker and the dry mixture of hydrocolloids (alginate+pectin+gelatin) plus sugar were added by mixing using a laboratory mixer (Nova Técnica, NT 137, Piracicaba, Brazil). After mixing for 10 minutes, 2 g of CaHPO4 suspended in 5 mL of distilled water was added and mixed for 5 more minutes. With the aid of 5 cm-diameter Petri dishes (depth 1 cm), the restructured fruits were molded into the shape of a solid cylinder and maintained under refrigeration at 10 °C for 24 hours to complete the gelling process.
2.3 Physicochemical analysis
The samples of the fruit pulp were submitted to the following physicochemical analysis, according to AOAC (2000): moisture (wet basis), pH, total soluble solids (°Brix), total titrable acidity (expressed as citric acid, g.100 g–1), and water activity. For the restructured fruit samples, it was determined: water activity, pH, firmness, and color. For total soluble solids and pH determinations, a bench digital
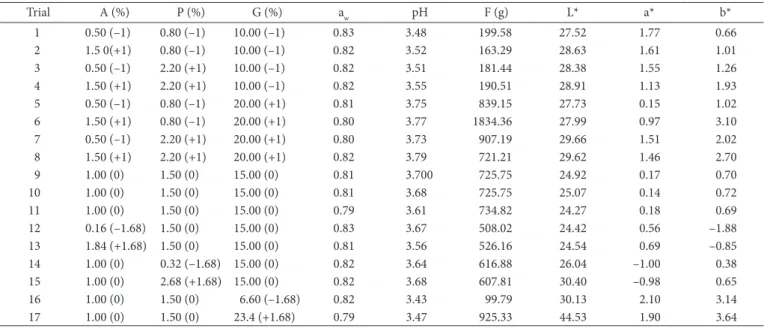
Table 1. Results for the central composite design trials for soluble water activity (aw), pH, firmness (F), and colour parameters (L*, a*, b*) of the restructured fruit with different concentrations of alginate (A), pectin (P), and gelatin (G)
Trial A (%) P (%) G (%) aw pH F (g) L* a* b*
1 0.50 (–1) 0.80 (–1) 10.00 (–1) 0.83 3.48 199.58 27.52 1.77 0.66
2 1.5 0(+1) 0.80 (–1) 10.00 (–1) 0.82 3.52 163.29 28.63 1.61 1.01
3 0.50 (–1) 2.20 (+1) 10.00 (–1) 0.82 3.51 181.44 28.38 1.55 1.26
4 1.50 (+1) 2.20 (+1) 10.00 (–1) 0.82 3.55 190.51 28.91 1.13 1.93
5 0.50 (–1) 0.80 (–1) 20.00 (+1) 0.81 3.75 839.15 27.73 0.15 1.02
6 1.50 (+1) 0.80 (–1) 20.00 (+1) 0.80 3.77 1834.36 27.99 0.97 3.10
7 0.50 (–1) 2.20 (+1) 20.00 (+1) 0.80 3.73 907.19 29.66 1.51 2.02
8 1.50 (+1) 2.20 (+1) 20.00 (+1) 0.82 3.79 721.21 29.62 1.46 2.70
9 1.00 (0) 1.50 (0) 15.00 (0) 0.81 3.700 725.75 24.92 0.17 0.70
10 1.00 (0) 1.50 (0) 15.00 (0) 0.81 3.68 725.75 25.07 0.14 0.72
11 1.00 (0) 1.50 (0) 15.00 (0) 0.79 3.61 734.82 24.27 0.18 0.69
12 0.16 (–1.68) 1.50 (0) 15.00 (0) 0.83 3.67 508.02 24.42 0.56 –1.88
13 1.84 (+1.68) 1.50 (0) 15.00 (0) 0.81 3.56 526.16 24.54 0.69 –0.85
14 1.00 (0) 0.32 (–1.68) 15.00 (0) 0.82 3.64 616.88 26.04 –1.00 0.38
15 1.00 (0) 2.68 (+1.68) 15.00 (0) 0.82 3.68 607.81 30.40 –0.98 0.65
16 1.00 (0) 1.50 (0) 6.60 (–1.68) 0.82 3.43 99.79 30.13 2.10 3.14
17 1.00 (0) 1.50 (0) 23.4 (+1.68) 0.79 3.47 925.33 44.53 1.90 3.64
presented pH value around 3.77 and were obtained using high quantities of alginate and gelatin. Thus, the 3.7 pH value can be taken as a minimum value for structuring acid pulps when the mixtures of these hydrocolloids are used.
3.3 Firmness
The statistical analysis at a 95% confidence level revealed that all terms (linear, quadratic, and cross terms) were significant for this response. The significance of the interactions indicates the existence of a synergic effect between hydrocolloids, as pointed out by Grizotto et al. (2007) and Mancini and McHugh (2000). The fitted model is described by Equation 2.
( ) 2 2
2
1961.73 533.69 216.73 985.65 41.67 154.21 2.23 405.65 41.82 37.65
F g A A P P
G G AP AG PG
= − + − + −
+ − − + −
(2)
(where F is firmness, g; A is alginate concentration, % or g.100 g–1; P is pectin concentration, % or g.100 g–1; and G is gelatin concentration, % or g.100 g–1) had a significant regression and explained 84.63% of the variability in firmness.
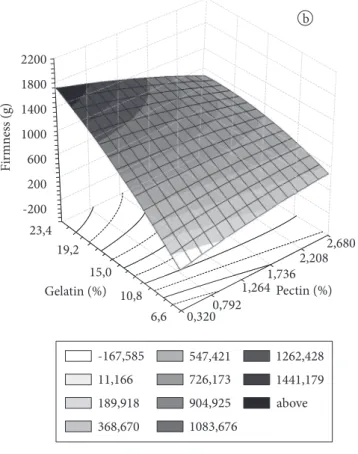
The generated surfaces are shown in Figure 1. It can be seen that the firmness of the restructured fruit pulp was most influenced by gelatin, and as its concentration is increased, the firmness values increase. According to Grizotto et al. (2007), gels presented a good firmness when a value around 1.5 kg was obtained for restructured concentrated pineapple pulp, whereas a firmness around 1.3 kg was considered satisfactory for concentrated papaya pulp (GRIZOTTO et al., 2005). For the
P. cincinnata pulp, higher values of gelatin (>19%) combined with values of alginate greater than 1.3% (Figure 1a) and pectin values up to 1.26% (Figure 1b) could be used in order to achieve higher firmness (>1.2 kg).
3.4 Colour parameters
The Hunter colour parameters L*, a* and b* have been widely used to describe color changes during the processing of fruit and vegetable products. The colour variables have been related to the types and quantities of some components present in foods (AMENY; WILSON, 1997; SASS-KISS et al., 2005). The major coloured compounds of P. cincinnata are carotenoids and the fruit pulp were initially yellowish-green (a* = –2.79; b* = 16.96).
L* values represents the lightness index of a product. Like pectin, for the P. cincinnata restructured fruit, gelatin showed a significant effect both in linear and quadratic terms. Alginate and the variables’ interactions with each other did not show significant effect. The fitted model is described by Equation 3, which had a significant regression and explained 79.42% of the variability in L*.
2 2
* 59.01 4.70 1.99 4.67 0.17
L = − P+ P − G+ G (3)
The generated surfaces for this response are presented in Figure 2. The quadratic effect was more pronounced for the gelatin concentration, and some values of this parameter can be observed, where minimum L* values can be observed. For example, lower L* values, which indicates darker samples, generation of three-dimensional graphs using the Statistic 5.0
software (STATSOFT, 1995).
3 Results and discussion
P. cincinnata pulp presented the following physicochemical characteristics: moisture = 84.47%; total titrable acidity = 3.34 g.100 g–1; total soluble solids = 11.5 °Brix; pH = 3.1; and water activity = 0.86. The acidity was low in comparison to the value obtained by Araújo et al. (2002) for this same fruit specie and to the value obtained by Laboissière et al. (2007) for yellow passion fruit pulp, whereas the pH was similar to the values found by these authors. The soluble solids content was similar to that reported by Araújo et al. (2002), but lower than the value reported by Laboissière et al. (2007).
After the addition of glycerol to the pulp (10 g.100 g–1 of fruit pulp), the total soluble solids content of the mixture was 17.5 °Brix requiring the addition of 71.5 g of sucrose per 100 g of pulp in order to reach 50 °Brix. The quantity of sugar used in this study was similar to the quantity needed to restructure papaya (GRIZOTTO et al., 2005) and mango pulps (MOUQUET; DUMAS; GUILBERT, 1992).
Table 1 presents the results for water activity (aw), pH, firmness (F), and colour parameters (L*, a*, b*) of the restructured P. cincinnata obtained from the central composite design trials. The modeling and the statistical analysis of each of these response values are discussed bellow.
3.1 Water activity
The obtained model did not show a significant regression (95% confidence level), indicating that it was not capable of describing the variations in the water activity (aw). Both the standard error calculation and ANOVA showed that there were no significant terms implying that the hydrocolloids concentrations have no influence on the aw of the structured fruit. The mean and the standard deviation (SD) for trials 1-8 and 12-17 were 0.82 ± 0.01, whereas for the three-fold replicate center point was 0.80 ± 0.01. The SD for the replicate points is the same as that for trials 1-8 and 12-17, for which the factors level varied extensively, hence the SD for the factorial and star design can simply be explained by the experimental error.
The observed aw values were within the intermediate moisture range of 0.65 to 0.90, as reported by Chirife and Buera (1994).
3.2 pH
In contrast to the aw data, the pH model showed a significant regression, but the multiple correlation coefficient of 0.64 was not satisfactory. The statistical analysis showed that only the linear and quadratic terms of gelatin were significant (p ≤ 0.05). The average and SDs, 3.61 ± 0.12 for trials 1-8 and 12-17, and 3.66 ± 0.04 for the three-fold replicate center point showed much larger variations in pH when the factor levels were varied than for the replicate trials.
Figure 1. Response surfaces for fi rmness at: a) P = 1.5%; b) A = 1.0%.
46
42
38
34
30
26
23,4 19,2
15,0
10,8
6,6 0,3200,792
1,2641,736 2,208
2,680
Gelatin (%)
L*
Pectin (%)
25,620
27,411
29,202
30,993
32,784
34,575
36,366 above
38,157
39,948
41,739 46
42
38
34
30
26
23,4 19,2
15,0 10,8
6,6
1,42
1,00
Alginate (%) 0,58
0,16 1,84
Gelatin (%)
L*
25,414
26,801
28,187
29,573
30,960
32,346
33,733
35,119
36,505
37,892
above
a b
Figure 3. Response surfaces for a* at: a) P = 1.5%; b) A = 1.0%.
Figure 4. Response surfaces for b* at: a) P = 1.5%; b) A = 1.0%.
23,4 19,2
15,0
10,8
6,6 0,3200,792
1,264 1,736
2,208 2,680
Gelatin (%)
b*
Pectin (%)
0,925
1,314
1,704
2,094
2,484
2,874
3,263 above
3,653
4,043
4,433 6
5 4 3 2 1 0 -1 -2
6 5 4 3 2 1 0 -1 -2 23,4
19,2
15,0
10,8
6,6 0,16
0,58 1,00
1,42 1,84
Gelatin (%)
b*
Alginate (%)
-0,987
-0,414
0,158
0,731
1,304
1,876
2,449
3,022
3,595
4,167
above
4 Conclusions
The empirical models obtained for aw and pH were not considered predictive, but it was observed that the samples aw values ranged within the intermediate moisture range, and that a pH around 3.7 can be taken as a minimum value for structuring the fruit pulp, when mixtures of alginate, low methoxy pectin, and gelatin are used. For firmness and colour parameters, the models were predictive. Restructured fruits with greater firmness and clear yellow color could be obtained by employing higher values of gelatin, combined to alginate concentrations higher than 1.3% and pectin quantities up to 1.26%.
Acknowledgements
The authors gratefully acknowledge the financial support provided by EMBRAPA, as well as the foundations FACEPE (Fundação de Amparo à Ciência e Tecnologia do Estado de Pernambuco) and CNPq (Conselho Nacional de Desenvolvimento Científico e Tecnológico) for granting undergraduate scholarships. The authors also thank CP Kelco Brazil and Rebière Gelatinas Brazil for supplying the low methoxy pectin and the 180 Bloom gelatin, respectively.
References
ASSOCIATION OF OFFICIAL ANALYTICAL CHEMISTS - AOAC.
Official methods of analysis of the Association of Official Analytical Chemists International. 17th ed. Arlington: AOAC, 2000.
AMENY, M. A.; WILSON, P. W. Relationship between hunter color values and beta carotene contents in white-fleshed African sweet potatoes (Ipomoea batatas Lam.). Journal of the Science of Food and Agriculture, v. 73, p. 301-306, 1997.
ARAÚJO, F. P. et al. Caracterização de frutos de maracujá do mato (Passiflora cincinnata Mast.) cultivado em condições de sequeiro. In: CONGRESSO NACIONAL DE BOTÂNICA, 53., 2002, Recife.
Resumos... São Paulo: Sociedade Botânica do Brasil, 2002. p. 10. ARAÚJO, F. P. et al. Estratégias para coleta de germoplasma de maracujá
do mato (Passiflora cincinnata Mast.). Magistra, v. 18, p. 35-37, 2006. BRUCKNER, C. H.; PICANÇO, M. C. Maracujá: tecnologia de
produção, pós-colheita, agroindústria e mercado. Porto Alegre: Cinco Continentes, 2001.
CERVI, A. C. Passifloraceae do Brasil. Estudo do gêneroPassiflora L.,
subgênero Passiflora. Madrid: Fontqueira, 1997.
CHIRIFE, J.; BUERA, M. D. P. Water activity, glass transition and microbial stability in concentrated/semi moisture food systems.
Journal of Food Science, v. 59, p. 925-927, 1994.
GILL, B. S. et al. Effects of ºBrix, sodium alginate and drying temperature on colour, texture and sensory properties of ‘ushehari’ mango leather. International Journal of Food Science and Technology, v. 41, p. 373-378, 2004.
GLICKSMAN, M. The hydrocolloids industry in the 80’s - problems and opportunities. Progress in Food and Nutrition Science, v. 6, p. 299-321, 1982.
GRIZOTTO, R. K. et al. Otimização via metodologia da superfície de resposta dos parâmetros tecnológicos para produção de fruta estruturada e desidratada a partir de polpa concentrada de mamão.
Ciência e Tecnologia de Alimentos, v. 25, p. 158-164, 2005. can be obtained when gelatin concentration ranged from
10.8 up to 17%, combined to pectin concentrations up to 1.9% (Figure 2b), independent of the quantity of alginate used (Figure 2a). On the other hand, L* values similar to those of the fresh pulp (L* = 35.38) could be obtained using higher gelatin concentration (≥20%), independent of the quantity of pectin and alginate.
The a* values represent greenness and redness of a product. The statistical analysis for such response indicated that all the terms were significant at a 95% confidence level. The fitted model was described by Equation 4, which had a significant regression and explained more than 87% of the variability in a*.
2 2 2
* 10.21 2.90 1.28 0.71 0.52 1.21 0.03 0.40 0.07 0.09
a A A P P G G
AP AG PG
= − + + − − +
− + +
(4)
The generated surfaces for this response are shown in Figure 3. It can be observed that when intermediate concentrations of both gelatin and alginate were used (Figure 3a), the lowest values of a* were obtained and the product were closer to the fresh pulp colour. On the other hand, higher gelatin concentration (≥20%)
combined with pectin concentrations higher than 0.5% or lower gelatin concentrations (up to 10%), independent of the pectin concentration used, gave higher a* values (Figure 3b).
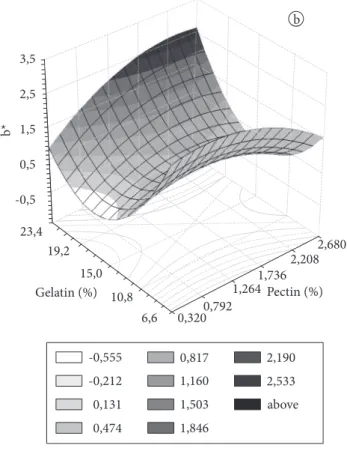
The b* values represent yellowness and blueness of a product. As for the a* response, the statistical analysis indicated that all the terms were significant at a 95% confidence level. The fitted model was described by Equation 5, which had a significant regression and explained more than 89% of the variability in b*.
2 2
2
* 7.04 4.42 2.17 0.40 0.25 1.34 0.05 0.39 0.09 0.03
b A A P P G
G AP AG PG
= + − + + −
+ − + + (5)
The generated surfaces as a function of the hydrocolloids are shown in Figure 3. Alginate concentration greater than 0.3%, combined with lower (≤ 8%) or greater (≥ 20%) gelatin concentrations gave higher b* values (Figure 4a), therefore the restructured fruit color could be closer to color of the fresh pulp. On the other hand, gelatin concentrations ranging from 11 to 16% and pectin concentrations up to 1.9% resulted in lower b* values (Figure 4b).
GRIZOTTO, R. K. et al. Technological aspects for restructuring concentrated pineapple pulp. Lebensmittel-Wissenschaft und -Technologie, v. 5, p. 759-765, 2007.
LABOISSIÈRE, L. H. E. S. et al. Effect of high hydrostatic pressure (HHP) on sensory characteristics of yellow passion fruit juice.
Innovative Food Science and Emerging Technologies, v. 8, p. 469-477, 2007.
MANCINI, F.; MCHUGH, T. H. Fruit-alginate interactions in novel restructured products. Nahrung, v. 44, p. 152-157, 2000.
MOUQUET, C.; DUMAS, J. C.; GUILBERT, S. Texturization of sweetened mango pulp: optimization using Response Surface Methodology. Journal of Food Science, v. 6, p. 1395-1400, 1992. NUNES, T. S., QUEIROZ; L. P. de. A família Passifloraceae na Chapada
da Diamantina, Bahia, Brasil. Sitientibus - Séries Ciências Biológicas, v. 1, p. 33-46, 2001.
OLIVIER, D.; GUIGOU, B.; BOUILLETTE, T. Produit alimentaire reconstitué, procede et mélanger pour sa préparation. EP 0274301 Al, 1998.
RODRIGUES, M. I.; IEMMA, A. F. Planejamento e otimização de processos: uma estratégia seqüencial de planejamentos. Campinas: Casa do Pão Editora, 2005.326 p.
TENN, F. E. Fruit filler for pastry products and process for its preparation. US 4562080, 1985.
SASS-KISS, A. et al. Differences in anthocyanin and carotenoid content of fruits and vegetables. Food Research International, v. 38, p. 1023-1029, 2005.