(Annals of the Brazilian Academy of Sciences)
Printed version ISSN 0001-3765 / Online version ISSN 1678-2690 www.scielo.br/aabc
Chemical migration during soil water retention curve evaluation
LUIZ F. PIRES1, FELIPE C.A. VILLANUEVA2, NIVEA M.P. DIAS1,3, OSNY O. SANTOS BACCHI2 and KLAUS REICHARDT2
1Laboratório de Física Aplicada a Solos e Ciências Ambientais, Universidade Estadual de Ponta Grossa/UEPG,
Av. Gen. Carlos Cavalcanti, 4748, 84030-900 Ponta Grossa, PR, Brasil
2Centro de Energia Nuclear na Agricultura, USP/CENA, Caixa Postal 96, 13400-970 Piracicaba, SP, Brasil 3Departamento de Ciência do Solo, Universidade Estadual de Ponta Grossa/UEPG,
Av. Gen. Carlos Cavalcanti, 4748, 84030-900 Ponta Grossa, PR, Brasil
Manuscript received on August 11, 2009; accepted for publication on December 29, 2010
ABSTRACT
Wetting and drying (W-D) cycles can induce important elemental migrations in soils. The main purpose of this work was to study the possible existence of soil chemical elemental migrations in samples submitted to repeated W-D cycles during evaluations of soil water retention curve (SWRC). The experimental measurements were carried out by Atomic Absorption Spectrometry (AAS) for Ca2+, Mg2+and K+on samples of three different Brazilian tropical soils (Geric Ferralsol, Eutric Nitosol and Rhodic Ferralsol). Results demonstrate an increase in the electrical conductivity of the water extracted from the samples and significant losses of Ca2+, Mg2+and K+during the applications of up to nine W-D cycles. It was also observed differences in SWRC for all soils when samples submitted to the application of several W-D cycles were compared with samples not submitted to it. These differences occurred at the region of both structural and textural pores. A possible explanation for these results could be the soil chemical migration during the sequences of W-D cycles, which can affect the soil structure development.
Key words:analytical methods, soil structure, wetting-drying cycles, soil physics.
INTRODUCTION
The relationship between soil water matric potential (9m) and the respective water content (θ), identified
as the soil water retention curve (SWRC), represents a fundamental part of the soil hydraulic and physical characterization (Richards 1941). The SWRC is used to predict the retention of water available to plants and water movement through the soil. This hydraulic prop-erty is several times taken as a static characteristic of a given soil (Klute 1986). During its evaluation, the most common methodology submits a same soil sample to a series of wetting and drying (W-D) cycles that can cause important changes in soil structure, especially in pore size distribution, with practical consequences when
cal-Correspondence to: Luiz Fernando Pires E-mail: [email protected]; [email protected]
culatingθ storages and9m values widely used in the
irrigation management. When these changes occur, the SWRC cannot be considered a static soil property.
As the soil water matric potential is less than zero (negative) for high values of9m near soil saturation,
the SWRC depends very much on soil structure or par-ticle-size distribution, and for low values of9m (very
According to some scientific reports (Russo and Bresler 1977, Frenkel et al. 1978, Oliveira et al. 2005), water retention and movement can present differences due to 1) increases in the Na to Ca ratio of soil samples saturated with solutions containing these ions in their composition; 2) changes in water-dispersible clay as a result of modifications in the distribution of chemical elements inside the soil; and 3) alterations in soil poros-ity by dispersed clay particles caused by changes in the ion concentration of soils. In spite of these facts, no systematic studies on possible soil chemical element mi-grations during the SWRC evaluations were published in the soil science literature for tropical soils.
The purpose of this investigation was twofold: first, to design a practical method to measure chemi-cal elements in the soil solution flow (migration) dur-ing the SWRC evaluation; and second, to analyze pos-sible changes of soil ion composition after W-D cycles and their impacts on water retention. Such information is valuable to understand the physical, chemical and physicochemical processes that occur in soil samples submitted to W-D cycles during the measurement of soil hydraulic properties in the laboratory, as well as in natural soils in the field.
MATERIALS AND METHODS
SOILSAMPLING ANDWETTING ANDDRYING(W-D)
OFSAMPLES
Core samples were collected in Piracicaba, SP, Brazil (22◦4′S; 47◦38′W; 580 m above sea level) and char-acterized as: Geric Ferralsol (GF) (770 sand, 50 silt, 180 clay, 16.0 g kg−1organic matter (OM), 1.56 g cm−3
dry bulk density (db), cations exchange (CE) 35.5 mmolc dm−3Ca, 20.8 mmol
cdm−3Mg, 2.6 mmolcdm−3K), Eutric Nitosol (EN) (240 sand, 330 silt, 430 clay, 20.2 g.kg−1OM, 1.62 g cm−3d
b, CE 24.6 mmolcdm−3 Ca, 14.5 mmolc dm−3 Mg, 2.3 mmolc dm−3 K) and Rhodic Ferralsol (RF) (150 sand, 290 silt, 560 clay, 27.0 g kg−1OM, 1.33 g cm−3d
b, CE 8.4 mmolcdm−3 Ca, 5.9 mmolcdm−3Mg, 2.5 mmolcdm−3K), according to FAO classification (FAO 1998). The main soil chem-ical and physchem-ical properties were analyzed according to standard analytical methods recommended by Camargo et al. (1986) and van Raij et al. (1987).
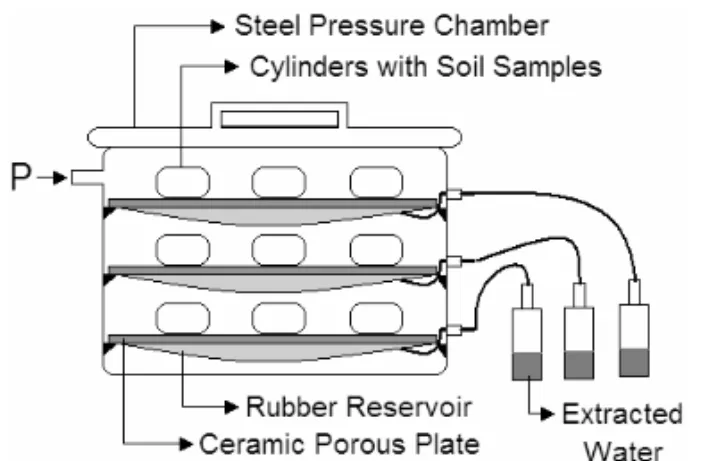
Samples of GF were collected in a non-cultivated area, covered by grasses and weeds, near an Eucalyptus artificial forest; those of EN in a coffee field established in 2001; and those of RF in a native mixed forest. A total of twenty-four core samples (3.0 cm high and 4.8 cm in diameter), eight from each soil, were collected from the soil surface layer (3-7 cm) from an area of approxi-mately 1 m2with aluminum cylinders using a stainless steel core sampler (3.2 cm high and 5.0 cm internal diam-eter to allow the introduction of the aluminum cylinder). Soil samples were wetted (W) to saturation by the capillary rise method. After the equilibrium of the cap-illary rise, samples were soaked in a tray with the wa-ter level just below the top of the aluminum rings for forty-eight hours, and assumed to be sufficient to satu-rate the samples and to minimize entrapped air bubbles (Klute 1986). Afterwards samples were partially dried (D) by submitting them to a 400 kPa pressure (P) in a pressure chamber. Repeating these procedures, samples were submitted to series of W-D cycles. For the eval-uation of the SWRC, the procedures described in Klute (1986) were used. The Retention Curve software RETC (van Genuchten et al. 1991) was used to fit meanθand 9m data for each soil and treatment.
EXPERIMENTALSETUP FORATOMICABSORPTION
SPECTROMETRY ANDELECTRICALCONDUCTIVITY
ANALYSES
extracted solution during each D procedure performed at 400 kPa of pressure. A series of 9 W-D cycles was used to perform the migration studies. One ceramic porous plate was used for each set of three samples of the same soil, and each set of soil samples and porous plates was saturated in a same water reservoir.
Fig. 1 – Experimental set-up designed to collect the extracted water from the pressure chambers used for the SWRC evaluation.
Water analysis before each sample wetting was car-ried out to check any variation in the water chemical composition during the application of the 9 W-D cycles, being aware of the existence of any possible migra-tion of a chemical element caused by water applicamigra-tion. Water electrical conductivity analysis was performed at 25 ± 1◦C with a conductivimeter, model CA-150,
equipped with a platinum cell and temperature sensor with 1% of uncertainty. For the system calibration, a standard solution of conductivity 0.147 dS m−1 was
used. AAS analyses of Ca2+, Mg2+ and K+ were made using an atomic absorption spectrometer, model SpectrAA100.
AAS is an analytical technique for measuring ele-mental concentrations based on the specific absorption wavelength by atoms of different elements in an atom-ized sample – i.e., the measurement of state free atoms converted into the ground state in the vapor state. The amount of light absorbed is proportional to the number of specific atom species. With the help of a calibration curve, it is possible to calculate the concentration of the respective elements in the atomized sample.
STATISTICAL ANDDATAANALYSIS
Normality tests were performed on data prior to their statistical processing. An analysis of variance (ANOVA) and the Tukey multiple range test (P<0.05) were
per-formed to analyze statistical differences and to discrim-inate means.
Relative differences (1C) between treatments
(W-D cycles) were obtained by using the following equation:
1C=
C1−C9
C1
∙100 (1)
where C1and C9represent samples submitted to 1 and
9 W-D cycles, respectively. However, C1 is given by
the difference between the faucet water used for the first wetting of samples and the water extracted after the first pressure application and, consequently, C9 is given by
the difference between the faucet water used for the nine wetting and the water extracted after the nine pressure application.
RESULTS AND DISCUSSION
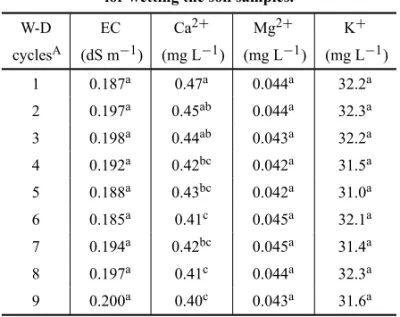
Electrical Conductivity analyses of the water used for the wetting of the samples practically remained con-stant for each W-D cycle (Table I). This result becomes evident when analyzing the angular coefficient of the adjustment straight line (y = 0.0006x+ 0.1903). By
analyzing Table I it is also possible to observe that there are no significant statistical differences (Tukey’s multiple range test, P<0.05) among the water used for
the wetting of the samples for each W-D cycle.
In relation to the extracted water from soil samples (Fig. 2), all of them presented increases of EC giving an indication of chemical element migration from soils after replications of W-D cycles. The results presented in Figure 2 represent the EC differences between wet-ting and extraction waters, using the wetwet-ting water as background. The greatest EC increases of the water extracted of soils occurred for the GF (Fig. 2a) and RF (Fig. 2c) soils, followed by the EN (Fig. 2b) one. It is possible to infer from these results that the GF and RF soils presented the greatest migration of chemical ele-ments due to W-D cycles. The relative differences (1C)
of EC between the first (C1) and last (C9) W-D cycle
for the three soils were: 145% (GF), 58% (EN) and 105% (RF). The significant angular coefficients of the adjustment straight lines (P<0.05) show that all soils
TABLE I
Data of EC (dS m−1), Ca2+, Mg2+and K+ concentrations (mg L−1) of the water used
for wetting the soil samples.
W-D EC Ca2+ Mg2+ K+
cyclesA (dS m−1) (mg L−1) (mg L−1) (mg L−1) 1 0.187a 0.47a 0.044a 32.2a
2 0.197a 0.45ab 0.044a 32.3a
3 0.198a 0.44ab 0.043a 32.2a
4 0.192a 0.42bc 0.042a 31.5a 5 0.188a 0.43bc 0.042a 31.0a
6 0.185a 0.41c 0.045a 32.1a
7 0.194a 0.42bc 0.045a 31.4a
8 0.197a 0.41c 0.044a 32.3a
9 0.200a 0.40c 0.043a 31.6a
AFaucet water was used for each wetting and drying (W-D) cycle;
EC, Ca2+, Mg2+and K+mean values followed by the same letters
(in columns among different W-D cycles) are not statistically dif-ferent (P<0.05), as determined by the Tukey’s multiple range test (completely randomized design, n=3).
In order to refine the understanding of the results of EC, the analysis of the concentrations of Ca2+, Mg2+ and K+ made by AAS (Figs. 3 to 5) indicates concentration differences between wetting and extrac-tion waters. Some statistical differences (P<0.05) were
found only for Ca2+ (Table I) in the faucet water used for wetting the soil samples. These statistical differ-ences for Ca2+ can be attributed to the use of calcium carbonate by the water treatment plant to correct the pH level of the faucet water. Usually, the rate of usage of the calcium carbonate is dependent on the pH of the water and the amount of treated water. This analysis was chosen because these three cations, together with NO−
3, SO24−, Cl−and Na+, are the most susceptible ions
to be leached through soil profiles, and they represent the main share in soil nutrient losses, causing also soil acidification due to ion leaching (van Raij 1986, Sparks 1998, Havlin et al. 2005).
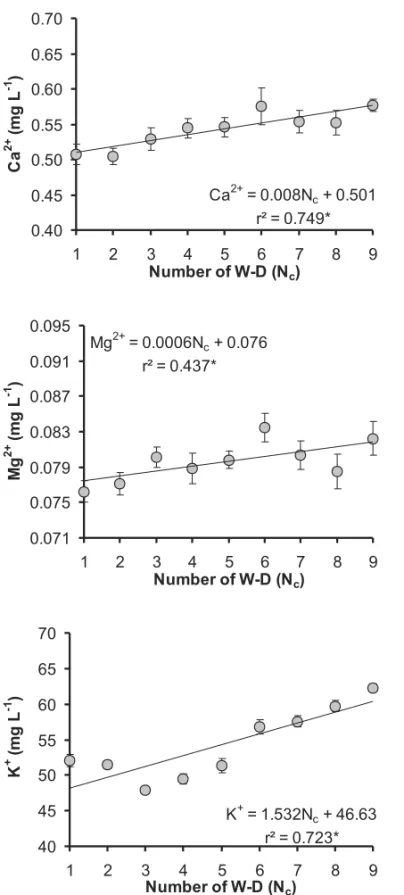
The relative difference (1C) of the Ca2+ (Fig. 3)
concentration in the extraction water between C1 and
C9 W-D cycles for the GF soil was 436%, while these
differences for Mg2+ (Fig. 3) and K1+ (Fig. 3) were only 19% and 55%, respectively. For the EN and RF soils (Figs. 4 and 5), the increase of Ca2+, Mg2+ and
EC = 0.007Nc+ 0.207
r² = 0.976* 0.20
0.22 0.24 0.26 0.28 0.30
0 1 2 3 4 5 6 7 8 9 10
EC = 0.005Nc+ 0.221
r² = 0.854* 0.20
0.22 0.24 0.26 0.28 0.30
0 1 2 3 4 5 6 7 8 9 10
EC = 0.006Nc+ 0.211
r² = 0.896* 0.20
0.22 0.24 0.26 0.28 0.30
0 1 2 3 4 5 6 7 8 9 10
Fig. 2 – EC (dS m−1) variation of the extracted water after the
appli-cation of W-D cycles for the three Brazilian soils (GF, EN and RF). *Significant to 5% by the F test.
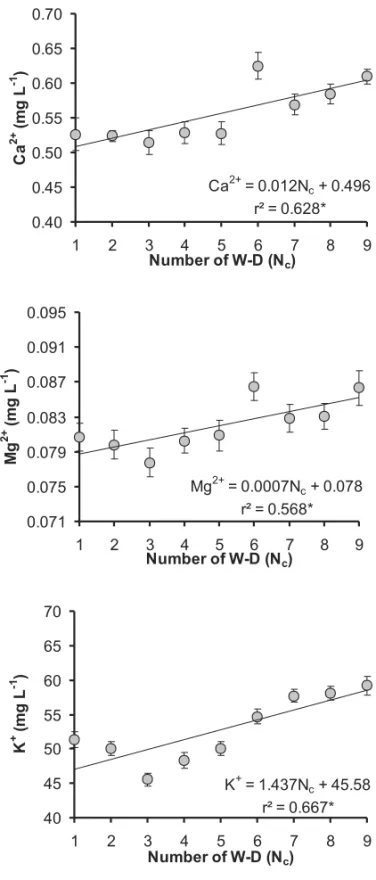
K+ concentrations of the extraction water was similar to that (increase) obtained for the GF soil. In relation to the EN soil (Fig. 4), 1C between C1 and C9 W-D
K+= 1.532Nc+ 46.63
r² = 0.723* 40
45 50 55 60 65 70
1 2 3 4 5 6 7 8 9
Ca2+= 0.008Nc+ 0.501
r² = 0.749* 0.40
0.45 0.50 0.55 0.60 0.65 0.70
1 2 3 4 5 6 7 8 9
Mg2+= 0.0006Nc+ 0.076
r² = 0.437*
0.071 0.075 0.079 0.083 0.087 0.091 0.095
1 2 3 4 5 6 7 8 9
Fig. 3 – Calcium (Ca2+), Magnesium (Mg2+) and Potassium (K+)
variation of the extracted water after the application of W-D cycles for the GF soil. *Significant to 5% by the F test.
248% (Ca2+), 16% (Mg2+) and 45% (K+). According to the regression analysis, all soils presented statistical differences (P<0.05) of Ca2+, Mg2+and K+losses with
the application of W-D cycles, with the exception to the Mg2+migration for the EN soil.
Mg2+= 0.0002Nc+ 0.082
r² = 0.359ns 0.071
0.075 0.079 0.083 0.087 0.091 0.095
1 2 3 4 5 6 7 8 9
K+= 1.285Nc+ 45.70
r² = 0.574* 40
45 50 55 60 65 70
1 2 3 4 5 6 7 8 9
Ca2+= 0.005Nc+ 0.530
r² = 0.602* 0.40
0.45 0.50 0.55 0.60 0.65 0.70
1 2 3 4 5 6 7 8 9
Fig. 4 – Ca2+, Mg2+and K+variation of the extracted water after
the application of W-D cycles for the EN soil. *Significant to 5% by the F test.
The results of1C in ion concentrations between
C1 and C9 W-D cycles show that Ca2+ was the most
between ions and clay surfaces (van Raij and Kupper 1966, van Raij 1969). This series is most commonly de-scribed in the order: Ca2+>Mg2+> K+and, therefore, for equivalent amounts of exchangeable cations the soil losses of K+ are more significant than those of Mg2+ and Ca2+(van Raij 1986). In this case, maybe the Ca2+ was the most removed ion from the soil samples because it was present in higher amount as an exchange cation than Mg2+and K+, and the Ca2+adsorbed to soil col-loids tends to equilibrate with the Ca2+of the soil solu-tion. On the other hand, by the mass effect of the K+ ion, it was in a higher concentration in the faucet water used for wetting the soil samples (Table I).
The greatest1C in ion concentrations between C1
and C9W-D cycles for these three ions occurred in the
following soil sequence:1CGF> 1CRF> 1CEN. These results are in line with the relative differences for EC values of the three soils: ECGF >ECRF>ECEN. Ac-cording to van Raij (1986), the total lixing of cations depends on the anions present in the soil and, therefore, the Ca2+losses should be related to the amounts of K+ and Mg2+ in the soil and to K+ in the water used to wet soil samples.
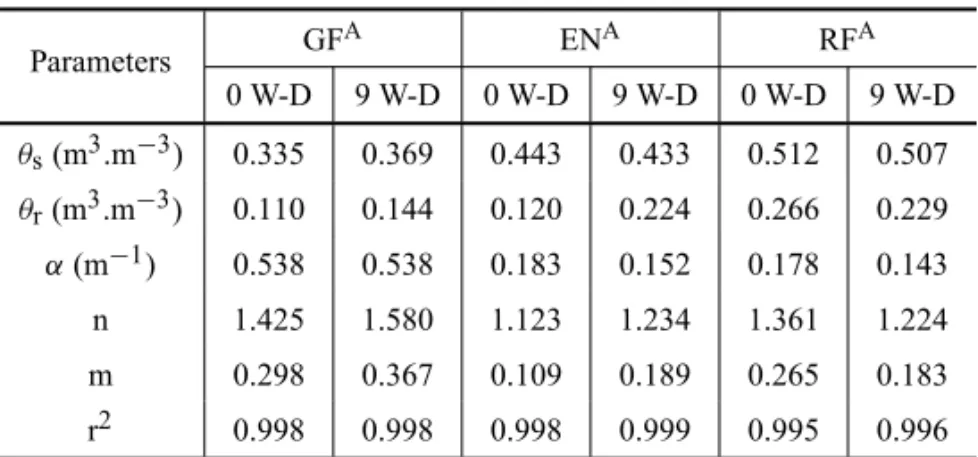
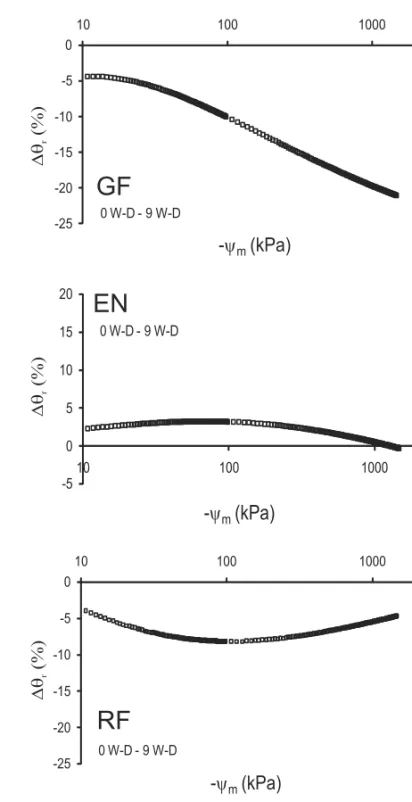
In Figure 6, it is possible to observe the effect of the W-D cycles in samples of the three soils. The para-meters, based on the van Genuchten equation with the Mualem restriction (Klute 1986) used for the mathemat-ical adjustment of the SWRC, are presented in Table II. From Figure 6, after the application of 0 and 9 W-D cycles, a higher amount of water remained in the soil samples for all applied matric potentials, excepting the EN soil. The EN and RF soils (Fig. 6) presented a similar behavior, with an increase in the difference of water retention for intermediate9m and an
approx-imation of the SWRC for lower 9m values (Fig. 7).
On the other hand, the GF soil (Fig. 6) showed the op-posite, with a constant increase in water retention for lower matric potentials (Fig. 7). This result is important due to its application in practical agriculture, once this additional water retained in the pores after W-D cycles can be used by plants and roots in the case of the GF and RF soils.
It is known that aggregated soils present differ-ences between textural and structural pores (Kutílek 2004). Textural pores are basically related to the
dis-K+= 1.437Nc+ 45.58 r² = 0.667* 40
45 50 55 60 65 70
1 2 3 4 5 6 7 8 9
Ca2+= 0.012Nc+ 0.496
r² = 0.628* 0.40
0.45 0.50 0.55 0.60 0.65 0.70
1 2 3 4 5 6 7 8 9
Mg2+= 0.0007Nc+ 0.078
r² = 0.568* 0.071
0.075 0.079 0.083 0.087 0.091 0.095
1 2 3 4 5 6 7 8 9
Fig. 5 – Ca2+, Mg2+and K+variation of the extracted water after
the application of W-D cycles for the RF soil. *Significant to 5% by the F test.
TABLE II
The SWRC parameters obtained for the van Genuchten equation for the soils submitted to 0 W-D and 9 W-D cycles.
Parameters GF
A ENA RFA
0 W-D 9 W-D 0 W-D 9 W-D 0 W-D 9 W-D
θs(m3.m−3) 0.335 0.369 0.443 0.433 0.512 0.507
θr(m3.m−3) 0.110 0.144 0.120 0.224 0.266 0.229
α(m−1) 0.538 0.538 0.183 0.152 0.178 0.143
n 1.425 1.580 1.123 1.234 1.361 1.224
m 0.298 0.367 0.109 0.189 0.265 0.183
r2 0.998 0.998 0.998 0.999 0.995 0.996
AGF, EN and RF represent Geric Ferralsol, Eutric Nitosol and Rhodic Ferralsol,
respectively.
(1996) and Phogat and Aylmore (1989) showed changes in soil macroporosity distribution on wetting and sub-sequent drying processes. Their results indicated the in-stability of structural pores upon wetting and drying.
Recently, Pires et al. (2008) applied the log-nor-mal Pore Size Distribution (PSD) model of matric po-tential to evaluate effects of W-D cycles on the structure of the same three soils used in the present study. These authors divided the soil pores into two categories: matrix or textural and structural pores, as suggested by Kutílek (2004). The obtained results showed that the application of successive W-D cycles caused important changes in the two categories of soil pores for all soils. For the GF and RF soils, the most important changes occurred in the structural domain (larger values of matric potential). On the other hand, for the EN soil, the most significant changes were found in the matrix domain. These results can help to explain the different changes in the SWRC (0 W-D and 9 W-D) obtained for the GF in relation to the other soils.
As the SWRC (Fig. 7) presented differences in the region of textural (pores diameter<3.0μm) and
struc-tural pores (pores diameter>3.0μm), a possible
indi-cation of these behaviors could also be the soil migra-tions of chemical elements. These element migramigra-tions will mainly affect the region of textural pores. It is well known that basic ions cause the flocculation of colloids, and the decalcification of soils causes dispersion and, in relation to the type of exchangeable bases, they affect clay expansion. The basal space among the layers of the clays can vary from 1 nm, when occupied by K+, to
1.5 nm, when occupied by water molecules or hydrated Ca2+ and Mg2+ions (Meurer 2006). It is also known that the soil development is influenced by a series of factors, such as: 1) exchangeable ions on the clay; 2) presence of iron and aluminum oxides that act as ce-menting agents; and 3) binding between organic and inorganic compounds (Kutílek and Nielsen 1994).
According to several authors, changes in K+ and Ca2+ contents can affect the soil aggregate stability, which is directly related to water movement and reten-tion (Camargo et al. 1983, Ravina 1973). Therefore, it is possible to conclude that changes in the soil chemical composition, after several W-D cycles, can probably af-fect the SWRC. This result has important consequences in agricultural applications because these modifications in the soil structure can affect plant and root develop-ment, as well as the evaluation of SWRC.
0.05 0.10 0.15 0.20 0.25 0.30
10 100 1000
(m
3
m
-3)
- m(kPa)
GF
0.25 0.30 0.35 0.40 0.45
10 100 1000
(m
3
m
-3)
- m(kPa)
EN
0.25 0.30 0.35 0.40 0.45 0.50
10 100 1000
(m
3
m
-3)
-
m(kPa)
RF
0 W-D
9 W-D 0 W-D
9 W-D 0 W-D
9 W-D
0 W-D
9 W-D
Fig. 6 – SWRCs obtained for treatments 0 W-D and 9 W-D cycles for GF, EN and RF soils.
clays that present large content of smectite clay min-erals. However, Pires et al. (2005) showed that the ap-plication of W-D cycles in samples collected in volu-metric rings provokes changes in soil volume even for these non swelling-soils. According to these authors, this phenomenon occurs because, during wetting and after drying, the process of friction between the soil column and the cylinder wall can influence the adequate settlement of the sample. When the soil sample is sub-mitted to several W-D cycles, this effect is increased
-25 -20 -15 -10 -5 0
10 100 1000
r
(%)
-
m(kPa)
0 W-D - 9 W-D
GF
-5 0 5 10 15 20
10 100 1000
-
m(kPa)
0 W-D - 9 W-D
EN
r
(%)
-25 -20 -15 -10 -5 0
10 100 1000
-
m(kPa)
0 W-D - 9 W-D
RF
r
(%)
Fig. 7 – Relative difference of soil volumetric water content (1θr)
between the SWRC obtained for treatments 0 W-D and 9 W-D cycles for GF, EN and RF soils.
and changes in its height and, consequently, its volume, are observed. This change in soil volume directly affects the region of structural soil pores as observed for the GF and RF soils (Pires et al. 2009).
con-nectivity, which affects the water flow through pores. In our study, differences in the volumetric water content occurred in the following soil sequence: θRF > θEN > θGF(Table II and Fig. 6). This result was expected due
to the higher OM content of the RF soil in relation to the EN and GF soils. Differences on saturated water contents (θsRF > θsEN > θsGF) can also be explained
by the soil compositions. It is known that clay soils (RF and EN) present higher values ofθsthan silt loam and
sand soils (GF). Recently, Zhuang et al. (2008) studied the soil water hysteresis in water-stable microaggreg-ates as affected by OM. These authors showed that OM removed by combustion reduced soil water retention in the microaggregates, and that the reduction tended to get smaller for lower matric potentials. This result sug-gests that more OM was present in larger pores instead of in smaller ones from which water was drained. Therefore, the OM distribution in soil structure can also explain some of the results obtained in this study (Figs. 6 and 7). For example, a high concentration of OM for a specific range in size of soil pores can help to explain the approximation of the SWRC before and after the application of W-D cycles. By using this hypothesis, we can conclude that the EN soil presents a more homogeneous distribution of OM for all classes of pore sizes after the application of W-D cycles (Fig. 7).
The process of hysteresis can also influence the SWRC. The main causes of hysteresis are air entrap-ment, variation in solid-liquid contact angle, different spatial connectivity of pores during wetting and dry-ing process, and geometric non-uniformity of individual pores. In summary, hysteresis mainly occurs because of differences in pore shape, size and interconnectivity. In order to avoid the air entrapment, the very same proce-dure of soil saturation was always used during the ap-plication of W-D cycles in our study. This procedure was followed to avoid changes in soil structure during wetting (Klute 1986). A sudden immersion of samples in water can cause slaking of the soil aggregates and, consequently, changes in the SWRC. Unfortunately it was not possible to make the analysis of hysteresis in our study because the measurements of the wetting curve are both time and labor consuming, also requir-ing the use of expensive special equipments.
Chemical element migrations due to the application of W-D cycles are very important, once the respective
ion losses can affect the quality of the SWRC and also of hydraulic conductivity measurements (Klute 1986). According to Lima et al. (1990), increases of sodium content in soils change the water holding capacity for a specific pressure as a result of pore-size reduction by swelling clay particles. As a consequence, the hydraulic conductivity can also be affected. Russo and Bresler (1977) also reported differences in the SWRC and hy-draulic conductivities of soil samples saturated with solutions containing a given composition of Na+ and Ca2+ions. These last authors demonstrated that an in-crease in the Na+to Ca2+ratio and a decrease in the soil solution concentration greatly affect soil water-suction relationships. Oliveira et al. (2005) assessed the influ-ence of W-D cycles on Water-Dispersible Clay (WDC) and showed that soils of reduced aggregate stability are more susceptible to the action of W-D on the WDC. Ac-cording to Frenkel et al. (1978), the plugging of pores by dispersed clay particles is the major cause of reduc-tion in hydraulic conductivity and changes in sucreduc-tion head when the ion concentrations of soils are changed.
CONCLUDING REMARKS
The investigation of the migration of chemical elements of the soil by AAS led to the quantification of some ion losses when a soil is submitted to several W-D cycles. The analysis of EC indicates that the application of up to nine W-D cycles produced significant losses of ions for the three Brazilian tropical soils (GF, EN and RF) investigated in this study. It was also observed by the AAS technique that the ions Ca2+, Mg2+and K+ pre-sented significant decreases in the soils after repeated W-D cycles. The result was in part associated with the lyotropic series that defines the strength of bonding be-tween ions and clay surfaces. The soil water retention curves presented differences in the region of both tex-tural and structex-tural pores after the application of W-D cycles. These differences are probably associated with changes in soil structure and in soil chemical composi-tion after sequences of wetting and drying.
ACKNOWLEDGMENTS
Superior (CAPES) (Grant no. BEX1245/05-8) both of Brazil, for the financial support and fellowships.
RESUMO
Os ciclos de umedecimento e secamento (U-S) podem induzir importantes migrações de elementos químicos no solo. O objetivo principal deste trabalho foi estudar a possível exis-tência de migração de elementos químicos em amostras de so-los submetidas a repetidos cicso-los de U-S durante a avaliação da curva de retenção de água do solo. As determinações de Ca2+, Mg2+e K+ foram obtidas por Espectrometria de Absorção Atômica em três diferentes solos tropicais do Brasil (Latossolo Vermelho-Amarelo, Nitossolo Vermelho e Latossolo Verme-lho). Os resultados demonstram um aumento da condutividade elétrica da água extraída das amostras de solo e perda signi-ficativa de Ca2+, Mg2+e K+após a aplicação de nove ciclos de U-S. Diferenças nas curvas de retenção foram também ob-servadas para todos os solos quando as amostras submetidas aos ciclos de U-S foram comparadas com as amostras não sub-metidas. Essas diferenças ocorreram tanto na região estrutural quanto textural dos poros do solo. Uma possível explicação para esses resultados pode ser a migração de elementos quími-cos do solo durante as sequências de ciclos de U-S, os quais podem afetar o desenvolvimento da estrutura do solo.
Palavras-chave: métodos analíticos, estrutura do solo, ciclos de umedecimento e de secamento, física do solo.
REFERENCES
CAMARGOLC, MONIZAC, JORGE JAANDVALADARES
JMAS. 1986. Métodos de análise química, mineralógica e física de solos. Boletim Técnico, 106. Campinas: Insti-tuto Agronômico de Campinas (IAC), 94 p.
CAMARGO OA, VALADARES JMAS ANDGERALDIRN. 1983. Características químicas e físicas de solo que re-cebeu vinhaça por longo tempo. Boletim Técnico, 76. Campinas: Instituto Agronômico de Campinas (IAC), 30 p.
FAO. 1998. World reference base for soil resources. World Soil Resources Report 84. Rome: Food and Agriculture Organization of the United Nations, 91 p.
FRENKELH, GOERTZENJOANDRHOADESJD. 1978. Ef-fects of clay type and content, exchangeable sodium per-centage, and electrolyte concentration on clay dispersion and soil hydraulic conductivity. Soil Sci Soc Am J 42: 32–39.
GROHMANN FANDCAMARGOOA. 1973. Influência dos óxidos de ferro livres e da matéria orgânica na adsorção de água pelo solo. Bragantia 32: 203–222.
HAVLINJL, BEATONJD, TISDALESLANDNELSONWL. 2005. Soil fertility and nutrient management: an intro-duction to nutrient management. New Jersey: Prentice Hall, 515 p.
KLUTEA. 1986. Water retention: laboratory methods. In:
BLACKCA (Ed), Methods of Soil Analysis. I. Physical
and Mineralogical Methods, Madison: ASA, Madison, USA, p. 635–662.
KUTÍLEK M. 2004. Soil hydraulic properties as related to soil structure. Soil Till Res 79: 175–184.
KUTÍLEK M AND NIELSEN DR. 1994. Soil Hydrology. Germany: Catena Verlag, 370 p.
LIMALA, GRISMERMEANDNIELSENDR. 1990. Salinity effects on Yolo Loam hydraulic-properties. Soil Sci 150: 451–458.
MEUREREJ. 2006. Fundamentos de química do solo. Porto Alegre: Evangraf, 285 p.
NIMMO JR. 1997. Modeling structural influences on soil water retention. Soil Sci Soc Am J 61: 712–719. OLIVEIRA TS, COSTA LM AND SCHAEFER CE. 2005.
Water-dispersible clay after wetting and drying cycles in four Brazilian oxisols. Soil Till Res 83: 260–269. PHOGATVKANDAYLMORELAG. 1989. Evaluation of soil
structure by using computer-assisted tomography. Aust J Soil Res 27: 313–323.
PIRES LF, BACCHI OOS AND REICHARDT K. 2005. Gamma ray computed tomography to evaluate wetting/ drying soil structure changes. Nucl Instr Meth Phys Res B 229: 443–456.
PIRES LF, CASSAROFAM, REICHARDT KANDBACCHI
OOS. 2008. Soil porous system changes quantified by analyzing soil water retention curve modifications. Soil Till Res 100: 72–77.
PIRES LF, REICHARDT K, COOPER M, CASSARO FAM,
DIAS NMP AND BACCHI OOS. 2009. Pore system
changes of damaged Brazilian oxisols and nitosols in-duced by wet-dry cycles as seen in 2-D micromorphologic image analysis. An Acad Bras Cienc 81: 151–161. RAVINA I. 1973. The mechanical and physical behavior of
Ca-clay soil and K-clay soil. In: HADAS A (Ed),
Phys-ical aspects of soil water and salts in ecosystems, Berlin: Springer-Verlag, Berlin, Germany, p. 131–140.
RICHARDSLA. 1941. A pressure-membrane extraction ap-paratus for soil solution. Soil Sci 51: 377–386.
RUSSODANDBRESLERE. 1977. Effect of mixed Na-Ca solutions on hydraulic-properties of unsaturated soils. Soil Sci Soc Am J 41: 713–717.
SALTER PJ AND WILLIAMS JB. 1965. The influence of texture on the moisture characteristics of soils. II. Avail-able water capacity and moisture release characteristics. J Soil Sci 16: 310–317.
SARMAHAK, PILLAI-MCGARRYUUPANDMCGARRYD.
1996. Repair of the structure of a compacted Vertisol via wet/dry cycles. Soil Till Res 38: 17–33.
SPARKSDL. 1998. Soil Physical Chemistry, 2nded., London: Lewis Publishers, 409 p.
VAN GENUCHTENMTH, LIEJ FJ AND YATESSR. 1991. The RETC code for quantifying the hydraulic functions of unsaturated soils. Riverside: USDA.
VAN RAIJ B. 1969. A capacidade de troca de cátions das frações orgânica e mineral em solos. Bragantia 28: 85– 112.
VAN RAIJ B. 1986. Propriedades eletroquímicas de solo. In: SIMPÓSIOAVANÇADO DEQUÍMICA EFERTILIDA
-DE DOSOLO, Piracicaba. Anais…, Campinas: Fundação Cargill, p. 9–41.
VANRAIJBANDKUPPERA. 1966. Capacidade de troca de catíons em solos: estudo comparativo de alguns métodos. Bragantia 25: 327–336.
VAN RAIJB, QUAGGIOJA, CANTARELLAH, FERRERIRA
ME, LOPESASANDBATAGLIAOC. 1987. Análise
quí-mica do solo para fins de fertilidade. Campinas: Fundação Cargill, 170 p.
WAKINDIKIIICANDBEN-HURM. 2002. Soil Mineralogy and texture effects on crust micromorphology, infiltration, and erosion. Soil Sci Soc Am J 66: 897–905.
ZHUANGJ, MCCARTHYJF, PERFECTE, MAYERLMAND