Nuno César dos Santos Grosso
Engenheiro do AmbienteDevelopment of a satellite based PM
10concentration
product for urban areas
Dissertação para obtenção do Grau de Doutor em Engenharia do Ambiente
Orientador: Francisco Manuel Freire Cardoso Ferreira, PhD, Professor Associado, FCT/UNL
Co-orientadores: Maria Júlia Fonseca de Seixas, PhD, Professora Associada, FCT/UNL
Júri:
Presidente: António Pereira de Sousa da Câmara
PM10
Copyright © Nuno César dos Santos Grosso, FCT/UNL, UNL.
Acknowledgments
During these years many are the ones I have to be thankful to, both at a professional and personal level. I won’t do them justice in the next lines. But I will try.
Both my supervisors, Francisco Ferreira and Júlia Seixas, for giving me the opportunity to start working in science, the freedom to develop my own path and the support necessary to finish the thesis.
Dr. Nicolaos Sifakis, of the National Observatory of Athens, for providing me the opportunity to work with him in Athens and introducing me to the sub; ject and method that would become the core of my thesis research.
The Air Quality research group in the FCT/UNL, for all the help, through; out these years, regarding project development, air quality data collection and literature review. I especially would like to thank: Joana Monjardino for the precious help collecting the necessary air quality datasets and for providing me with several of the papers, reports and legislation used during the literature re; view; Sandra Mesquita, for all the work developed with me in the Aircast pro; ject and the help given in the several stages of my thesis; Hugo Tente for his help during the literature review and advices ; Pedro Gomes and Jorge Neto for the provided air quality and meteorological data.
Conceição Capelo and Carina Gomes, for always being available to solve any administrative problem I had with absolute competence and dedication.
For all the contributes during the entire writing process of this document, from the definition of its structure to the discussion of its content and finally its proof reading, I would like to thank Dimitris Paronis, Nuno Carvalhais, Pedro Lourenço, Francisco Ferreira and Júlia Seixas.
The CCIAM research group, especially Prof. Filipe Duarte Santos, the re; search centre coordinator, Maria João Cruz and Pedro Garrett, coordinators of the projects I’m currently involved, and Luís Dias, my office colleague, for all the support and understanding shown during this last two years, where I had to divide my time between the thesis and everyday work.
Since 2003, when we first meet in a conference in Crete, he not only opened the door to his office but also the door to his home, both with tremendous generosi; ty. During these last years he became a friend that I truly treasure.
António Rocha and Nuno Pacheco, for their friendship and the work de; veloped in some of the parallel projects that supported my research.
Pedro Lourenço, for his friendship, generosity and for the always interest; ing inputs to the work being developed.
João Pedro Nunes, who I see not only as one of my friends but also as a role model in terms of scientific research work and to whose advices I’ve al; ways listened with great attention.
Nuno Carvalhais is another of those role models but mostly is one of my best friends, present in so many great moments of my life in the last 12 years. He was always the right person to discuss everything, from the details of my research to our borderline philosophical problems during the sometimes trou; blesome PhD years and was therefore an essential part of all this process.
Ricardo Franco, Rui Pimenta and Hugo Tente, who have been constant presences in my life for many years now and, with their endless camaraderie, have helped me to keep sane and to see that there are more important things in life than work.
My grandmother, my sister, my mother and my father. They are the strength behind this thesis. Without their love and support this work would have been impossible. These pages are as much theirs as they are mine.
Suspended particulate matter (PM) is one of the most important atmos; pheric constituents with significant impacts in the climate system and human health. The wide spatiotemporal scale of their effects represents a monitoring challenge that current ground based systems, with limited spatial coverage, cannot fully address. Satellite aerosol optical thickness (AOT) products can complement those monitoring systems by providing, in a periodical basis, spa; tially resolved ground PM distribution patterns, estimated using linear regres; sion models. Since most satellite AOT products have relevant limitations over high reflective urban areas, where most anthropogenic PM emission sources and world population are concentrated, the development and validation of al; gorithms to tackle these constraints assumes a paramount importance.
led to a relatively good agreement with the AERONET AOT measurements (r=0.78) for a set of selected European cities and a higher number of valid re; trievals when comparing with the MODIS standard aerosol product, support; ing the use of this algorithm for urban satellite AOT retrieval. However, the need to define multiple reference images with variable aerosol content as well as the AOT’s coarse spatial resolution limits its ability to extract absolute AOT values towards establishing spatially consistent urban aerosol distribution pat; terns.
The Lisbon Metropolitan air quality stations were used to assess AOT’s ability to reproduce PM10 concentrations. A characterization of the two varia; bles correlation as a function of PM10 time and spatial averaging, season, station type and seasonal reflectance differences between reference and polluted imag; es provided a comprehensive optimal framework for the development of the regression models. This analysis was complemented with the assessment of the relationship of these variables with several other meteorological parameters thus providing additional information to improve PM10/AOT correlation or di; rectly estimate PM10 concentrations.
Three PM10 ground concentration estimation regression models were de; veloped to fully assess AOT’s direct capability as the main estimator of daily ground PM10 concentration values. Furthermore, the impact of selected meteor; ological variables was also assessed using a multivariate approach, enhancing the representation of PM10 dispersion conditions.
These results demonstrated the potential of using contrast reduction based AOT values in ground PM10 concentration estimation for urban areas, thus helping to establish this AOT retrieval methodology as valid complement to other satellite aerosol products, currently used to assess ground particle concen; trations.
As partículas em suspensão (PM) são um dos mais importantes constituintes atmosféricos com impactes significativos no sistema climático e na saúde humana. A ampla escala espaciotemporal destes efeitos representa um desafio em termos de monitorização que as actuais redes de estações de medição de qualidade ao nível do solo não conseguem superar totalmente devido à sua limitada cobertura espacial. Os produtos de Densidade Ótica de Aerossóis (DOA) derivados de imagens de satélite constituem uma fonte de informação complementar aos sistemas de monitorização ao nível do solo. As suas características operacionais permitem a produção cíclica com elevada frequência de padrões espaciais de distribuição de concentrações de PM ao nível do solo, estimados a partir de modelos de regressão linear. A maior parte dos produtos de DOA estimados por satélite possui uma acurácia limitada sobre superfícies urbanas de elevada refletância, onde a maioria da população mundial e das fontes de emissão antropogénicas de PM se concentram. Sob esta perspetiva, o desenvolvimento e validação de algoritmos que superem as limitações de aplicação em zonas urbanas assume uma importância vital.
baseado na redução de contraste, desenvolvido a partir do método de Análise Diferencial da Textura. O estudo considerou diversos factores de optimização do algoritmo, tais como: a resolução espacial; a semelhança de geometria de visualização entre a imagem de referência e a imagem poluída; e a combinação de usos de solo. A consideração destes factores revela;se essencial nos cálculos de DOA, de forma a tornar os resultados mais estáveis e generalizáveis a outras áreas de estudo. As melhorias reflectem;se principalmente na minimização da influência negativa na acurácia do algoritmo introduzida por diferenças nos ângulos de visualização e por alterações sazonais na refletância da superfície. A implementação destas condições ótimas de aplicação do algoritmo de redução de contraste originou numa concordância significativa com as medições de DOA nas estações AERONET (r=0.78) e um número total de medições válidas mais elevado do que o obtido pelo produto standard de DOA do MODIS. Estes resultados sustentam a hipótese de uma maior adequação deste algoritmo para a estimação da densidade óptica de aerossóis em superfícies urbanas. No entanto, observa;se a necessidade de: definir diversas imagens de referência com um conteúdo residual de aerossóis variável (uma para cada grupo de imagens definido com base na semelhança de geometria de visualização); e de considerar a baixa resolução espacial dos valores de AOT ao nível do solo. Estes factores limitam a capacidade de extração de valores absolutos de AOT através de algoritmos baseados em detecção remota por satélite, capazes de definir padrões de distribuição espacialmente consistentes.
camada de mistura e humidade relativa) complementou a análise anterior. A contribuição dos parâmetros meteorológicos para a melhoria da correlação entre concentrações de PM10 e valores de DOA forneceu informação adicional relevante para a posterior estimação dos valores de PM10.
Foram desenvolvidos três modelos de regressão linear de estimação de concentrações de PM10 para avaliar a capacidade directa dos valores de DOA como principal variável preditora desses modelos. A introdução de variáveis meteorológicas foi estudada em esquemas de regressão multivariada, para melhorar a representação das condições de dispersão de PM10.
O primeiro modelo univariado desenvolvido só com os valores de DOA como variável independente explicou entre 37% e 61% da variância total das concentrações de PM10. Estes valores aumentaram para 53% e 68% ao adicionar a intensidade do vento e para 53% e 88% quando ambas as variáveis foram usadas para estimar valores diários de concentração, agregados para todas as estações. Os parâmetros de regressão estimados para o AOT são comparáveis aos encontrados por outros estudos independentes para diferentes regiões urbanas. A subestimação de concentrações de PM10, observável nos três modelos apresentados, parecem indicar que as estimações baseadas em imagens de satélite são mais representativas das concentrações de fundo e possuem uma capacidade limitada de reprodução de concentrações mais elevadas, características de áreas mais restritas, fortemente influenciadas por fontes pontuais (tráfego e indústria)
Os modelos de regressão apresentados demonstram o elevado potencial da utilização de valores de DOA calculados através de um algoritmo de redução de contraste para estimar concentrações de PM10 ao nível do solo. Estes resultados sustentam a hipótese de que uma metodologia multivariada para extracção de DOA por detecção remota é um complemento válido a outros produtos de aerossóis derivados por imagens de satélite, actualmente utilizados para avaliar a concentração de material particulado ao nível do solo.
CONTENT
CHAPTER 1 - INTRODUCTION ... 18
1.1SCOPE AND OBJECTIVES ... 18
1.2METHODOLOGY AND CASE STUDIES OVERVIEW ... 24
1.3THESIS STRUCTURE OVERVIEW ... 27
CHAPTER 2 - LITERATURE REVIEW ... 31
2.1AEROSOL/PARTICULATE MATTER ... 31
2.1.1 Sources and classification ... 31
2.1.2 Global distribution and seasonality ... 34
2.1.3 Effects on human health ... 37
2.1.4 PM air quality guidelines and legislation ... 42
2.1.5 Aerosol/PM10 related Air Quality in Portugal ... 50
2.1.6 PM Air Quality in the North and South Lisbon Metropolitan Areas... 57
2.2AEROSOL REMOTE SENSING OVER LAND AND PMAIR QUALITY ... 70
2.2.1 Aerosol Optical Thickness ... 70
2.2.2 The Contrast Reduction Algorithm ... 72
2.2.3 Aerosol Remote sensing based PM ground concentration estimation ... 76
CHAPTER 3 - DESIGN, IMPLEMENTATION AND EVALUATION OF A NEW CONTRAST-REDUCTION AOT RETRIEVAL ALGORITHM DEVELOPED FOR MODIS ... 85
3.1INTRODUCTION ... 85
3.2DATA AND METHODS ... 86
3.2.1 Ground and satellite data ... 86
3.3METHODOLOGY ... 90
3.3.1 Selection of observation geometry clusters ... 91
3.3.2 Selection of the DTA optimal window size and spatial resolution ... 92
3.3.3 Site land cover influence in algorithm accuracy ... 94
3.4RESULTS AND DISCUSSION ... 94
3.4.1 Selection of the DTA optimal window size and spatial resolution ... 94
3.4.2 Site Land Cover influence in algorithm accuracy ... 98
3.4.3 Observation geometry ... 105
3.5CONCLUSIONS ... 108
3.5.1 Selection of the DTA optimal window size and spatial resolution ... 109
3.5.2 Site Land Cover influence in algorithm accuracy ... 109
3.5.3 Observation geometry ... 110
3.5.4 General conclusions ... 111
CHAPTER 4 - ESTIMATION OF PM10 CONCENTRATIONS THROUGH AOT-BASED REGRESSION MODELS ... 113
4.2DATA AND METHODS ... 116
4.2.1 Ground and satellite data ... 116
4.2.2 Dataset collection and pre-processing ... 121
4.2.3 Regression model related methodologies ... 125
4.3RESULTS AND DISCUSSION ... 126
4.3.1 Characterization of the PM10 and AOT datasets ... 126
4.3.2 PM10/AOT correlation ... 135
4.3.3 Characterization of the meteorological datasets and their relationships with PM10 and AOT ... 145
4.3.4 Regression model for daily average PM10 concentration estimation based on AOT values ... 158
4.3.5 Multi regression model for PM10 daily average concentration estimation based on AOT and selected meteorological variables ... 164
4.3.6 Multi regression model for PM10 spatial daily average concentration estimation based on AOT and selected meteorological variables ... 169
4.4CONCLUSIONS ... 173
4.4.1 Characterization of the PM10 and AOT datasets ... 173
4.4.2 PM10/AOT correlation ... 174
4.4.3 Characterization of the meteorological datasets and their relationships with PM10 and AOT ... 176
4.4.4 Linear regression models for PM10 estimation using AOT and meteorological variables ... 178
CHAPTER 5 - CONCLUSIONS ... 181
FIGURE 1.1–ADVANTAGES AND POTENTIAL APPLICATIONS OF SATELLITE REMOTE SENSING IN THE FIELD OF AIR POLLUTION.ADAPTED FROM VEEFKIND ET AL.,2007. ... 21 FIGURE 1.2–OVERALL THESIS METHODOLOGY SCHEME ... 27 FIGURE 2.1-PRINCIPAL MODES, SOURCES, AND PARTICLE FORMATION AND REMOVAL MECHANISMS.SOURCE:
WHITBY AND CANTRELL,1976 ... 33 FIGURE 2.2–AEROSOL OPTICAL THICKNESS MISR DERIVED PRODUCTS SHOWING ANNUAL AEROSOL GLOBAL
DISTRIBUTION AND SEASONALITY, DURING THE DECEMBER 2001 THROUGH NOVEMBER 2002 TIME PERIOD. SOURCE: HTTP:// HTTP://EARTHOBSERVATORY.NASA.GOV. ... 36
FIGURE 2.3–RELATIVE MORTATILITY RISK ESTIMATES ASSOCIATED WITH AN 10ΜG/M3 INCREASE IN PM10,
PM2.5, BLACK SMOKE (BS) AND OZONE.SOURCE:WHOET AL.,2004 ... 38
FIGURE 2.4–MAIN PM RELATED HEALTH EFFECTS AND PHYSIOLOGICAL PATHWAYS.SOURCE:POPE AND DOCKERY, 2006. ... 39 FIGURE 2.5-DEPOSITION PROBABILITY OF INHALED PARTICLES IN THE RESPIRATORY TRACT ACCORDING TO
PARTICLE SIZE.SOURCE:WHO,2004 ... 40
FIGURE 2.6–MAIN AIR QUALITY EUROPEAN LEGISLATION.ADAPTED FROM FERREIRA ET AL.,2009B ... 44 FIGURE 2.7–AIR QUALITY INDEX RESULTS FOR ALL DEFINED ZONES/AGGLOMERATIONS IN THE CONTINENTAL
PORTUGUESE TERRITORY, FOR THE YEAR 2010.SOURCE:APA,2011.THE REFERRED
ZONES/AGGLOMERATIONS WERE DEFINED IN AGREEMENT WITH CRITERIA CONCERNING HOMOGENEITY IN THE
MEASURED AIR QUALITY LEVELS, TOTAL POPULATION OR POPULATION DENSITY (DECREE LAW 276/99). ... 50 FIGURE 2.8–(A)DELIMITATION OF ALL AIR QUALITY ZONES/AGGLOMERATIONS FOR THE PORTUGUESE
CONTINENTAL TERRITORY;(B)LOCATION OF ALL PORTUGUESE TRAFFIC, BACKGROUND AND INDUSTRIAL AIR
QUALITY STATIONS ... 51
FIGURE 2.9-NUMBER OF DAYS IN URBAN OR RURAL SITES WITH “BAD”PM10 AIR QUALITY INDEX BETWEEN 2001 AND 2008 IN PORTUGAL.SOURCE (EEA,2010). ... 53
FIGURE 2.10–AVERAGE ANNUAL PM10 CONCENTRATIONS FOR RURAL, URBAN AND SITES BETWEEN 2001 AND
2008.SOURCE (EEA,2010). ... 53 FIGURE 2.11–MAPS SHOWING THE PORTUGUESE ZONES/AGGLOMERATION WITH MORE THAN 35 DAYS OVER THE
HTTP://WWW.EEA.EUROPA.EU/DATA-AND-MAPS/FIGURES/PARTICULATE-MATTER-PM10-2007-ANNUAL
-LIMIT-VALUE-FOR-THE-PROTECTION-OF-HUMAN-HEALTH-3 ... 54 FIGURE 2.12–MAP OF THE NORTH AND SOUTH LISBON METROPOLITAN AREAS ... 58
FIGURE 2.13–(A)PM10 EMISSIONS PER AREA FOR EACH MUNICIPALITY IN THE LISBON AND TAGUS VALLEY REGION. SOURCE:GÓIS ET AL.,2005;(B)PM10 EMISSIONS PER AREA FOR A 2X2 KM GRID COVERING THE LISBON AND
TAGUS VALLEY REGION.SOURCE:FERREIRA ET AL.,2006A. ... 60 FIGURE 2.14-PM10 URBAN BACKGROUND AVERAGE DAILY CONCENTRATIONS SPATIAL DISTRIBUTION PATTERNS
BASED ON A GROUND MEASUREMENT CAMPAIGN PERFORMED IN FEBRUARY 2004.SOURCE:TENTE ET AL., 2005. ... 62 FIGURE 2.15–LOCATION OF ALL CURRENT AIR QUALITY STATIONS FOR THE AMLN AND AMLS, INCLUDING
INFORMATION ON STATION TYPE.2005PM STATIONS ARE MARKED IN BLUE AND LABELLED WITH THE
RESPECTIVE STATION NAMES ... 65 FIGURE 2.16–EXAMPLE OF THE AVERAGE PM10 HOURLY PROFILES FOR THE 2005-2010 PERIOD FOR AN URBAN
BACKGROUND STATION (OLIVAIS) AND AN URBAN TRAFFIC STATION (AVENIDA DA LIBERDADE).SOURCE: FERREIRA ET AL.,2006B ... 66
FIGURE 2.17–BOX PLOT GRAPHS SHOWING THE VARIATION OF THE MONTHLY MEAN PM10 DAILY CONCENTRATION CONSIDERING A PERIOD BETWEEN 2001 AND 2010 FOR:(A) AN URBAN TRAFFIC STATION (AVENIDA DA
LIBERDADE) AND;(B) AN URBAN BACKGROUND STATION (OLIVAIS).THE HIGHER AND LOWER BOUND OF EACH BOX REPRESENT THE 25TH AND 75TH PERCENTILE AND THE CENTRAL VALUE IS THE 50TH PERCENTILE
(MEDIAN).OUTLIER VALUES HIGHER THAN 80ΜG/M3 ARE NOT PRESENTED TO PROVIDE A BETTER
VISUALIZATION OF THE SEASONAL CYCLE.ORIGINAL PM10 CONCENTRATION DATA DOWNLOADED FROM
HTTP://WWW.QUALAR.ORG. ... 67 FIGURE 2.18–EVOLUTION OF ALL IQAR AIR QUALITY INDEX CLASSES FOR A PERIOD BETWEEN 2001 AND 2010,
CONSIDERING ONLY STATIONS FROM:(A)AMLN;(B)AMLS ... 68 FIGURE 2.19–ANNUAL AVERAGE PM10 CONCENTRATIONS FOR ALL 2005PM10 MEASURING STATIONS DURING THE
PERIOD BETWEEN 2001 AND 2010.DASHED LINE MARKS THE CURRENT LIMIT VALUE FOR PM10 ANNUAL
AVERAGE CONCENTRATION, AS DEFINED IN DL111/2002 ... 69 FIGURE 2.20–NUMBER OF PM10 DAILY CONCENTRATION EXCEEDANCE DAYS FOR ALL 2005PM10 MEASURING
STATIONS DURING THE PERIOD BETWEEN 2001 AND 2010.DASHED LINE MARKS THE MAXIMUM NUMBER OF
EXCEEDANCE DAYS PER YEAR, PERMITTED IN DL111/2002(35). ... 69
FIGURE 3.1–CONTRAST REDUCTION ALGORITHM PROCESSING STEPS ... 90 FIGURE 3.2–DEFINITION OF THE PIXEL WINDOW USED FOR DTAAOT CALCULATIONS. ... 91
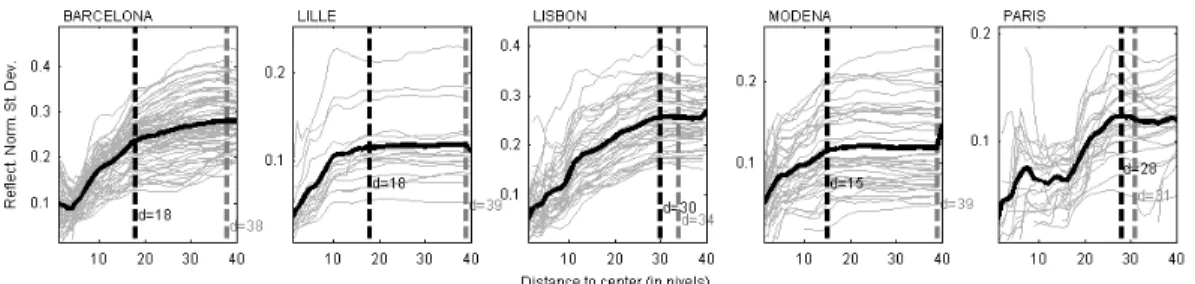
FIGURE 3.3-STRUCTURE FUNCTION FOR ALL SITES: VARIATION OF THE STANDARD DEVIATION OF THE PIXEL REFLECTANCE FOR EACH WINDOW SIZE.THE CHOSEN DISTANCE IS GIVEN BY THE BLACK DASHED LINE,
WHEREAS THE GREY LINE REPRESENTS THE WINDOW SIZE SELECTED USING THE ALTERNATIVE METHOD.THE
MEAN STRUCTURE FUNCTION IS REPRESENTED BY THE THICKER BLACK LINE. ... 95
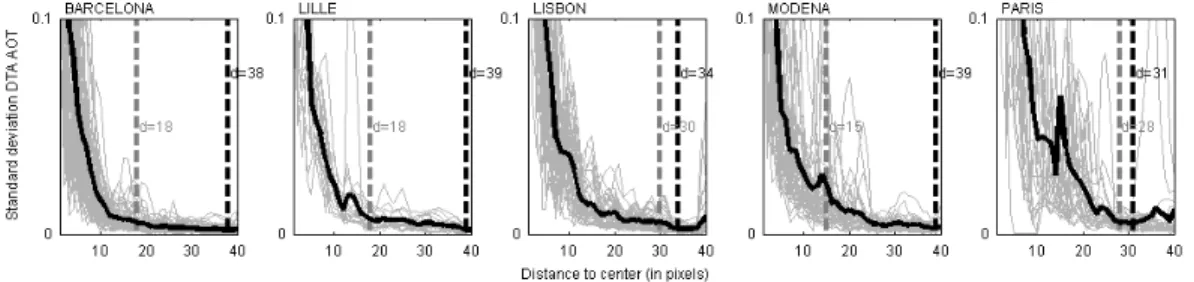
FIGURE 3.4-STANDARD DEVIATION OF AOT ESTIMATES FOR THE STATION LOCATION AND ITS NEIGHBOUR PIXELS AS A FUNCTION OF WINDOW SIZE.THE CHOSEN DISTANCE IS GIVEN BY THE BLACK DASHED LINE WHERE AS THE
GREY LINE REPRESENTS THE WINDOW SIZE SELECTED USING THE ALTERNATIVE METHOD.THE MEAN AOT
STANDARD DEVIATION CURVE IS REPRESENTED BY THE THICKER BLACK LINE. ... 96
FIGURE 3.5-VARIATION OF THE NRMSE AND R WITH WINDOW SIZE: FOR EACH SITE (IDENTIFIED IN THE TITLE OF EACH SUBPLOT) AND CONSIDERING ALL SITES TOGETHER (LAST GRAPH).BLACK DASHED LINES DEFINE THE
WINDOW SIZE INTERVAL GIVEN BY THE TWO METHODS AND GREY SOLID LINES THE TWO METHODS AND GREY
FIGURE 3.6–SCATTER POT BETWEEN AERONET MEASUREMENTS AND DTA ALGORITHM ESTIMATES FOR DATASET C) CONSIDERING ALL SITES AND A 39-BY39 WINDOW SIZE.CALCULATED PARAMETERS ARE: R – CORRELATION
COEFFICIENT; SLOPE – CORRELATION SLOPE; YORIGIN – CORRELATION ORIGIN IN THE Y-AXIS; NOBS – NUMBER
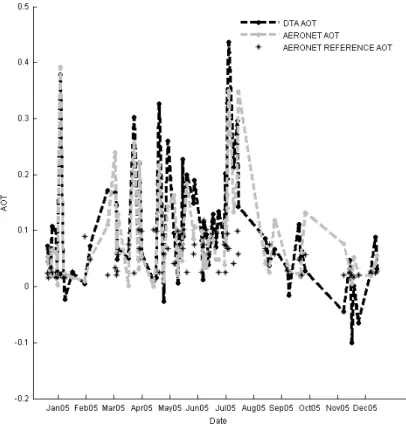
OF OBSERVATIONS. ... 101 FIGURE 3.7-TIME SERIES PLOT OF AERONETAOT(BLACK DASHED LINE) AND DTAAOT(GREY DASHED LINE)
FOR THE BARCELONA STATION.REFERENCE AOT VALUE FOR EACH POLLUTED IMAGE IS ALSO GIVEN (BLACK
ASTERISK MARKERS). ... 103
FIGURE 3.8-ABSOLUTE ERROR BOX PLOT AS A FUNCTION OF 60 DAYS CLUSTERS OF THE DATE DIFFERENCE BETWEEN THE POLLUTED AND REFERENCE IMAGES. ... 104
FIGURE 3.9–SCATTER PLOT BETWEEN AERONET MEASUREMENTS AND:DTA ALGORITHM RESULTS (LEFT GRAPH);MODIS AEROSOL STANDARD PRODUCT AOT(RIGHT GRAPH).CALCULATED PARAMETERS ARE: AE –
AVERAGE ERROR; NRMSE – NORMALISED ROOT MEAN SQUARE ERROR; R – CORRELATION COEFFICIENT; SLOPE
– CORRELATION SLOPE; YORIGIN – CORRELATION ORIGIN IN THE Y-AXIS; NOBS – NUMBER OF OBSERVATIONS.
... 105 FIGURE 3.10-CORRELATION BETWEEN DTA AND AERONETAOT VALUES AND RESPECTIVE ERROR PLOTS AS A
FUNCTION OF THE DEFINED SENSOR ZENITH ANGLE CLUSTERS BEFORE (TOP ROW) AND AFTER (BOTTOM ROW)
APPLYING THE COSINE OF SENSOR ZENITH ANGLE TERM. ... 106
FIGURE 3.11-DTAAOT ERROR PLOTS ACCORDING TO THE DIFFERENT SENSOR ZENITH, SOLAR ZENITH AND RELATIVE AZIMUTH ABSOLUTE ANGLES CLUSTERS (LEFT COLUMN) AND ANGLE DIFFERENCES (POLLUTED
MINUS REFERENCE, RIGHT COLUMN) ... 107 FIGURE 3.12–SCATTER PLOT BETWEEN AERONET MEASUREMENTS AND DTA ALGORITHM ESTIMATES FOR
SENSOR ZENITH ANGLE DIFFERENCES LOWER THAN 3º.CALCULATED PARAMETERS ARE: AE – AVERAGE ERROR;
NRMSE – NORMALISED ROOT MEAN SQUARE ERROR; R – CORRELATION COEFFICIENT; SLOPE – CORRELATION
SLOPE; YORIGIN – CORRELATION ORIGIN IN THE Y-AXIS; NOBS – NUMBER OF OBSERVATIONS. ... 108 FIGURE 4.1–LOCATION OF THE LISBON METROPOLITAN AREA PM10 AIR QUALITY STATIONS NETWORK IN 2005
AND THE GAGO COUTINHO METEOROLOGICAL STATION. ... 117 FIGURE 4.2–RGB EXAMPLE OF MOD02QKM PRODUCT TAKEN FROM THE LADSWEB SERVICE ... 120
FIGURE 4.3–CORINE2000 LAND COVER PRODUCT FOR THE LISBON METROPOLITAN AREA ... 121 FIGURE 4.4-PM10 DAILY MEAN CONCENTRATIONS FOR THE YEAR 2005, CONSIDERING ALL STATIONS FROM LISBON
METROPOLITAN AREA (BLACK LINE).RED AND GREEN DOTS REFER TO THE MEAN PM10 CONCENTRATIONS FOR THE DAY AND HOUR OF PASSAGE FOR ALL AVAILABLE REFERENCE AND POLLUTED MODIS IMAGES,
RESPECTIVELY.BLUE DOTS REFER TO THE PM10 CONCENTRATION DIFFERENCE BETWEEN THE POLLUTED AND
REFERENCE ... 127
FIGURE 4.5-PM10 DAILY CONCENTRATION GROUPED ACCORDING TO WEEKDAY ... 130
FIGURE 4.6-PM10 CONCENTRATIONS RANGE FOR ALL AVAILABLE POLLUTED (TOP RIGHT) AND REFERENCE (TOP LEFT)MODIS IMAGES, THE DIFFERENCE BETWEEN THE TWO (BOTTOM LEFT) AND THE RESPECTIVE
HISTOGRAMS (BOTTOM RIGHT: POLLUTED – TOP; REFERENCE – MIDDLE; DIFFERENCE – BOTTOM) ... 131
FIGURE 4.7–TOP:DTAAOT TIME SERIES (TOP);BOTTOM:DTAAOT BOX PLOT (LEFT) AND STATION DTAAOT
HISTOGRAM (RIGHT) ... 133
FIGURE 4.8-AOT/PM10DAILY AVERAGE SCATTER PLOT PER SEASON, INCLUDING INFORMATION ON CORRELATION COEFFICIENT (R) AND SLOPE.RIGHT GRAPHS REFER TO RESULTS USING THE ENTIRE DATASET, LEFT GRAPHS IS
USING ONLY PAIRS OF REFERENCE/POLLUTED IMAGES FROM THE SAME SEASON.SOLID LINES CORRESPOND TO
FIGURE 4.9–AOT/PM10 DAILY AVERAGE SCATTER PLOT PER STATION TYPE, INCLUDING INFORMATION ON CORRELATION COEFFICIENT (R) AND SLOPE.RIGHT GRAPHS REFER TO RESULTS USING THE ENTIRE DATASET,
LEFT GRAPHS IS USING ONLY PAIRS OF REFERENCE/POLLUTED IMAGES FROM THE SAME SEASON.SOLID LINES
CORRESPOND TO THE X AND Y AXIS AND DOTTED LINE TO THE REGRESSION LINE. ... 141 FIGURE 4.10–AIR QUALITY NETWORK MAPS SHOWING, FROM TOP TO BOTTOM, THE MEAN PM10, THE MEAN AOT.
LEFT COLUMN REFERS TO THE FULL DATASET AND RIGHT TO THE DATASET ONLY WITH
POLLUTED/REFERENCE IMAGE PAIRS FROM THE SAME SEASON ... 143
FIGURE 4.11–AIR QUALITY NETWORK MAPS SHOWING, FROM TOP TO BOTTOM, THE CORRELATION COEFFICIENT AND REGRESSION SLOPE BETWEEN AOT AND PM10 DAILY AVERAGE CONCENTRATION PER STATION.LEFT
COLUMN REFERS TO THE FULL DATASET AND RIGHT TO THE DATASET ONLY WITH POLLUTED/REFERENCE
IMAGE PAIRS FROM THE SAME SEASON ... 144
FIGURE 4.12-AOT/PM10 MEAN DAILY AVERAGE SCATTER PLOT, INCLUDING INFORMATION ON CORRELATION COEFFICIENT (R), SLOPE (SLOPE).RIGHT GRAPHS REFER TO RESULTS USING THE ENTIRE DATASET, LEFT
GRAPHS IS USING ONLY PAIRS OF REFERENCE/POLLUTED IMAGES FROM THE SAME SEASON.SOLID LINES
CORRESPOND TO THE X AND Y AXIS AND DOTTED LINE TO THE REGRESSION LINE. ... 145
FIGURE 4.13–(A)LEFT SIDE -DAILY AND MONTHLY MEAN ATMOSPHERIC PRESSURE AT STATION LEVEL TIME
SERIES AND RESPECTIVE DAILY HISTOGRAM (FROM TOP TO BOTTOM);(B)RIGHT SIDE:SCATTER PLOT RELATING MEAN ATMOSPHERIC PRESSURE AT STATION LEVEL WITH DAILY AVERAGE PM10 CONCENTRATION
FOR ALL DAYS OF THE YEAR, ALL POLLUTED IMAGES, DAILY PM10 CONCENTRATION DIFFERENCES AND DAILY
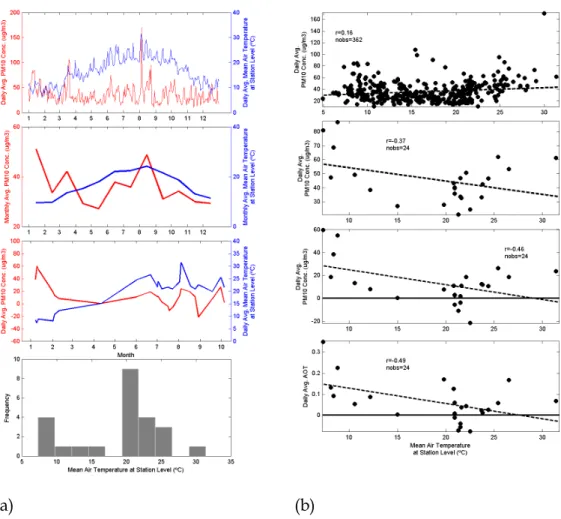
AOT. ... 147 FIGURE 4.14–(A)RIGHT SIDE:DAILY AND MONTHLY AVERAGE MEAN AIR TEMPERATURE AT STATION LEVEL TIME
SERIES AND RESPECTIVE DAILY HISTOGRAM (FROM TOP TO BOTTOM);(B)LEFT SIDE:SCATTER PLOT RELATING DAILY AVERAGE MEAN AIR TEMPERATURE AT STATION LEVEL WITH DAILY AVERAGE PM10
CONCENTRATION FOR ALL DAYS OF THE YEAR, ALL POLLUTED IMAGES, DAILY PM10 CONCENTRATION
DIFFERENCES AND DAILY AOT(FROM TOP TO BOTTOM). ... 149
FIGURE 4.15–(A)LEFT SIDE:DAILY AND MONTHLY AVERAGE WIND SPEED TIME SERIES AND RESPECTIVE DAILY HISTOGRAM (FROM TOP TO BOTTOM) FOR THE YEAR 2005;(B)RIGHT SIDE:SCATTER PLOTS RELATING DAILY
AVERAGE MEAN AIR TEMPERATURE WITH DAILY AVERAGE PM10 CONCENTRATION FOR ALL DAYS OF THE
YEAR, ALL POLLUTED IMAGES, CONCENTRATION DIFFERENCES (POLLUTED –REFERENCE) AND DAILY AOT
(FROM TOP TO BOTTOM) FOR THE YEAR 2005. ... 151 FIGURE 4.16–(A)LEFT SIDE:DAILY AND MONTHLY AVERAGE RELATIVE HUMITIDY TIME SERIES AND RESPECTIVE
DAILY HISTOGRAM (FROM TOP TO BOTTOM);(B)RIGHT SIDE:SCATTER PLOT RELATING DAILY AVERAGE
RELATIVE HUMITIDY WITH DAILY AVERAGE PM10 CONCENTRATION FOR ALL DAYS OF THE YEAR, ALL POLLUTED IMAGES, DAILY PM10 CONCENTRATION DIFFERENCES AND DAILY AOT(FROM TOP TO BOTTOM).
... 153 FIGURE 4.17–(A)LEFT SIDE:DAILY AND MONTHLY AVERAGE MIXING LAYER HEIGHT TIME SERIES AND
RESPECTIVE DAILY HISTOGRAM (FROM TOP TO BOTTOM);(B)RIGHT SIDE:SCATTER PLOT RELATING DAILY
AVERAGE MIXING LAYER HEIGHT WITH DAILY AVERAGE PM10 CONCENTRATION FOR ALL DAYS OF THE YEAR,
ALL POLLUTED IMAGES, DAILY PM10 CONCENTRATION DIFFERENCES AND DAILY AOT(FROM TOP TO
BOTTOM). ... 155 FIGURE 4.18–SCATTER PLOT OF MEASURED AGAINST ESTIMATED DAILY AVERAGE PM10 CONCENTRATION
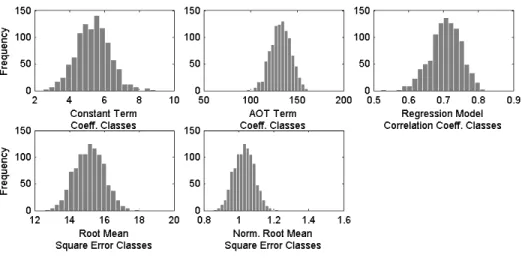
DIFFERENCES FOR MODEL A ... 160 FIGURE 4.19–HISTOGRAMS FOR ALL BOOTSTRAP DERIVED MULTILINEAR REGRESSION COEFFICIENTS AND
FIGURE 4.20–MODEL A STANDARDIZED RESIDUALS PLOTTED AGAINST THE ESTIMATED PM10 DAILY AVERAGE CONCENTRATIONS DIFFERENCES (TOP GRAPH),AOT AND ALL CONSIDERED METEOROLOGICAL VARIABLES.162 FIGURE 4.21-SCATTER PLOT OF MEASURED AGAINST ESTIMATED DAILY AVERAGE PM10 CONCENTRATION
DIFFERENCES FOR MODEL B. ... 166 FIGURE 4.22-HISTOGRAMS FOR ALL BOOTSTRAP DERIVED MULTILINEAR REGRESSION COEFFICIENTS AND
CORRELATION AND ERROR STATISTICS FOR MODEL B. ... 167 FIGURE 4.23-MODEL B STANDARDIZED RESIDUALS PLOTTED AGAINST THE ESTIMATED PM10 DAILY AVERAGE
CONCENTRATIONS DIFFERENCES (TOP GRAPH),AOT AND ALL CONSIDERED METEOROLOGICAL VARIABLES.168 FIGURE 4.24-SCATTER PLOT OF MEASURED AGAINST ESTIMATED DAILY AVERAGE PM10 CONCENTRATION
DIFFERENCES FOR MODEL C. ... 171 FIGURE 4.25-HISTOGRAMS FOR ALL BOOTSTRAP DERIVED MULTILINEAR REGRESSION COEFFICIENTS AND
CORRELATION AND ERROR STATISTICS FOR MODEL C. ... 172 FIGURE 4.26-MODEL C STANDARDIZED RESIDUALS PLOTTED AGAINST THE ESTIMATED PM10 DAILY AVERAGE
TABLE 2.1–COARSE AND FINE AEROSOL SOURCES AND RESPECTIVE CHEMICAL COMPOSITION SOURCE:TENTE,2005 ... 34 TABLE 2.2-IMPORTANT HEALTH EFFECTS ASSOCIATED WITH EXPOSURE TO PM.SOURCE:WHO,2006 ... 42 TABLE 2.3–LIMIT AND ASSEMENT THRESHOLD VALUES FOR PM10 AND PM2.5 DEFINED IN THE CAFE DIRECTIVE.
ADAPTED FROM BRÁS,2012 ... 45 TABLE 2.4–STATION CLASSIFICATION CRITERIA, ACCORDING TO AREA OF INFLUENCE.ADAPTED FROM GARBER ET
AL.(2002) ... 46 TABLE 2.5-STATION CLASSIFICATION CRITERIA, ACCORDING TO POLLUTION SOURCE INFLUENCE.ADAPTED FROM
GARBER ET AL.(2002) ... 46 TABLE 2.6–MAIN MONITORING OBJECTIVES FOR EACH STATION CLASS.ADAPTED FROM BRÁS,2012 AND
DIRECTIVE 2008/50/EC(THE LATTER WAS USED TO ADD INFORMATION ABOUT STATION SPATIAL
REPRESENTATIVENESS FOR SOME CLASSES). ... 47
TABLE 2.7–TYPICAL RANGES OF THE AREA OF REPRESENTATIVENESS (RADIUS OF AREA) FOR VARIOUS STATION CLASSES AND RECOMMENDED AREA VALUES FOR AIR QUALITY NETWORK DESIGN.SOURCE:EEA,1999. ... 48
TABLE 2.8-AREA OF REPRESENTATIVENESS FOR PM10 MONITORING DATA FOR THE SPECIFIED STATION
CLASSIFICATION AND AVERAGING PERIODS.SOURCE:BALAGUER AND DENBY,2011 ... 49
TABLE 2.9–NORTH AND SOUTH AML MUNICIPALITIES AND RESPECTIVE AREA AND POPULATION (INE,2001) .... 59 TABLE 2.10–AMLN AND AMLS AIR QUALITY STATIONS NAME, ZONE OF INFLUENCE, STATION TYPE, MAIN
POLLUTANTS MEASURED AND STARTING DATE. ... 64 TABLE 3.1-DESCRIPTION OF THE AERONET STATIONS USED IN THIS STUDY ... 88
TABLE 3.2-DESCRIPTION OF MODIS MAIN AND AUXILIARY DATASETS ... 89 TABLE 3.3-TOTAL NUMBER OF REFERENCE IMAGES AND CORRESPONDING RANGE AND MEAN AERONETAOT
(675 NM) PER SITE AND FOR ALL SITES ... 92 TABLE 3.4-CORRELATION PARAMETERS FOR THREE SETS OF RESULTS: SITE SPECIFIC WINDOW SIZE ACCORDING TO
THE ASSESSMENT GIVEN BY THE FIRST (1) AND SECOND (2) METHODS, RESPECTIVELY; A 39 PIXEL DISTANCE
COMMON WINDOW SIZE (3) ... 98
TABLE 3.5- R,NRMSE, AVERAGE PIXEL PERCENTAGE RELATIVE TO THE NUMBER OF PIXELS INSIDE THE 39 PIXEL DISTANCE WINDOW AND NUMBER OF ESTIMATED VALUES (N) FOR ALL SITES, PER SITE GROUP (URBAN –
CONSTRUCTED DATASETS WHICH INCLUDED: A) VEGETATION PIXELS (AGRICULTURE AND FOREST); B)
VEGETATION AND URBAN PIXELS; C) FOREST AND URBAN PIXELS; D) URBAN PIXELS. ... 98 TABLE 3.6-NUMBER OF POLLUTED IMAGES (N),RMSE,NRMSE, MEAN AERONETAOT AND MEAN DTAAOT
PER SITE AND FOR ALL SITES CONSIDERING ALL VALUES AND IMPOSING TWO SEPARATE CONSTRAINTS
(RETRIEVED AOT VALUES >0 AND AERONETAOT VALUES >0.05, BRACKETED VALUES) ... 102
TABLE 4.1–DESCRIPTION OF THE 2005PM10 MEASURING STATIONS FROM THE LISBON METROPOLITAN AREA AIR QUALITY NETWORK (ADAPTED FROM WWW.QUALAR.ORG) ... 118
TABLE 4.2–MAIN CHARACTERISTICS OF THE GAGO COUTINHO METEOROLOGICAL STATION ... 119 TABLE 4.3–POLLUTED AND REFERENCE MODIS IMAGE DATES USED IN DTAAOT CALCULATIONS ... 124
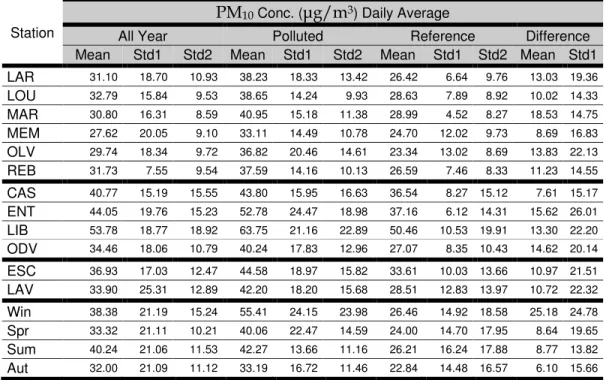
TABLE 4.4-PM10CONC.(ΜG/M3) MEAN DAILY AVERAGE (MEAN), STANDARD DEVIATION (STD1) AND MEAN
INTRA-DAILY STANDARD DEVIATION (STD2) FOR ALL DAYS OF THE YEAR AND FOR ALL POLLUTED, REFERENCE
AND RESPECTIVE DIFFERENCE PER STATION AND SEASON (WIN –WINTER;SPR –SPRING;SUM –SUMMER; AUT –AUTUMN).THICKER LINES SEPARATE BACKGROUND, TRAFFIC AND INDUSTRIAL STATIONS (IN THIS ORDER).FOR THE REFERENCE COLUMN, SEASON DOES NOT REFER TO ITS OWN DATE BUT TO DATE OF
CORRESPONDING POLLUTED IMAGE ... 128
TABLE 4.5–MODISDTAAOT MEAN AND STANDARD DEVIATION PER STATION AND SEASON ... 134 TABLE 4.6-CORRELATION COEFFICIENTS (R) AND RESPECTIVE NUMBER OF OBSERVATIONS (N) BETWEEN
DIFFERENT TEMPORALLY AVERAGED PM10 CONCENTRATIONS AND DTAAOT CONSIDERING ALL STATIONS,
PER STATION TYPE GROUP (BACKGROUND,TRAFFIC AND INDUSTRIAL), PER SEASON AND DTAAOT DAILY
AVERAGE.THE FIRST LINE FOR EACH GROUP CORRESPONDS TO THE VALUES OBTAINED USING THE ENTIRE
DATASET, WHILE THE SECOND IS USING ONLY PAIRS OF REFERENCE/POLLUTED IMAGES FROM THE SAME
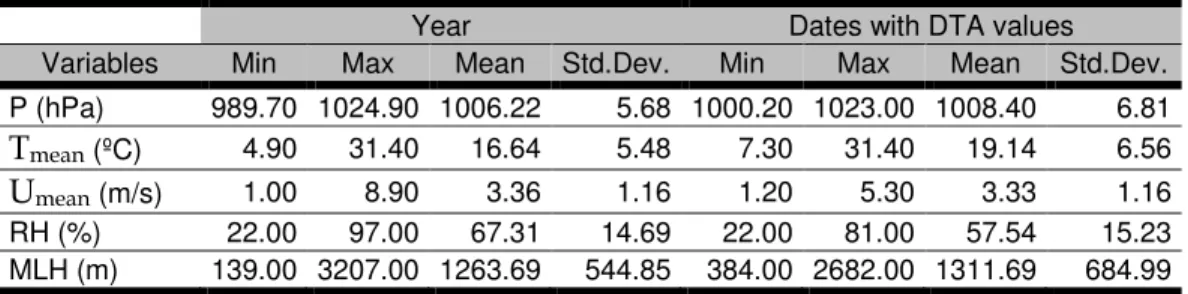
SEASON ... 137 TABLE 4.7–MAIN STATISTICS (MINIMUM MIN; MAXIMUM –MAX; MEAN –MEAN AND STANDARD DEVIATION –STD.
DEV.) CALCULATED FOR ALL METEOROLOGICAL VARIABLES CONSIDERING THE FULL YEARLY DATASET AND ONLY THE DATES WITH DTAAOT ESTIMATES ... 146
TABLE 4.8–CORRELATION MATRIX FOR ALL INDEPENDENT VARIABLES (DAILY VALUES: UPPER PART, FOR DAYS WITH AOT VALUES AND LOWER PART FOR ALL DAYS OF THE YEAR, IDENTIFIED BY A BOLD FONT) ... 157 TABLE 4.9–MODEL PARAMETERS OBTAINED FOR MODEL A AND RESPECTIVE 2.5TH AND 97.5TH PERCENTILE
CONFIDENCE INTERVALS OBTAINED USING A BOOTSTRAPPING TECHNIQUE. ... 159 TABLE 4.10–MODEL ARMSE AND NRMSE CONFIDENCE INTERVALS FOR ALL LISBON METROPOLITAN AREA AIR
QUALITY STATIONS ... 164 TABLE 4.11–NUMBER OF TIMES THE STEPWISE FIT PROCEDURE SELECTED EACH VARIABLE INTO THE
MULTIREGRESSION LINEAR MODEL USING THE BOOTSTRAPPED DATASETS ... 165 TABLE 4.12-MODEL PARAMETERS OBTAINED FOR MODEL B AND RESPECTIVE 2.5TH AND 97.5TH PERCENTILE
CONFIDENCE INTERVALS OBTAINED USING A BOOTSTRAPPING TECHNIQUE. ... 165 TABLE 4.13-MODEL BRMSE AND NRMSE CONFIDENCE INTERVALS FOR ALL LISBON METROPOLITAN AREA AIR
QUALITY STATIONS ... 169 TABLE 4.14-NUMBER OF TIMES THE STEPWISE FIT PROCEDURE SELECTED EACH VARIABLE INTO THE
MULTIREGRESSION LINEAR MODEL USING THE BOOTSTRAPPED DATASETS ... 170 TABLE 4.15-MODEL PARAMETERS OBTAINED FOR MODEL C AND RESPECTIVE 2.5TH AND 97.5TH PERCENTILE
ACS ; American Cancer Society
AERONET ; Aerosol Robotic Network AML – Lisbon Metropolitan Area
AMLN – North Lisbon Metropolitan Area AMLS – South Lisbon Metropolitan Area ANOVA ; Analysis of Variance
AOD – Aerosol Optical Depth AOD – Aerosol Optical Depth AOT – Aerosol Optical Thickness
APA – Agência Portuguesa do Ambiente (Portuguese Environmental Agency)
ASTER ; Advanced Spaceborne Thermal Emission and Reflection Radi; ometer
AVHRR ; Advanced Very High Resolution Radiometer BRDF ; Reflectance Distribution Function
CAFE – Clean Air For Europe
CART ; Classification And Regression Trees CAS ; Cascais
CCDR;LVT ; Comissão de Coordenação e Desenvolvimento Regional da Região de Lisboa e Vale do Tejo (Regional Development and Coordinating Commission of Lisbon and the Tagus Valley)
CHRIS ; Compact High Resolution Imaging Spectrometer CORINE ; Coordination of Information on the Environment DDV ; Dark Dense Vegetation
DL – Decree;Law
DTA – Differential Texture Analysis EC – European Commission
EEA – European Environment Agency ENT ; Entrecampos
EO – Earth Observation
EPA ; Environmental Protection Agency ESC ; Escavadeira
EU ; European Union
FAIRMODE ; Forum for air quality modelling in Europe GIS ; Geographic Information System
GOES ; Geostationary Operational Environmental Satellite GOES ; Goddard Earth Observing System
GPL ; Gás de petróleo Liquefeito (Liquefied Petroleum Gas) HDF;EOS ; Hierarchical Data Format ; Earth Observing System HEG ; HDF;EOS to GeoTIFF Conversion Tool
HPA – Hazardous Air Pollutants
INE – Instituto Nacional de Estatística (Portuguese National Statistics Institute)
IPCC ; Intergovernmental Panel on Climate Change
IQAr – Índice de Qualidade do Ar (Portuguese Air Quality Index) ISO ; International Standard Organization
JJA ; June;July;August
LAADSWEB ; Level 1 and Atmosphere Archive and Distribution System LAR ; Laranjeiro
LAV ; Lavradio
LIB – Avenida da Liberdade
LIDAR ; Light Detection And Ranging sensor LOU ; Loures
LVT – Lisboa e Vale do Tejo (Lisbon and Tagus Valley) MAM ; March;April;May
MAR ; Quinta do Marquês
MATLAB ; Matrix Laboratory software MEM ; Mem;Martins
MERIS ; Medium Resolution Imaging Spectrometer MISR ; Multi;angle Imaging Spectroradiometer MLH ; Mixing Layer Height
MODIS ; Moderate Resolution Imaging Spectroradiometer MSG ; METEOSAT Second Generation
NAAQS ; National Ambient Air Quality Standards NN ; neural network
NO2 ; Nitrogen dioxide
ODV ; Odivelas OLV ; Olivais
PBL ; Planetary Boundary Layer PM – Particulate Matter
PM10 ; Particles which pass through a size;selective inlet with a 50 % effi; ciency cut;off at 10 Zm aerodynamic diameter (ISO 7708:1995)
PM2.5 ; Particles which pass through a size;selective inlet with a 50 % effi; ciency cut;off at 2,5 Zm aerodynamic diameter (ISO 7708:1995)
Pmean ; Mean Atmospheric Pressure at station level (hPa)
POLDER ; Polarization and Directionality of the Earth's Reflectances r – Pearson correlation coefficient
r2 – Coefficient of determination REB ; Reboleira
RH ; Mean Relative Humidity (%) RMSE ; Root Mean Square Error
SeaWiFS ; Sea;viewing Wide Field;of;view Sensor SNR – Signal;to;Noise Ratio
SPOT ; Système Pour l'Observation de la Terre T – Air Temperature
TM – Thematic Mapper
Tmean ; Mean Air Temperature at station level (º) TOA – Top;of;Atmosphere
Umean ; Mean Wind Speed (m/s) US – United States
UTC ; Coordinated Universal Time
ext(λ,h) ; Light extinction coefficient λ – Wavelength
h ; Vertical atmospheric column height
Hmin – Lower altitude of the vertical atmospheric column Hmax – Higher altitude of the vertical atmospheric column τ – Optical thickness
ρ* ; Top of the atmosphere (TOA) reflectance θv – Sensor zenith angle
φv ; Sensor azimuth ngle φs – Solar azimuth ngle
φ – Sensor relative azimuth angle (
ϕ
v−
ϕ
s ) θs ; Solar zenith angledv – Cosine of sensor zenith angle ds ; Cosine of solar zenith angle τa – Aerosol Optical Thickness
tscat(dv) ; Diffuse transmission function on the ground;satellite path s – Atmospheric spherical albedo
<ρs> ; Target’s reflectance
<ρe> Mean reflectance of the target’s environment d ; distance in pixels
gρi,j*(d) ; Difference between the pixel ground reflectances at distance d M2*(d) ; Structure function
σ ; Standard deviation
ρ
; Mean target reflectancef(RH) ; Ratio of ambient and dry extinction coefficients ρ ; Aerosol mass density (g/m)
Qext,dry ; Mie extinction efficiency reff ; Particle effective radius
1.1 Scope and objectives
Aerosols or suspended particulate matter (PM) represent one of the most important atmospheric pollutants worldwide, affecting air quality at local, re; gional and global scales. Formed by a complex mixture of solid and liquid par; ticles of variable size and composition, PM sources include both natural (e.g., dust from arid areas) and anthropogenic (e.g., traffic, industry and biomass burning) fractions. The main public health effects that have been reported to be associated with PM pollution include the increase of heart and respiratory dis; eases and premature mortality (Bell et al., 2004; Krewski et al., 2000; Pope and Dockery, 1999; Pope et al. 2002; Tran et al., 2008; WHO, 2003). The global distri; bution of atmospheric PM concentrations also has an important role in climate change processes through direct and indirect radiative forcing mechanisms (IPCC, 2007; Kaufman et al., 2002; King et al., 1999; Solomon et al., 2007).
PM is a highly variable pollutant in both the space and time domains, mainly due to its multiplicity of origins and variable modes of transport, repre; senting a monitoring challenge at different spatial scales. The existing air quali; ty ground station monitoring networks, usually concentrated in urban areas, provide insufficient spatial information to infer local, regional and global dis; tribution patterns. Alternatives like measuring campaigns or physical model; ling present restrictions related, in the first case, to high implementations costs and limited temporal representativity and, in the second, to uncertainties relat;
ed to the use of emissions inventories or sparse point ground measurements to characterize initial conditions.
Tropospheric aerosol satellite observations provide good complement to both point ground monitoring and physical modelling. Originally aimed at ra; diative forcing assessment and climate applications, its potential for air quality monitoring has been a rapidly developing research field in the last years (Hoff and Sundar, 2009). In this context, aerosol remote sensing represents a potential tool to improve the spatial coverage and accuracy of PM concentration esti; mates, through the use of physically or statistically based algorithms to retrieve PM concentration surrogates. In particular, the Aerosol Optical Thickness (AOT) parameter, which measures aerosol loading in the atmospheric column, can be used as an estimator of PM concentration at ground level.
The several sensors currently in orbit provide global coverage with varia; ble spatiotemporal resolutions and are able to capture monthly, daily and even intra;daily information on aerosol concentration, size and chemical composi; tion. These products, either in standalone approaches or integrated with air quality physical models and ground monitoring data, can improve substantial; ly current knowledge of the aerosol distribution spatial structure at an local, re; gional, and global scales.
! "
! # $ % &''(!
In the last decade numerous studies provided empirical relations between PM2.5 (particles with an aerodynamic diameter of less than 2.5 Zm) and PM10
Satellite
observations
Simultaneousview of large area
Physical Models
Ground Stations
- Improved air quality forecasts
- Improved
characterization of surface-level air pollution
- Improvement of emission inventories and incidental releases - Monitoring of
transboundary transport of air pollution
- Verification of models - Improve air quality compliance
- Information to decision makers and the general public - Hazard warning - Planning or optimization of air quality ground station networks
- Spatial distribution of emissions
- Trends in emissions - Monitoring of remote locations Global Coverage Homogeneous quality of measurements Integration of sensors
with different temporal, spatial and spectral
resolutions
(particles with an aerodynamic diameter of less than 10 Zm) ground concentra; tions, satellite retrieved AOT and several meteorological variables (e.g. the planetary boundary layer height (PBL), relative humidity (RH)), for different sensors and sites around the world. These relations presented very distinct re; sults in terms of correlation strength and PM estimation accuracy (Chu et al., 2003; Engel;Cox, 2004; Gupta et al., 2006, 2009a, 2009b; Liu et al. 2005; Paciorek et al., 2008; Wang et al., 2010). Variability in the results demonstrates the need for further improvement in this research area before satellite based quantitative PM estimation can be introduced as a reliable air quality monitoring resource. AOT retrieval accuracy still constitutes one of the main uncertainty sources for PM estimation, recurrently identified in most of these works. Additionally, seasonal aspects, aerosol type, meteorological conditions and station type/location were also identified as relevant uncertainty sources.
Satellite aerosol retrieval methods over land derive AOT from the meas; ured top;of;the;atmosphere radiances, using algorithms that rely on a priori def; inition of certain aerosol properties and correct assessment of surface signal. Most rely on the existence of low and homogeneous surface reflectance pixels (e.g., dark dense vegetation ;DDV ; approach), to accurately estimate ground reflectance contribution and show a limited accuracy for surface areas with high intrinsic reflectance (Hsu et al., 2004; Kaufman et al., 1997; Levi et al., 2007; Remer et al., 2005). Aerosol retrieval accuracy is particularly problematic for these high reflective areas, such as deserts and urban areas. Since urban areas concentrate most of the world’s population and represent the main anthropo; genic PM emission source, it is crucial to develop alternative methodologies which address AOT products limitations specifically for these regions..
between a pair of images (ideally a reference image, with no aerosol contribu; tion, and a polluted image) with similar viewing geometry. The assumption of time invariance in surface reflectance must be met in order to correctly remove the surface signal influence when calculating contrast differences. For this rea; son vegetation cover should be accounted for, since, unlike artificial or bare sur; faces, these are subject to seasonal reflectance variations which affect the accu; racy of contrast reduction based AOT retrieval.
Previous case studies developed in desert and urban areas demonstrate the potential of this method, for high (Landsat and SPOT) to medium/low reso; lution sensors (MERIS and NOAA AVHRR), when compared to AERONET and ground particulate matter concentration data (Tanre et al, 1988 and 1992, Hol; ben et al, 1992, Sifakis et al, 1992, Lin et al, 2002, Liu et al 2002, Paronis and Si; fakis, 2003, Retalis et al 2003, Retalis and Sifakis, 2010).
The main objective of this thesis is to assess the potential of a contrast re; duction algorithm for the estimation of PM10 concentration levels from MODIS satellite observations over urban areas. The work developed in this thesis is based on MODIS (Moderate Resolution Imaging Spectroradiometer) imagery since it provides a good compromise between spatial resolution (250 m) and temporal resolution (nearly one image per day) to capture PM10 spatiotemporal variability features at the urban scale.
To achieve this goal, three distinct partial objectives were defined:
1) Design and implementation of a contrast;reduction algorithm to re; trieve optimized AOT estimations from MODIS imagery and eval; uation against ground AERONET measurements.
2) Characterization and correlation analysis, for an urban area, of the optimized AOT values, the PM10 ground concentrations and several meteorological variables with influence in PM10 dispersion and in the definition of the PM10/AOT relationship.
An overview of methodology proposed to achieve these objectives is pro; vided in the following section. The objective of this section is to establish the rationale behind the methodological decisions taken during the development of this thesis and to provide an outline of the respective supporting case studies. Complementary and detailed information about the methodology, case studies and data sets used in this thesis is provided in Chapter 3 and Chapter 4 (Data and Methods” sections) presented as two research publications.
1.2 Methodology and case studies overview
The first aforementioned objective aimed at establishing the MODIS opti; mized contrast reduction technique as a valid methodology to extract AOT val; ues in urban areas and to define its advantages and limitations. It focused on determining optimal AOT retrieval conditions capable of adapting to MODIS variable visualization geometries and to minimize the influence of residual vegetation content in transitional urban areas on the technique’s accuracy. These improvements included: 1) definition of the algorithm optimal spatial resolution; 2) calculation of a sensor zenith angle correction term, 3) definition of optimal observation geometry clusters based on their similarity, and 4) char; acterisation of the most suitable land cover classes to reduce vegetation related reflectance changes.
tially influenced by the same urban centre chosen in the second case study and test the algorithm’s resilience to a higher vegetation presence.
The remaining two thesis objectives, aimed at assessing AOT’s ability to estimate PM10 ground concentrations, were based on a case study developed for the Lisbon Metropolitan Area. This region was chosen due to the fact that it represents the largest Portuguese urban centre, with a population close to two million inhabitants (INE, 2001). In the last ten years it presented, together with the Oporto urban area (the second largest Portuguese city), the highest PM con; centration levels in the country, comparable to the most polluted European Cit; ies (APA, 2011). The preference for the urban area surrounding the Portuguese capital was also determined by its denser air quality monitoring network, with the highest number of stations of all Portuguese air quality zones/agglomerations and yearly lower presence of clouds. The first criterion ensures a more comprehensive evaluation of the developed PM10 estimation re; gression models while the second is an essential pre;requisite for an accurate AOT satellite retrieval.
For the development of this case study the following datasets were col; lected for 2005: a) MODIS imagery to retrieve the AOT values for all PM10 air quality stations based on the optimal contrast reduction algorithm; b) PM10 hourly ground measurements for those stations; c) meteorological variables (temperature, atmospheric pressure, mixing layer height, relative humidity and wind speed) measured in the Gago Coutinho station located in the Lisbon city centre.
quently, it allowed the determination of a set of optimal conditions as well as limitations for PM10 empirical estimation based on AOT and meteorological variables.
The final objective of this thesis consisted in the definition and evaluation of uni and multivariate linear regression models to estimate PM10 ground con; centrations from satellite AOT values. The inclusion of non;linear regression PM10 estimation schemes (e.g. General Additive Models – GAMs or neural net; works) was considered but disregarded since most non;linear relations identi; fied in previous studies (Gupta et al., 2009a, 2009b, Liu et al., 2005) refer to me; teorological data and provide no significant additional information on the suit; ability of the contrast reduction retrieved AOT as a PM10 estimator. Further; more, when using these techniques, it is often more difficult to correctly inter; pret the role and contribution of each predictor, as intended in this study, and can eventually lead to over fitting issues, which compromise model generaliza; tion to a more extended time series or to other urban regions.
!& " )
1.3 Thesis structure overview
Chapter 2 contains a comprehensive literature review divided into two sections. The first section provides information on aerosols including definition, main sources, seasonality, related health problems and air quality legislation towards providing a general background to the air pollution problem tackled in this thesis. This framework is followed by a detailed characterization of PM re; lated air quality problems for the Lisbon Metropolitan Area to justify its selec; tion as the main case study developed in the scope of this thesis. It integrates them into a ten year historical context given for the entire Portuguese territory, while conveying information on administrative limits, demography, main emission sources, chemical composition, affected areas, seasonality and ground air quality monitoring network design. The second section briefly discusses the key satellite aerosol retrieval methods over land and then focus on the theory and relevant applications related to the contrast reduction method. Finally it will provide an overview of the main satellite based ground PM estimation studies, including the key achievements and limitations, to establish a compara; tive framework for the results presented.
In Chapter 3, the main results regarding the definition, implementation and evaluation of the optimized contrast reduction algorithm are presented and discussed. This chapter focus on the comparative analysis of AOT retrieved values for a one year (2005) dataset of MODIS images with the AOT measure; ments from five European urban AERONET stations. The work described in this chapter is published in a peer reviewed article in “Atmospheric Research” entitled “Comparison of contrast reduction based MODIS AOT estimates with AERONET measurements” (Grosso and Paronis, 2011).
Chapter 4 will build upon the results from the previous chapter to devel; op linear regression models to estimate PM10 that are based on the optimized contrast AOT values for the air quality stations of Lisbon Metropolitan Area. This study will be preceded by a detailed characterization of the times series for PM10, AOT and meteorological variables and corresponding correlation analy; sis.
methods, describing the key datasets used and the methodology followed; 3) results and discussion, presenting the obtained results and providing an inter; pretation; and 4) main conclusions, based on those results.
&
*
2.1 Aerosol/Particulate Matter
This section provides a comprehensive context to air quality problems re; lated to PM. It introduces a general aerosol definition and classification accord; ing to size and emission sources, and establishing a relation between classes and respective global distribution, seasonality and human health effects. Asso; ciated with the development of scientific knowledge of those effects, a brief overview of the evolution of European and Portuguese air quality legislation is given this section. This chapter focuses mainly the legal limits of PM10 and PM2.5 concentrations and on criteria related to the definition of a national air quality monitoring network, with regards to the required station type charac; teristics and their respective spatial representativeness. This is a relevant issue to be addressed in the scope of a thesis that focuses on estimating point PM10 station concentrations from satellite estimates, usually calculated for a wider area. This section finishes with the provision of a historical context of air quality in the Lisbon Metropolitan Area, the main case study for this thesis, integrated within the broader context of the Portuguese territory.
2.1.1 Sources and classification
Aerosols, also designated as suspended particulated matter, are generally defined as a complex mixture of solid particle or liquid droplets suspended in a gas with a size lower than 100 Zm and greater than individual molecules (Sein; feld and Pandis, 2006). Usually concentrated in the first kilometres of Earth’s
atmosphere (2;3 km), they are one of the most important atmospheric constitu; ents with a significant influence in global climate change processes, through di; rect and indirect radiative forcing mechanisms (IPCC, 2007; Kaufman et al., 2002; King et al., 1999; Solomon et al., 2007), and in local/regional air quality re; lated human health problems (Bell et al., 2004; Krewski et al., 2000; Pope and Dockery, 1999; Pope et al. 2002; WHO, 2003). Other impacts related to PM in; clude environmental effects such as visibility degradation (Huang et al., 2009; Husar et al., 1981; Hyslop, 2009) or acid rain formation (Kleinman et al., 1989; Seinfeld and Pandis, 2006).
&! + % %
! , - % .(/
The coarse particles have a more significant biogenic contribution and represent, according to some estimates, around 85% of the total annual atmos; pheric aerosol mass (Seinfeld and Pandis, 2006). They are mostly generated by mechanical processes, responsible for their ejection into the atmosphere (prima; ry aerosols). Their main biogenic constituents are crustal elements present in dust, carbonates and sulphates of mineral origin and salt from the sea sprays. The anthropogenic part of this larger type of particles originates from industrial activities like cement and construction and oil or coal based fuel combustion. Coarse particles are usually removed from the atmosphere due to their higher weight through deposition/sedimentation processes.
represent a much smaller part of total aerosol mass (around 15%) and are most; ly present in the vicinity of large urban centres, where their percentages can be much higher. The main removal mechanism is trough wet deposition processes such as rainout or washout.
&! " , % &''0
Coarse particles Fine particles
Biogenic Anthropogenic Biogenic Anthropogenic
S
o
u
rc
es
Arid soil dust resus; pension.
Long range dust transport event. Volcanoes. Marine Sprays. Biological Sources (e.g., spores, pollens).
Industrial activities (e.g., cement, ce; ramics, construc; tion).
Fuel combustion (oil, coal).
Sulfur gases oxida; tion.
Nitrogen gases ox; idations (from lightning and soil evapotranspiration. Chemical conver; sion of organic compounds of bio; genic origin.
High temperature industrial activities (e.g., foundry). Traffic emissions associated with chemical conver; sion of NOx, SO2 and organic com; pounds. C o m p o n en ts
Metallic oxides from crustal elements (SiO2, Al2O3, Fe2O3, TiO2)
NaCl
CaCO3, Na2SO4, MgSO4, K2SO4 Pollens, spores and micro;organisms
Sulfate (SO42;) Nitrate (NO3;) Amonium (NH4+) Hidrogen ion (H+) Elemental carbon
2.1.2 Global distribution and seasonality
penetrate the higher layers of the atmosphere (Kreidenweis et al., 2001; Winkler
et al., 2008). Other fine anthropogenic aerosols derived from traffic and industry emissions in populated areas have a more limited range of influence.
Aerosols global geographical distribution and seasonality is presented in Figure 2.2 that shows the MISR Aerosol Optical Thickness (AOT) product, a pa; rameter closely related to aerosol concentration, which definition will be further developed in section 2.2. The observed patterns are mainly associated with four types of aerosols: desert dust, biomass burning, sea sprays and, to a lesser ex; tent, urban anthropogenic fine particles. The high aerosol amounts over homo; geneous ice sheets (Antarctica and Greenland) should be disregarded since these result from an artefact related to cloud screening limitations over snow/ice surfaces (Diner et al., 1999).
The main geographical areas responsible for the formation of coarse desert dust particles are the north of Africa (Sahara and Sahel), the Middle East region (Saudi Arabia) and eastern Asia (Gobi Desert in the South Mongolia/Northern China area). Their contribution is higher during the spring (March;April;May or MAM) and the summer (June;July;August or JJA) seasons, with AOT values generally higher than 0.5, usually associated with medium and long range transport events. It is also possible to observe from Figure 2.2 the transport of Saharan dust across the Atlantic to Central and South America (Remer et al., 2008). Additionally the North African dust has a regional effect on particle con; centrations in the Mediterranean region, including the Iberian Peninsula (Pan; dolfi et al., 2011; Rodriguez et al., 2001).
Biomass burning aerosols have a distinct seasonality related to variations in temperature and vegetation. According to Kaufman et al. (2002), the areas more affected by smoke from vegetation fires are located in South America (August–October), Central America (April and May), Southern Africa (July– September) and Central Africa (January–March). Their transport range seems to be lower than desert dust but some transatlantic transport can be observed in Figure 2.2 during winter and spring.
spring due to stronger winds, affecting coastal areas in North America and Eu; rope.
&!& " ) $ 1 *
% &'' 2 &''&
! , ,33 ,33 ! ! !
2.1.3 Effects on human health
In terms of effects in human health, and even though the outcomes of var; ious epidemiologic and human studies were controversial in the past, there is nowadays strong evidence that both short and long;term exposures to PM are connected with increased morbidity and mortality rates (Anderson, 2009; Bell et al., 2004; Krewski et al., 2000; Pope and Dockery, 1999; Pope et al. 2002; Tran et al., 2008; WHO, 2003).
PM health related effects were initially established for short term expo; sures to high pollution events (e.g., London episodes in 1952 and 1962, de; scribed in the works of Bell and Davids (2001) and Lippmann (2001)). Their health effects became progressively more associated with lower particulate pol; lution levels, during and after the 1990’s. This progress was due to an increase in the quantity and availability of epidemiological data and advances in related monitoring technologies (Tente, 2005). As a consequence, several reference studies were presented during that period, relating PM10 concentrations with increases in hospital admissions and deaths due to respiratory and cardiovascu; lar diseases (Dockery et al., 1993; Dockery and Pope, 1996; Pope et al., 1995).
During the last 20 years, other studies, conducted for a wide range of time and spatial scales, confirmed these findings. In 2006, Pope and Dockery drafted a review paper where they compiled a substantial part of these studies. Despite a large disparity between the different findings, they found a direct positive trend between increases in PM10 short and long term exposure and health ef; fects, such as cardiovascular mortality and hospital admissions or the existence of chronic inflammatory lung injuries.
an extensive review of mortality studies related to PM, in which the range of risk increase of the considered studies seems to be less evident. For instance, considering cardiovascular mortality, the risk percentage increase varies be; tween almost zero and 8%.
&!4 " $ * ' 5 3 4
+1'% +1&!0% $ $ 67 8 )9 ! , -:) % &'';
&!; " 1 +1 * ! ,
+ $ % &''/!
The nature and extent of health related PM effects are usually dependent on particle size, chemical composition and duration of exposure.
&!0
9 ! , -:)% &'';
Smaller particle have the characteristic of reaching further into the respira; tory tract and this phenomena seems to be directly linked with an increase in adverse health effects (Pope and Dockery, 2006), as shown in Figure 2.3, by the relative increase in mortality risk estimates seen in PM2.5 epidemiological stud; ies, when compared with PM10. Other recent studies seem to extend this conclu; sions to circulatory system effects, by establishing a more robust link between fine (<2.5 Zm) and ultra;fine (<0.1 Zm) and several cardiovascular mortality and morbidity indicators for short and long term exposures (Brook et al. 2010).
components like ammonium salts, chlorides, and silicate clays (from wind; blown dust) (Pope and Dockery, 2006; WHO, 2004).
&!& * < +1! , -:)% &''/
Effects related to short;term exposure Effects related to long;term exposure ; Lung inflammatory reactions
; Respiratory symptoms
; Adverse effects on the cardiovascu; lar system
; Increase in medication usage ; Increase in hospital admissions ; Increase in mortality
; Increase in lower respiratory symp; toms
; Reduction in lung function in chil; dren
; Increase in chronic obstructive pul; monary disease
; Reduction in lung function in adults ; Reduction in life expectancy, owing mainly to cardiopulmonary mortality and probably to lung cancer
Despite all the advances that occurred in the past 30 years, in the field of PM health related effects, some knowledge gaps still remain and require further research. These include: a) impacts of PM exposure on infant mortality and var; ious birth related problems; b) association between PM and lung cancer; c) def; inition of the health related impact associated to each component of the PM mixture and their respective source apportionment; d) correct understanding of the major risk groups (Pope et al. 2011; Pope and Dockery, 2006).
2.1.4 PM air quality guidelines and legislation
The human health impacts described in the previous section have led WHO to propose strict guidelines regarding PM2.5 annual mean and 24;hour mean concentrations, where these must not exceed 10 and 25 Zg/m3, respec; tively. Threshold values have been selected based on the results of relevant long;term exposure studies such as the ACS (Pope et al. 1995) and Harvard Six; Cities Study (Dockery et al., 1993; Kreskwi et al. 2000). Although the WHO guidelines are focused primarily on the use of PM2.5 and secondarily on PM10 as indicators of ambient PM air pollution, the specific air quality guidelines for PM10 were adjusted to 20 and 50 Zg/m3 for the annual and 24;hour mean val; ues, respectively.
tained the annual fine particle (PM2.5) standard at 15 Zg/m3. As regards PM10, EPA has retained the pre;existing 24;hour standard of 150 Zg/m3, revoking at the same time the annual standard.
In a similar way, European legislation has been redrafted to better incor; porate the WHO recommendations. The Air Quality Framework Directive (1996/62/CE), published in September 27th, 1996, established common policy guidelines for EU countries regarding air quality monitoring, assessment and management.
As shown in Figure 2.6, this directive was followed by four more specific directives, published between 1999 and 2004. They defined limit values for hu; man health protection for all major air pollutants. The upper and lower assess; ment thresholds were also established, aimed at the definition of particular as; sessment and management measures (e.g., more detailed measurement or modelling campaigns). For the major pollutants, limit values were introduced for a daily and yearly basis, with the exception of SO2, CO and O3. In the first case, only the daily average values were defined and in the last two, limit and target objective values corresponded to maximum daily eight hour means.