Influence of pH in Obtaining Indium Tin Oxide Nanoparticles by Microwave Assisted
Solvothermal Method
Fernando Modesto Borges de Oliveiraa, José Arana Varelab, Marcelo Ornaghi Orlandib*
Received: April 25, 2017; Revised: November 17, 2017; Accepted: November 23, 2017
A systematic study about synthesis of In1-xSnxO2 (ITO) nanostructured crystals by
microwave-assisted solvothermal method is reported. Different solutions using InCl3.4H2O and SnCl4.5H2O
precursors in ethylene glycol solvent were prepared in distinct pHs (acid and basic ones). The syntheses were performed at 200 ºC using a heating rate of 50 ºC min-1 and soaking time of 30 minutes. All the
synthesized powders were characterized by X-ray Diffraction (XRD) and Rietveld refinement to study the phase evolution as a function of pH. The materials synthesized in the pH ranging between 11.5 and 11.9 were further studied by field emission scanning electron microscopy (FE-SEM) and transmission electron microscopy (TEM) techniques. As ITO materials have many practical applications due to
their transparency in the visible spectrum, UV-Vis spectroscopy analysis was performed to obtain the
optical band gap and the respective optical window.
Keywords: ITO, nanoparticles, Microwave-assisted solvothermal, optical properties.
*e-mail: [email protected]
1. Introduction
Transparent and conductive oxides (TCOs) have great technological interest due to the antagonist properties they
can present. The indium tin oxide (ITO) composition stands
out among other conductive oxides (fluorine-doped tin oxide,
antimony tin oxide, aluminum-doped zinc oxide, indium
zinc oxide) due to both the high electrical conductivity,
and optical transmittance, which can reach up to 90% in the visible spectrum 1-5. Therefore, it is easy to find out different
kind of applications for TCOs, such as: optoelectronic devices (electrochromic displays, touch and liquid crystal screen, light emission diode, solar cells), resistive films (windshield plane, anti-static coating, and heat mirrors), photothermal converter, composites, gas sensor, and shielding
for microwave 6-9. The synthesis of ITO nanostructures has been reported by several methods, like co-precipitation of precursor metal 10,11, carbothermal reduction 12, microwave-assisted hydrothermal and solvothermal 13, sol-gel 14,15,
organic templates 16 and microwave-assisted process in solid state 17,18, and the morphology of obtained materials is
highly dependent on the chosen method, enabling to obtain nanoparticles, nanowires, nanorods, and other morphologies. Regarding the microwave-assisted hydrothermal/solvothermal
synthesis, it is well known that there is dependence on the pH of the solution, but there is no detailed study about the
pH range in which it is possible to obtain the ITO crystals. Synthesis methods using microwave to assist the formation of nanoparticles have attracted great attention due to the
short time of synthesis and the consequent energy saving. The thermal and non-thermal effects of microwaves on
synthesis are still under discussion, but microwave-assisted method promote both dipole rotation and ion conduction 19,20 allowing it to obtain faster synthesis than conventional
hydrothermal/solvothermal methods. One reason is related to the localized heating, generating hot spots 21. Besides the
time of synthesis, another advantage of this method is the
lower temperature needed to crystallize materials and no
aggressive byproducts. The referred gains have contributed
to the popularization of microwave assisted synthesis 22. In this context, the proposal of this work consists in a
careful study of the pH influence on the synthesis of ITO
crystals obtained by microwave-assisted solvothermal method. Besides, a deep characterization of the structure and
morphology was performed on selected samples. This method
was chosen because it provides synthesis at low temperatures
and homogeneous heating, features that allow the growth of
small particles with controlled size and shape 23,24.
2. Experimental Methods
The precursor materials used in the synthesis of ITO
crystals were indium chloride tetrahydrate (InCl3.4H2O,
Aldrich; 97% purity); tin chloride pentahydrate, (SnCl4.5H2O, Aldrich; 98% purity) and tetramethylammonium hydroxide
pentahydrate (N(CH3)4OH. 5H2O, Sigma; 97% purity). A
solution was prepared by dissolving 0.7 g of InCl3.4H2O, and
0.042 g of SnCl4.5H2O in 25 ml of ethyleneglycol, meaning it a molar proportion between ions In3+ and Sn4+ of 5%. This aDepartamento de Química, Universidade Federal de São Carlos, CEP 13565-905, P.O. Box 676, São
Carlos, SP, Brazil
bDepartamento de Físico Química, Universidade Estadual Paulista, CEP 14800-060, P.O. Box 355,
solution was homogenized by mechanical stirring at 80 ºC, in a similar process described by Hammarberg 25. Another
alkaline solution was prepared by dissolving the appropriate amount of N(CH3)4OH.5H2O in 2 mL of deionized water.
After reaching 80 ºC, this alkaline solution was slowly dripped in the solution with the precursor ions until obtaining the desired pH, which is listed in Table 1. Although the pH gap is small to differentiate some samples, it is important to note that mass of base used to reach that pH is not negligible. Then, the solution with desired pH was transferred to a Teflon
container with volume of 100 ml, which was inserted into a
reaction cell adapted to fit a conventional microwave oven designed for this kind of synthesis 24. The syntheses were
performed at 200 ºC with heating rate of 50 ºC min-1, and 30 min at maximum temperature.
Table 1. Samples’ labels, the pH at each sample was synthesized
and the N(CH3)4OH.5H2O mass necessary at syntheses.
Sample pH Mass (g)
1 5.2 1.269
2 11.1 1.812
3 11.5 1.914
4 11.5 1.937
5 11.6 1.960
6 11.8 2.050
7 11.9 2.130
8 12.2 2.560
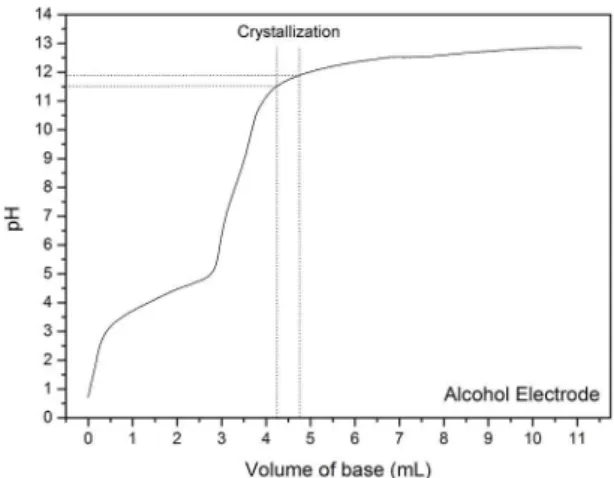
Figure 1. Titration curve of precursor solution with 2.5 M of N(CH3)4OH.5H2O
the titrated solution is kept acid until the added base achieve
the volume of 3,7 ml. In the alkaline range, pH increases fast until a volume of 4.2 ml, then reaching asymptotically the pH 13. Using this calibration curve, it is possible to know
the amount of base necessary for synthesis at any pH; for instance, a base volume of 4.20 mL means the synthesis with
pH 11.47, and this volume times 2.5 M results in 1.05.10-2
moles and, consequently, 1.903 g of N(CH3)4OH.5H2O. This
base has high water solubility, and its mass can be dissolved
in amounts as small as 2 mL, which was established as the volume to solubilize the mass of base.
It is important to note that the volume of water determines
the pressure of synthesis once the water's boiling point is 100 ºC and the synthesis is carried out at 200 ºC. Besides, by controlling the synthesis conditions and time of reaction
it was possible to decrease the reaction time in four times when compared to other synthesis 25. Comparing with a
hydrothermal method using infrared heating, which needs
12h after calcination in order to crystallize the material 28, the microwave method is much faster and produces less byproducts.
Figure S1 shows that synthesized powders have different colors, indicating that pH plays an important role in the ITO
synthesis. Samples 1, 2 and 8 resulted in a white material while
samples 3 to 7 resulted in colored (greenish) materials, which means materials with different phases or altered In to Sn ratio.
The structure of synthesized materials was studied by
XRD, and the diffractograms are illustrated in Figure 2. Figure 2a presents the XRD plots of samples 1, 2 and 8, and the absence of well-defined peaks is characteristic of solids without long-range order. The shoulders present in Figure
2a cannot be associated to any known ITO peak. These samples may be related to some amorphous intermediate
compound generated by reaction of chemical precursors once
they come out as crystalline ITO particles after calcination. In this work the main focus will be on samples crystallized without further calcination.
After the syntheses, the suspensions were centrifuged
and the precipitated particles were washed three times with
alcohol ethylic to eliminate any surface residues. Finally, samples were oven dried at 80 ºC before being further characterized. All samples were studied by X-ray diffraction (XRD, Rigaku, model RINT 2000), using CuKα radiation, in
the 2θ range from 10º to 70º 26,27. Morphological and structural characterizations of the selected samples were performed
by transmission electron microscopy (TEM; Philips, model CM200) operated at 200 kV, and field emission scanning electron microscopy (SEM; JEOL, model 7500F). UV-Vis
measurements were obtained from powdered samples by
diffuse reflectance method in the range from 320 nm to 900 nm with 2 nm step using Cary 5G spectrophotometer (Varian,
USA). Infrared spectra of powder were measured on Bruker
Vertex 70 FTIR spectrometer equipped with Platinum ATR (Attenuated Total Reflectance) accessory. The spectra were
recorded between 400 cm-1 and 4000 cm-1.
3. Results and Discussion
To understand the pH behavior as a function of added base,
a titration solution having the precursors' ions was performed, as shown in Figure 1. Keeping the precursor solution stirring at 80 ºC, the alkaline solution of N(CH3)4OH.5H2O 2.5 M
Figure 2. a-c) X-ray diffraction pattern of the synthesized powders. Materials were grouped by phase similarity. The indium tin oxide phase corresponds to the JCPDS card # 89-4597. Figure d) displays EDS analysis of samples that exhibited crystallinity.
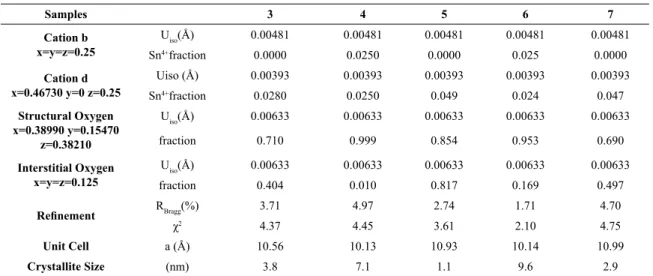
Table 2. Rietveld refinement parameters obtained from X-ray diffraction data from samples 3 to 7.
Samples 3 4 5 6 7
Cation b x=y=z=0.25
Uiso(Å) 0.00481 0.00481 0.00481 0.00481 0.00481
Sn4+fraction 0.0000 0.0250 0.0000 0.025 0.0000
Cation d x=0.46730 y=0 z=0.25
Uiso (Å) 0.00393 0.00393 0.00393 0.00393 0.00393
Sn4+fraction 0.0280 0.0250 0.049 0.024 0.047
Structural Oxygen x=0.38990 y=0.15470
z=0.38210
Uiso(Å) 0.00633 0.00633 0.00633 0.00633 0.00633
fraction 0.710 0.999 0.854 0.953 0.690
Interstitial Oxygen x=y=z=0.125
Uiso(Å) 0.00633 0.00633 0.00633 0.00633 0.00633
fraction 0.404 0.010 0.817 0.169 0.497
Refinement RBragg(%) 3.71 4.97 2.74 1.71 4.70
χ2 4.37 4.45 3.61 2.10 4.75
Unit Cell a (Å) 10.56 10.13 10.93 10.14 10.99
Crystallite Size (nm) 3.8 7.1 1.1 9.6 2.9
Figure 2b shows the XRD patterns of samples 3, 4 and 6, presenting well-defined peaks which were fully indexed by indium tin oxide phase (JCPDS card# 89-4597). Samples 5 and 7, presented in Figure 2c, can also be indexed by
the ITO phase, but peaks are broader and have lower
intensity, indicating a poorer degree of crystallinity or small
nanocrystalline structures. Both indium oxide and indium
tin oxide have very similar structures, making it difficult
to separate them in the XRD pattern. In order to prove that
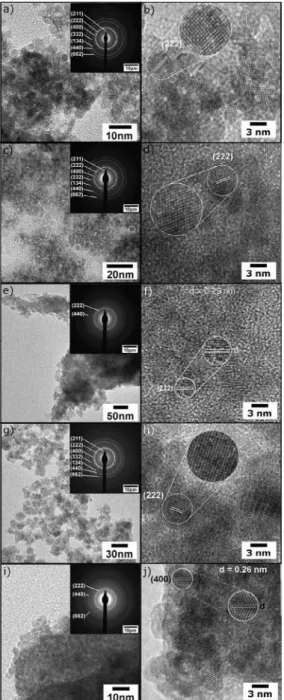
Figure 3. This image is a compilation composed by TEM, HRTEM, and SAD analyses. The left column is showing TEM and SAD figures and the right column shows the HRTEM images. Figure a) and b) belongs to sample 3, c) and d) to sample 4, e) and f) to sample 5, g) and h) to sample 6 and i)
and j) to sample 7.
Figure 4. Particle diameter size distribution and probability density of the samples a) 3, b) 4 and c) 6. Lognormal function was used to
represent the particle distribution.
spectrometry (EDS) analyses were performed, and the obtained spectra (Figure 2d) confirm that samples 3 to 7
present both In and Sn atoms in the structure.
Rietveld refinements of XRD data from samples 3 to 7 were performed using GSAS II software 29, and the
parameters obtained from refinements are summarized in Table 2. By comparing the structural values, we found that the lattice parameter of samples 5 and 7 are larger than the other samples, meaning that a more distorted structure was produced, which agrees with the wide and low intensity peaks obtained. As a consequence, these samples present the lowest values of crystallite size. Besides, by analyzing in detail the refinement parameters, it is possible to note
that samples 5 and 7 have Sn4+ preferably in d site and
a larger amount of interstitial oxygen. In practical terms,
peculiarities such as d site occupancy and interstitial oxygen
are responsible for its biggest unit cell. Furthermore, samples
4 and 6 seem to be the most stable ones since they have a close distribution of Sn4+ in sites b and d, exhibiting lower
amount of interstitial oxygen 30.
Correlating the XRD results with the tritation curve it is possible to infer that the range where the crystallization
of ITO nanoparticles is favored after microwave irradiation.
Results show that slightly alkaline medium aims crystallization since it occurs after the last equivalence point around pH 10. The high hydroxide ion concentration is harmful to
crystallization and the same is valid for the acid medium.
FEG-SEM images of crystalline samples are depicted in Figure S2. The morphological characteristics of samples are similar, presenting aggregated spherical nanoparticles. By SEM images, the samples 5 and 7 also seem to contain traces of organic waste. The aggregates presented in sample 5 are bigger than the aggregates of samples 3, 4 and 6 indicating some organic residue gluing nanoparticles. For sample 7, a more detailed study reveals plates like morphology similar to the ones observed in polymers, indicating this sample still presents organics. Due to the small size of particles observed by SEM, a more detailed morphological study was performed by TEM (Figure 3). It is possible to note that all
samples have particles with diameter smaller than 10 nm,
in agreement with Rietveld results. A representative number of particles belonging to samples 3, 4 and 6 were counted in
order to obtain the distribution of particles diameter and the
Figure 5. ATR-FTIR of samples 7 to 3, organic band absorption corresponds to ethylene glycol whereas M-Cl bands are metal
chlorides from precursors.
Figure 6. Determination of optical band gap of samples 3 to 7 by drawing a line at [F( R ) hʋ] 2 = 0.
of residues and high aggregation degree of the particles belonging to samples 5 and 7 made it impossible to count a significant number of particles to produce a histogram.
A detailed interpretation of HRTEM images was performed by detaching a set of ten atomic planes in some particles.
The shown nanoparticles of samples 3 to 6 presented the same distances, with interplanar distance of 2.9 Å, which is related to the (222) plane of ITO phase. This plane is the one
with maximum diffraction intensity for the ITO structure, so it is easier to observe them in the HRTEM images. For sample 7, different from the previous ones, the crystalline
plane observed was the (400), with interplanar distance of
2.6 Å. The difference between the planes observed in the HRTEM images has no correlation to any other characteristic
of the material since it is an exclusive orientation of particle
in the taken image.
The selected area diffraction (SAD) pattern reveals the existence of concentric rings emphasizing the polycrystalline nature of samples, and all the reflection planes are in agreement
with the XRD results. The numbers in parentheses associated
to each ring are the Miller indices of the respective set of planes. All the atomic planes were indexed as belonging to
the ITO phase and there is no secondary phases Samples 5
and 7 presenting wider rings, which is in agreement with the XRD results and was explained based on Rietveld refinement parameters and the presence of organics. Based on the electron microscopy images and the diameter histogram it was possible to infer that the average particle size increases by increasing the pH of the synthesis. The average diameter of particles for sample 3 is 3.4 nm, and calculating the area under the curve in the range from 2 to 4.5 nm we conclude that 90 % of the particles have the diameter in this range. In a similar way, in Figure 4b, it was observed that the average diameter of the particles belonging to sample 4 is 7.7 nm
and 90 % of these particles have sizes between 3 and 12
nm. For sample 6, the average diameter obtained was of 8.2
nm with standard deviation of 0.3 nm. The calculated area
in the range of 4 and 13 nm indicates that 90% of particles are in this range. These particle sizes have a close relation to the crystallite size obtained by Rietveld refinement and
shown in Table 2.
In the titration curve there are two point of equivalence, the first one being at pH 5.9 and the second one at pH 9.7. Based
on these results, we showed that basic medium can provide
the particle growth. Alkaline medium supports the formation
of indium and tin hydroxide complex 31, the mechanism
related with this growth might be the olation, which consists
in a solution process that transforms the complex ions in a polymeric oxide 32. Increasing the pH of the solution, the
complexation of the precursor ions become more effective and consequently the dimension of the polymeric clusters grew together, resulting in bigger particles.
The presence of organic molecules at materials surface was studied by ATR-FTIR. All organic bonds depicted in Figure 5 match with ethylene glycol absorption spectrum (peaks at
3216, 2928, 2880, 1394, 1079, 1037 and 880 cm-1), which
was the precursor for obtaining ITO materials. Absorptions frequencies at 1661, 1579 and 565 cm-1 belongs to metal chlorides 33,34. FTIR results clearly shows that samples 3, 4 and 8 present lower amount of residues. On the other hand,
samples 5 and 7 exhibit higher amount of ethylene glycol
due to the broad absorption peak at 3216 cm-1, corresponding
to OH group. The smaller crystallite size presented by these samples can justifies the strongest functionalization. The higher amount of residues at samples 3 and 5 also explains both the broader peaks at XRD diffractograms and broader rings at SAD patterns.
In order to get the optical band gap of studied materials it was employed Kubelka-Munk method 35 at UV-Vis reflectance
results. The optical band gap was determined by the product of Kubelka-Munk quantity (F(R∞)) and photon energy (hʋ)
to the power of 2; where the exponent can assumes the
values 2, 2/3, 1/2 or 1/3, depending on the nature of the
36. In Figure 6 it is possible to observe that the optical band
gap of synthesized materials oscillate from 3.0 eV to 3.4 eV. Although the band gaps are quite similar, according Burstein-Moss effect an energy difference of 0.1 eV can mean a raise in electronic density of 1.1∙1018∙cm-3 37,38. The particle size
also affect the band gap, if it is smaller than Bohr radius of exciton the optical band gap increases, and this could explain the higher gap value observed for sample 5. Since F(R∞) is related with the ratio between absorption/scattering coefficients we can affirms that all those samples are very
transparent in visible spectrum (from 400 nm to 700 nm), which is important for practical applications of materials.
4. Conclusions
A systematic study to obtain ITO nanoparticles by microwave assisted solvothermal method was performed in this work.
The influence of the acid and basic precursor solution on the final structure, and morphological characteristics of collected
materials was carefully studied. Results showed that materials
in the ITO phase are obtained in a narrow range of pHs, from
11.5 to 11.9. However, the mass of base used to reach the
desired pH is enough to increase the particle size. Morphological
characterization showed that ITO materials are composed of spherical nanoparticles. An olation mechanism was proposed
to explain the oxide growth in alkaline environment. The transparency of the synthesized materials ranged from 85% to 95%, and particle size between 3.4 and 8.2 nm, enabling it to apply these materials in devices requiring high light transmittance.
Results showed that microwave assisted solvothermal route is appropriate to obtain nanocrystalline ITO particles.
5. Acknowledgement
This work was supported by CNPq (proc #485644/2011-8, #309013/2012-7 and #303542/2015-2) and Fapesp (proc #2013/07296-2) agencies. SEM and TEM facilities were provided by LMA-IQ-UNESP.
6. References
1. Huang M, Hameiri Z, Venkataraj S, Aberle AG, Mueller T. Characterisation and Optimisation of Indium Tin Oxide Films Deposited by Pulsed DC Magnetron Sputtering for
Heterojunction Silicon Wafer Solar Cell Applications. Energy
Procedia. 2013;33:91-98. DOI: 10.1016/j.egypro.2013.05.044
2. Turgut G, Keskenler EF, Aydin S, Yilmaz M, Dogan S, Düzgün B. An investigation of the Nb doping effect on structural, morphological, electrical and optical properties of spray deposited F doped SnO2 films. Physica Scripta. 2013;87(3):035602. DOI:
10.1088/0031-8949/87/03/035602
3. Benouis CE, Benhaliliba M, Mouffak Z, Avila-Garcia A, Tiburcio-Silver A, Ortega Lopez M, et al. The low resistive and transparent
Al-doped SnO2 films: p-type conductivity, nanostructures
and photoluminescence. Journal of Alloys and Compounds.
2014;603:213-223. DOI: 10.1016/j.jallcom.2014.03.046 4. Dhamodharan P, Manoharan C, Bououdina M, Venkadachalapathy
R, Ramalingam S. Al-doped ZnO thin films grown onto ITO
substrates as photoanode in dye sensitized solar cell. Solar Energy. 2017;141:127-144. DOI: 10.1016/j.solener.2016.11.029.
5. Potter DB, Bhachu DS, Powell MJ, Darr JA, Parkin IP, Carmalt CJ. Al-, Ga-, and In-doped ZnO thin films via aerosol assisted
CVD for use as transparent conducting oxides. physica status
solidi A. 2016;213(5):1346-1352. DOI: 10.1002/pssa.201532996.
6. Chopra KL, Major S, Pandya DK. Transparent conductors-A
status review. Thin Solid Films. 1983;102(1):1-46. DOI:
10.1016/0040-6090(83)90256-0
7. Baía I, Quintela M, Mendes L, Nunes P, Martins R. Performances exhibited by large area ITO layers produced by r.f. magnetron
sputtering. Thin Solid Films. 1999;337(1-2):171-175. DOI:
10.1016/S0040-6090(98)01393-5
8. Hamberg I, Granqvist CG, Berggren KF, Sernelius BE, Engström L. Optical properties of transparent and infra-red-reflecting ITO
films in the 0.2-50 µm range. Vacuum. 1985;35(6):207-209.
DOI: 10.1016/0042-207X(85)90391-4
9. Arlindo EPS, Lucindo JA, Bastos CMO, Emmel PD, Orlandi MO. Electrical and Optical Properties of Conductive and Transparent
Ito@PMMA Nanocomposites. Journal of Physical Chemistry
C. 2012;116(23):12946-12952. DOI: 10.1021/jp3031418.
10. Kim HW, Kim YI. Characteristics of Indium-Tin-Oxide Nanoparticles Prepared by Controlled Chemical Coprecipitation Method. Bulletin of the Korean Chemical Society.
2008;29(9):1827-1830. DOI: 10.5012/bkcs.2008.29.9.1827
11. Yu D, Wang D, Yu W, Qian Y. Synthesis of ITO nanowires and
nanorods with corundum structure by a co-precipitation-anneal method. Materials Letters. 2004;58(1-2):84-87. DOI: 10.1016/
S0167-577X(03)00420-8
12. Orlandi MO, Aguiar R, Lanfredi AJC, Longo E, Varela JA, Leite ER. Tin-doped indium oxide nanobelts grown by carbothermal
reduction method. Applied Physics A. 2005;80(1):23-25. DOI:
10.1007/s00339-004-3027-x
13. Bühler G, Thölmann D, Feldmann C. One-Pot Synthesis of Highly
Conductive Indium Tin Oxide Nanocrystals. Advanced Materials.
2007;19(17):2224-2227. DOI: 10.1002/adma.200602102 14. Ba J, Rohlfing DF, Feldhoff A, Brezesinski T, Djerdj I, Wark
M, et al. Nonaqueous Synthesis of Uniform Indium Tin Oxide Nanocrystals and Their Electrical Conductivity in Dependence
of the Tin Oxide Concentration. Chemistry of Materials.
2006;18(12):2848-2854. DOI: 10.1021/cm060548q
15. Li ZH, Ren DY. Preparation of ITO transparent conductive
film by sol-gel method. Transactions of Nonferrous Metals
Society of China. 2006;16(6):1358-1361. DOI:
10.1016/S1003-6326(07)60020-X
16. Lee I, Lee SY. Growth of Conductive Indium Tin Oxide (ITO) Nanoparticles by Mineralization in Ring-Shaped Biomimetic
Templates. Journal of Physical Chemistry C.
17. Fukui K, Kanayama K, Katoh M, Yamamoto T, Yoshida H.
Synthesis of indium tin oxide powder by solid-phase reaction
with microwave heating. Advanced Powder Technology.
2009;20(5):488-492. DOI: 10.1016/j.apt.2009.05.007
18. Okuya M, Ito N, Shiozaki K. ITO thin films prepared by a
microwave heating. Thin Solid Films. 2007;515(24):8656-8659.
DOI: 10.1016/j.tsf.2007.03.148
19. Mingos DMP, Baghurst DR. Tilden Lecture. Applications of microwave dielectric heating effects to synthetic problems in
chemistry. Chemical Society Reviews. 1991;20(1):1-47. DOI:
10.1039/CS9912000001
20. Hayes BL. Microwave Synthesis: Chemistry at the Speed of Light. 1st ed. Matthew: CEM Publishing; 2002.
21. Schanche JS. Microwave synthesis solutions from personal
chemistry. Molecular Diversity. 2003;7(2-4):291-298. DOI:
10.1023/B:MODI.0000006866.38392.f7
22. Van Noorden R. Microwaving myths. Chemistry World; 2008. Available
from: <https://www.chemistryworld.com/feature/microwaving-myths/3004691.article#commentsJump>. Access in: 15/12/2017. 23. Maksimov VD, Meskin PE, Churagulov BR.
Hydrothermal-microwave synthesis of fine disperse powders of simple and
complex zirconium and hafnium oxides. Journal of Surface Investigation. X-ray, Synchrotron and Neutron Techniques.
2008;2(1):146-151. DOI: 10.1007/s11700-008-1023-z
24. Keyson D, Volanti DP, Cavalcante LS, Simões AZ, Souza IA, Vasconcelos JS, et al. Domestic microwave oven adapted for
fast heat treatment of Ba0.5Sr0.5(Ti0.8Sn0.2)O3 powders. Journal of Materials Processing Technology. 2007;189(1-3):316-319.
DOI: 10.1016/j.jmatprotec.2007.02.001
25. Hammarberg E, Prodi-Schwab A, Feldmann C.
Microwave-assisted synthesis of indium tin oxide nanocrystals in polyol media and transparent, conductive layers thereof. Thin Solid Films. 2008;516(21):7437-7442. DOI: 10.1016/j.tsf.2008.02.048
26. Kim SM, Seo KH, Lee JH, Kim JJ, Lee HY, Lee JS. Preparation and sintering of nanocrystalline ITO powders with different SnO2 content. Journal of the European Ceramic Society.
2006;26(1-2):73-80. DOI: 10.1016/j.jeurceramsoc.2004.10.009
27. Choi SI, Nam KM, Park BK, Seo WS, Park JT. Preparation and Optical Properties of Colloidal, Monodisperse, and Highly
Crystalline ITO Nanoparticles. Chemistry of Materials.
2008;20(8):2609-2611. DOI: 10.1021/cm703706m
28. Xu H, Zhu G, Zhou H, Yu A. Preparation of Monodispersed Tin-Doped Indium Oxide Powders by Hydrothermal Method. Journal of the American Ceramic Society. 2005;88(4):986-988.
DOI: 10.1111/j.1551-2916.2005.00158.x
29. Toby BH, Von Dreele RB. GSAS-II : the genesis of a modern open-source all purpose crystallography software package. Journal of Applied Crystallography. 2013;46:544-549. DOI:
10.1107/S0021889813003531
30. González GB, Mason TO, Quintana JP, Warschkow O, Ellis DE, Hwang JH, et al. Defect structure studies of bulk and
nano-indium-tin oxide. Journal of Applied Physics.
2004;96(7):3912-3920. DOI: 10.1063/1.1783610
31. Daido T, Akaike T. Electrochemistry of cytochrome c: influence
of coulombic attraction with indium tin oxide electrode. Journal of Electroanalytical Chemistry. 1993;344(1-2):91-106. DOI:
10.1016/0022-0728(93)80048-M
32. Wilberg N, Holleman AF, Wiberg E. Holleman-Wiberg's
Inorganic Chemistry. 1st ed. San Diego: Academic Press; 2001.
33. Vieira L, Schennach R, Gollas B. In situ PM-IRRAS of a glassy
carbon electrode/deep eutectic solvent interface. Physical
Chemistry Chemical Physics. 2005;17(19):12870-12880. DOI:
10.1039/C5CP00070J
34. Socrates G. Infrared Characteristic Group Frequencies: Tables
and Charts. 2nd ed. New York: John Wiley & Sons; 1994.
35. Nobbs JH. Kubelka-Munk Theory and the Prediction of
Reflectance. Coloration Technology. 1985;15(1):66-75. DOI:
10.1111/j.1478-4408.1985.tb03737.x
36. Sabino FP, Nunes Oliveira L, Wei SH, Da Silva JL. Optical and fundamental band gaps disparity in transparent conducting oxides: new findings for the In2O3 and SnO2 systems. Journal
of Physics: Condensed Matter. 2017;29(8):085501. DOI:
10.1088/1361-648X/aa4e8c
37. Burstein E. Anomalous Optical Absorption Limit in InSb. Physical Review. 1954;93(3):632-633. DOI: 10.1103/PhysRev.93.632 38. Moss TS. The interpretation of the Properties of Indium
Antimonide. Proceedings of the Physical Society. Section B.
1954;67(10):775-778. DOI: 10.1088/0370-1301/67/10/306
Supplementary material
The following online material is available for this article:
Figure S1 – Photo of powders synthesized in distinct pHs. The numbers in the images are related to the Table 1
nomenclature.
Figure S2 – FEG-SEM images from samples 3, 4, 5,
6 and 7 which are respectively depicted by Figure a), b),
![Figure 6. Determination of optical band gap of samples 3 to 7 by drawing a line at [F( R ) hʋ] 2 = 0.](https://thumb-eu.123doks.com/thumbv2/123dok_br/16312215.718483/5.765.68.375.413.639/figure-determination-optical-band-gap-samples-drawing-line.webp)
