Head Space-Trap GC-MS method development
and validation for the analysis of volatile
organic compounds in water samples
By
Muhammad Ramzan
Thesis for the degree of European masters in Quality in Analytical
Laboratories
Faro, Portugal
September 2015
Head Space-Trap GC-MS method development
and validation for the analysis of volatile
organic compounds in water samples
By
Muhammad Ramzan
Supervisor:
Maria da Conceição Mateus, PhD
Master Thesis in Quality in Analytical Laboratories
Faculty of Science and Technology, University of the Algarve, Portugal
September 2015
Declaration of authorship
I declare that I am the author of this work, which is original. The work cites the other authors and works which are adequately referred in the text and are listed in bibliography.
The University of Algarve has the right to keep and publicize this work printed copies in paper or digital form or any other means of reproduction to disseminate in the scientific repositories and to allow its copy and distribution with educational and/or research objectives, as long as they are non-commercial and give credit to the author.
Dedication
Acknowledgement
This thesis is written as integral part of Erasmus Mundus masters in Quality in Analytical Laboratories (EMQAL). The experimental work of this thesis has taken place from February 2015 to July 2015 in Water quality lab of Aguas do Algarve (AdA), Tavira, Portugal. A part of the thesis was conducted earlier in October 2014 to November 2014 in the Department of Chemistry and Pharmacy of Faculty of Science and Technology of University of Algarve, Portugal.
My thesis would not have reached its completion without the extended support of my supervisor Maria da.Conceição.Mateus. Her talent and knowledge have greatly inspired me to work through all the obstacles I have faced during the project work.
Thanks to Professor Dr. José Paulo da Silva of Department of Chemistry and Pharmacy whose initial training session made me and an independent and efficient user of both of the GC-MS systems I used during the course of this work.
Special thanks to the management of Águas do Algarve and my colleagues from Aguas do Algarve for their continuous support during the course of this work.
Abstract
A head space solid phase microextraction (HS-SPME)-GC-MS and a head space trap (HS-Trap)-GC-MS method were developed for the analysis of volatile organic compounds (VOCs) in water. The HS-SPME-GC-MS method was developed using 75 µm Car/PDMS fused silica SPME fiber and an Agilent 6890/5973 GC-MS system. A set of 7 chlorinated volatile hydrocarbons (Cl-VHCs) was used during the optimization of the HS-SPME-MS method. The HS-Trap GC-MS method was developed using Perkin Elmer Clarus 500/560 GC-GC-MS with Turbomatrix HS-40 Trap autosampler for the analysis of 8 volatile organic compounds (VOCs): benzene, 1,2-dichloroethane, trichloroethene (TriCE), tetrachloroethene (TetCE), chloroform (CHCl3),
bromoform (CHBr3), dichlorobromomethane (CHCl2Br) and dibromochloromethane (CHBr2Cl).
Performance characteristics the HS-Trap-GC-MS method were established by a method validation study. The obtained method detection limits were found between 0.1 to 0.5 µg/L. The coefficient of determination (R2) was >0.995 for all the compounds. The sensitivities as determined by the slope of the regression line ranged from 0.069 to 1.22. The % RSDs for repeatability, ranged from 2.8 to 18 % and for intermediate precision ranged from 3.7 to 29.5 %. The % recoveries determined, in treated water intended for human consumption, ranged from 101 to 125 %. The coefficient of variation of the method ranged from 1.8 to 4.8 %while the accuracy of the method determined as z-score was less than 2 for all the compounds. However a method validation study needs to be done to establish the performance characteristics of the HS-SPME-GC-MS method.
Resumo
Neste trabalho foram implementados dois métodos para a análise de compostos orgânicos voláteis (VOCs) em água por cromatografia gasosa associada à espectrometria de massa. Designadamente, por microextração em fase sólida em espaço de cabeça (HS-SPME)-GC-MS e armadilha de espaço de cabeça (HS-Trap)-GC-MS.
O método HS-SPME-GC-MS foi desenvolvido utilizando fibras SPME de silica fundida com revestimento de Car/PDMS 75 µm e um sistema Agilent 6890/5973 GC-MS e foi otimizado o método para a análise de 7 compostos orgânicos voláteis. O método por HS-Trap GC-MS foi desenvolvido utilizando um sistema Perkin Elmer Clarus 500/560 GC-MS com amostrador automático Turbomatrix HS-40 Trap para a análise de 8 VOCs: benzeno, 1,2-dicloroetano, triclroeteno, tetracloroeteno, cloroformio, bromoformio, diclorobromometano e dibromoclorometano. As características de desempenho do método por HS-Trap-GC-MS foram estabelecidas através do estudo de validação do método. Os limites de deteção obtidos situaram-se entre 0,1 e 0,5 µg/L. O coeficiente de determinação (R2) foi superior a 0,995 para todos os compostos. A sensibilidade do método, determinada a partir do declive da reta de regressão linear, apresentou uma amplitude de 0.069 a 1.22. A % RSDs expressa em termos de repetibilidade, variou de 2,8 a 18 % e expressa em termos de precisão intermédia variou de 3,7 a 29,5 %. As percentagens de recuperação foram determinadas para todos os compostos em água tratada para consumo humano, apresentando valores entre 101 e 125 %. O coeficiente de variação do método variou de 1,8 to 4,8 sendo a exatidão do método, determinada a partir do cálculo do "z-score", inferior a 2 para todos os compostos. A validação do método necessita contudo de um estudo experimental mais alargado para confirmar as características de desempenho do método de análise por HS-SPME-GC-MS.
Executive Summary
This thesis is divided into 6 sections: 4 chapters, references and annexures.
Chapter 1 includes problem statement, background information on the subject matter and objectives of the study, gives an overview of the existing methodologies for the analysis of volatile hydrocarbons, explanation of the methodology used in the current study, an insight into validating analytical methodologies, importance and requirements of the method validation studies.
Chapter 2 details materials, standards and solution preparations and all the experimental work conducted to achieve the objectives of the study.
Chapter 3 details the findings of the study on the head space-trap (HS-Trap)-GC-MS method development and validation. The results are discussed and concluded in the same chapter. Chapter 4 includes work carried out in the department of Chemistry and Pharmacy of Faculty of Sciences and Technology of University of Algarve. The aim of the work was to develop and validate a head space solid phase microextraction (HS-SPME)-GC-MS method for the analysis of chlorinated volatile hydrocarbons (Cl-VHCs) in water and waste water samples. The work was stopped unfinished due to the breakdown of MS turbo-molecular pump. However preliminary results are presented and discussed here.
List of Abbreviations
DC Direct current
EC European commission
EI Electron ionization
ECD Electron capture detector
ELCD Electrolytic conductivity detector
eV Electron volt
HS Head space
HS-SPME Head space solid phase microextraction HS-Trap Head space trap
ISO International organization for standardization
kPA kilo pascals
LOD Limit of detection LOQ Limit of Quantification MRM multiple reaction monitoring
mm millimeter
MSD Mass spectrometric detector
m/z mass/charge
PMT photomultiplier tube P&T Purge and Trap
psi pound square inch
RF Radio frequency
SPME Solid phase microextraction Sres residuals standard deviation
SIM Selected ion monitoring
THMs Trihalomethanes
USEPA United States environment protection agency VOCs Volatile organic compounds
List of Figures
Figure 1 Turbomatrix HS Trap during trap load (Barani, Dell'Amico et al. 2006). ... 9
Figure 2 Schematic of a simplified gas chromatograph ... 12
Figure 3 Schematics of mass spectrometric operation with EI as the ion source and quadruple mass analyzer ... 15
Figure 4 Principle and Scheme of a quadruple mass analyzer. ... 17
Figure 5 Perkin Elmer Clarus 560 MS tune parameters ... 37
Figure 6 Overlaid SIM Chromatogram for the target compounds and internal standards ... 43
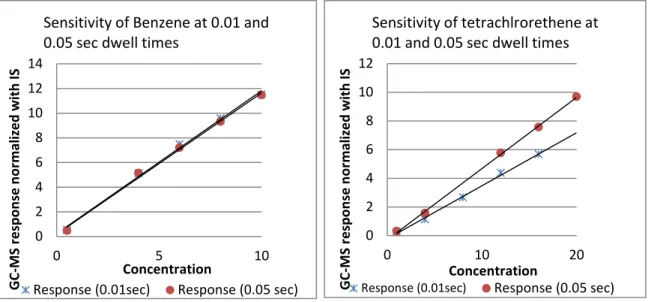
Figure 7. Sensitivity at different dwell times. ... 46
Figure 8 Calibration curves obtained when working standard solution was prepared in water... 48
Figure 9. HS-Trap extraction efficiency with standards at pH<2 and without any acid addition .. 49
Figure 10 Effect of carbonate addition on the HS-Trap-GC-MS analysis of TetCE. ... 49
Figure 11 The regression line for benzene with its confidence band. ... 50
Figure 12 Plot of calibration data along with regression line left side) and plot of residuals (right side) for benzene. ... 51
Figure 13 SIM chromatograms with S/N ratios of the VOCs at the lowest standard concentrations in the working range. ... 54
Figure 14 GC separations achieved during SPME-GC-MS method development ... 66
Figure 15 Optimization of fiber exposure time using Head space SPME for the extraction of Cl-VHCs.. ... 67
Figure 16 pH and salt out effect on the extraction efficiency of the HS-SPME operation ... 67
List of Tables
Table 1 Columns used for VOCs analysis ... 14
Table 2 Preparation of mixed standard stock solution ... 33
Table 3 Working standard solution concentration ... 33
Table 4 Preparation of calibration standards ... 34
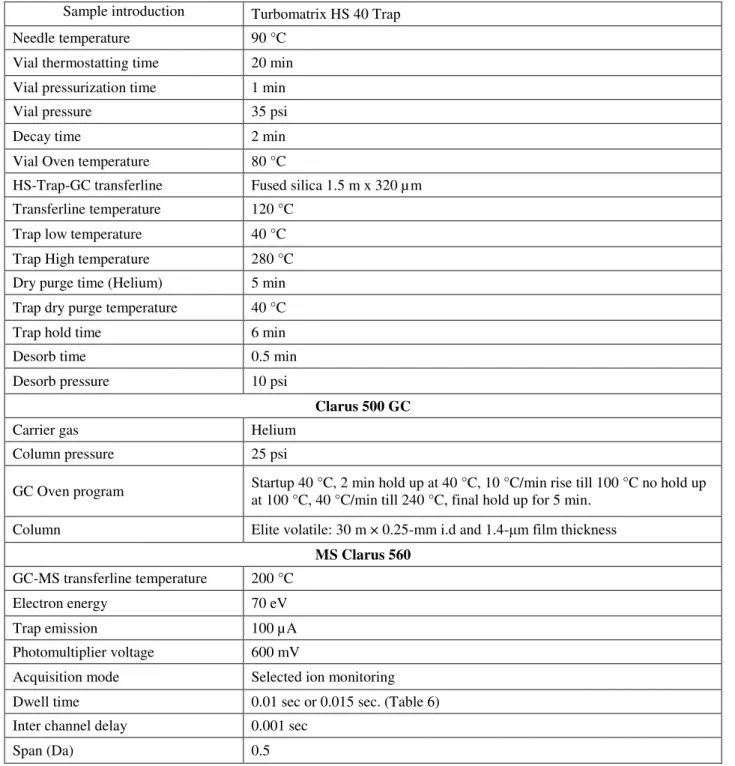
Table 5 HS-Trap-GC-MS Conditions for validation study ... 36
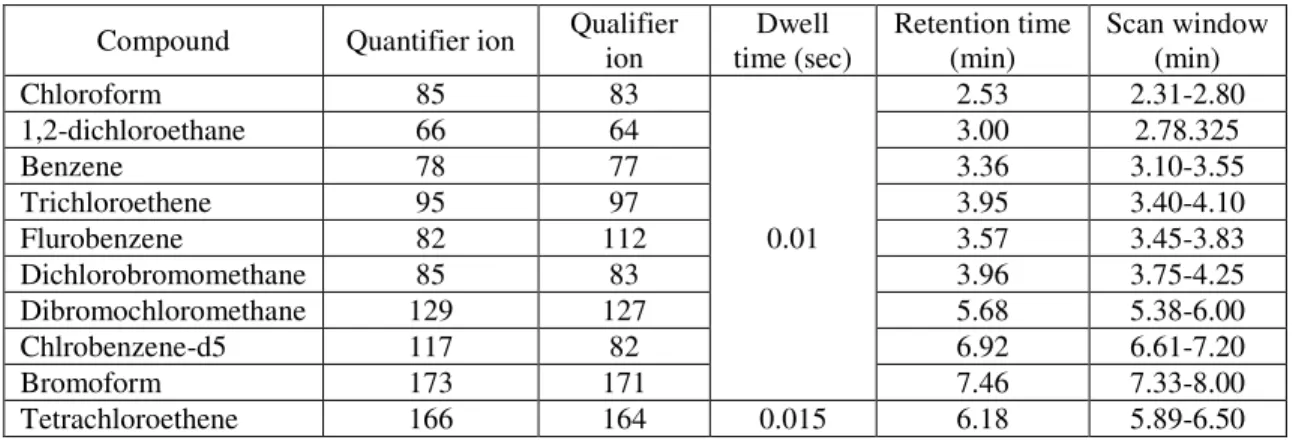
Table 6 MS Acquisition parameters for qualification and quantification ... 37
Table 7 Preparation of recovery samples ... 40
Table 8 Coefficients of the calibration functions ... 50
Table 9 Results of statistical test for linearity ... 52
Table 10 The HS-Trap-GC-MS method detection and quantification limits estimated in bottled drinking water at standard concentrations: THMs= 4 µg/L , benzene=0.5 µg/L and 1,2-dichloroethane, TriCE and TetCE at 1 µg/L standard solution ... 53
Table 11 Sensitivity of the method for the VOCs ... 55
Table 12 Test PG values for homogeneity of variances ... 55
Table 13 Repeatability and intermediate precision ... 56
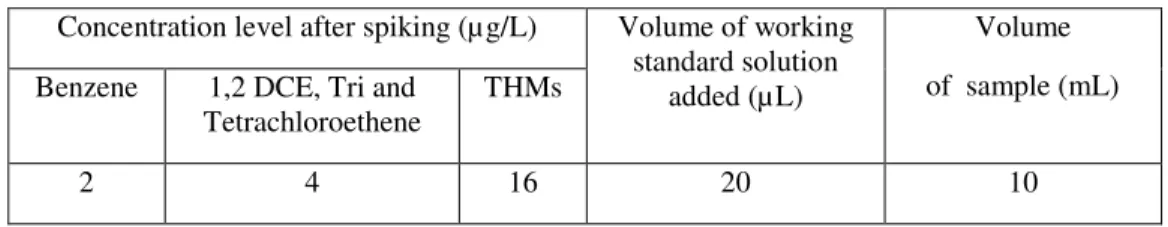
Table 14 The % Recoveries at 2ppb Benzene, 4 ppb 1,2-DCE, TriCE and TetraCE, 16 ppb THMs ... 57
Table 15 Results for real water samples analysis ... 58
Table 16 Summary of the HS-Trap-GC-MS method performance characteristics ... 60
Table 17 MS data acquisition on 5973 MSD: SIM parameters ... 64
TABLE OF CONTENTS
Problem statement ... 1
Objectives of the study ... 2
HS-Trap-GC-MS ... 2
HS-SPME-GC-MS ... 2
1 Theoretical Background ... 3
Methodologies for the analysis of VOCs ... 3
1.1 Extraction and Pre-concentration Techniques ... 3
1.1.1 Dynamic headspace or Purge and Trap (P&T) ... 4
1.1.2 Static Head Space (HS) ... 5
1.1.3 Fiber Solid Phase Microextraction (SPME) ... 6
1.1.4 Head Space-Trap (HS-Trap) ... 8
1.2 Gas chromatography-Mass Spectrometry (GC-MS) for VOCs Analysis ... 11
1.2.1 Gas Chromatography ... 11
1.2.2 GC Detectors for VOCs analysis ... 14
1.2.3 Mass spectrometry ... 15
1.3 Validating Analytical Methodologies ... 18
1.3.1 When to validate a method ... 18
1.3.2 Components of Method Validation ... 19
2 Experimental Part (HS-Trap-GC-MS) ... 32
2.1 Chemicals and Reagents ... 32
2.2 Materials and Instrumentation ... 32
2.3 Analytical Procedures ... 32
2.3.1 Preparation of stock and working standard solutions ... 32
2.3.2 Sampling and sample collections ... 34
2.3.3 Method development and Optimization HS-Trap-GC-MS conditions: ... 34
2.3.4 pH effect on extraction efficiency of HS-Trap opeartion ... 35
2.3.5 Optimized HS-Trap GC-MS method ... 35
2.4 Method Validation ... 38
2.4.2 Linearity ... 39
2.4.3 LODs and LOQs of the method ... 39
2.4.4 Precision ... 39
2.4.5 Working range ... 40
2.4.6 Sensitivity ... 40
2.4.7 Recovery ... 40
2.4.8 Accuracy ... 41
2.4.9 Quantification of Real Water samples ... 41
3 Results and Discussion (HS-Trap-GC-MS) ... 42
3.1 Method Development and optimization ... 42
3.1.1 Chromatographic Separations ... 42
3.1.2 Head Space-Trap (HS-Trap) ... 43
3.1.3 MS Quantification ... 45
3.1.4 Calibration standards and sample preparation ... 46
3.2 Method validation Results ... 50
3.2.1 Calibration ... 50
3.2.2 Linearity ... 51
3.2.3 LODs and LOQs ... 52
3.2.4 Sensitivity ... 54
3.2.5 Working range ... 55
3.2.6 Precision ... 56
3.2.7 Accuracy ... 56
3.2.8 Recovery ... 56
3.2.9 Real Water Analysis ... 57
3.3 Interferences ... 58
3.3.1 Leak Problems ... 58
3.3.2 Aged photomultiplier tube in the MSD ... 59
3.3.3 Summary of Method Performance characteristics ... 60
3.4 Conclusions ... 61
4.1 Experimental ... 63
4.1.1 Reagents and Materials ... 63
4.1.2 Apparatus and Instruments ... 63
4.1.3 Solutions ... 63
4.1.4 HS-SPME sample preparation ... 64
4.1.5 MS Data Acquisition ... 64
4.2 Results (HS-SPME-GC-MS method development and optimization) ... 65
4.2.1 GC separations ... 65
4.2.2 SPME Optimization ... 66
4.2.3 pH and salt out effect on HS-SPME operation ... 67
4.2.4 Optimization of ion source temperature ... 68
4.3 Interferences ... 68
4.4 Conclusion ... 69
4.5 Further Work ... 69
5 References ... 70
Problem statement
European Union Directive (2004/42/EC) defines volatile organic compounds (VOCs) as organic compounds with boiling points below 250 °C at a standard atmospheric pressure of 101.3 kPa. VOCs found in surface or ground waters are grouped into three categories based on their origin:
1. Chlorinated solvents 2. Fuel components 3. Disinfection byproducts
Most of the VOCs enter water bodies mainly from careless industrial practices of effluent discharge. Chlorinated solvents found in ground waters have sometimes been traced to sources such as home septic tanks, municipal landfills, hazardous waste dumps and industrial facilities. Accidental spills from fueling operations, leaking gasoline pipelines, leaking gasoline storage tanks, storm water runoff, and atmospheric inputs may be the sources of fuel components found in water bodies. Trihalomethanes (THMs): chloroform (CHCl3), bromoform (CHBr3),
dichlorobromomethane (CHCl2Br) and dibromochloromethane (CHBr2Cl), are formed in water
when chlorine combines with naturally occurring organic material, such as decomposing leaves or animal waste. Since groundwater rarely contains high levels of organic matter, chlorinated private water supplies whose source is groundwater are less susceptible to the formation of THMs. The THMs are most often found in chlorinated surface waters used for public drinking water supplies (USEPA 2009).
VOCs have adverse effects on human health, even at very low concentrations, as they have toxic, carcinogenic or mutagenic properties (Richardson, Plewa et al. 2007; Lopez, Schuhmacher et al. 2008; Fan, Wang et al. 2009; USEPA 2009). That’s why analytical monitoring of VOCs in drinking water is a subject of concern for many researchers today. Regulatory values of 9 VOCs in drinking water were established by European Directive of 1998 in European Union; sum of the 4 THMs =100 µg/L, 1,2-dichloroethane=3 µg/L, benzene=1 µg/L, trichloroethene (TriCE) and tetrachloroethene (TetCE)-total= 10µg/L, vinyl chloride= 0.5 µg/L.
Objectives of the study
The major objectives of the study were followings:HS-Trap-GC-MS
Development and validation of a HS-Trap-GC-MS method using Perkin Elmer Clarus 500/560 GC-MS system and Turbomatrix HS-Trap 40 autosampler. The method should be based on USEPA method 8260 B for the simultaneous determination of 8 VOCs in water samples and should meet the regulatory requirements of Council Directive 98/83/EC of 3 November 1998 on the quality of water intended for human consumption. The EU Directive specifies 9 VOCs, 1,2-dichloroethane, trichloroethene (TriCE), tetrachloroethene (TetCE), benzene, chloroform (CHCl3), bromoform (CHBr3),
dibromochloromethane (CHBr2Cl), dichlorobromomethane (CHCl2Br) and vinyl chloride.
Vinyl chloride was not attempted in this study because is very volatile and may involve different instrumental parameters.
HS-SPME-GC-MS
Development and validation of a HS-SPME-GC-MS method for the analysis of 7 chlorinated VOCs in ground water samples using 75µm Carboxen/polydimethylsiloxane fused silica SPME fiber and Agilent 6890/5973 GC-MS system.
1
Theoretical Background
Methodologies for the analysis of VOCs
This section reviews the most common analytical methods applied for the determination of VOCs in water samples. Gas chromatography (GC) is a widely applicable technique with flame ionization detector (FID), electron capture detector (ECD) (Popp and Paschke 1997), electrolytic conductivity detector (ELCD) or coupled with mass spectrometry (MS) for the determination of VOCs in water samples. However elimination of water before chromatographic run is the main requirement and needs an extraction step. The VOCs are found in natural and drinking waters in the range of ng/L to µg/L and that necessarily requires a pre-concentration step to achieve a concentration level of analyte that falls in measurement range of the analytical instrument. Sensitive analytical methods are required to meet regulatory requirements, to estimate human exposure to VOCs and to optimize current drinking water treatment practices by chlorination. It is sample preparation step which mainly determines analytical performance, simplicity of optimized method and time of analysis (José Luis Pérez Pavón 2008). The following review focuses on most commonly applied extraction techniques, chromatographic columns and detectors for routine analysis of VOCs in water samples.
1.1
Extraction and Pre-concentration Techniques
Dynamic head space or Purge and trap (P&T), static headspace or simply headspace (HS) and solid-phase microextraction (SPME) have mainly been applied for extraction and pre-concentration of VOCs from water samples (José Luis Pérez Pavón 2008). Each technique has its own advantages and disadvantages. A mini review on the P&T, HS and SPME is presented below. Section 1.1.4 explains the working principle of headspace-trap (HS-Trap) autosampler which was used in this study. A mini review of the main sample extraction and pre-concentration techniques is given below.
1.1.1
Dynamic headspace or Purge and Trap (P&T)
Purge and Trap (P&T) in combination with gas chromatography was 1st described by Swinnerton and Linnebom in 1962 (Swinnerton 1962). An inert gas is bubbled through a 5 mL water sample contained in a specially-designed purging chamber at ambient temperature. The VOCs are efficiently transferred from the aqueous to the vapor phase and swept through a sorbent trap with the purge gas where the VOCs are adsorbed. After purging is complete, the trap is heated and back flushed with the carrier gas to desorb the VOCs onto a gas chromatographic column.
Owing to its exhaustive extraction nature, purge and trap (P&T) is generally believed to provide lower LODs and it is the most usual choice in environmental laboratories for the extraction and pre-concentration of volatile organic compounds in surface, ground, and wastewater samples. USEPA methods 502.2, 524.2, 601, 624, 8260 B and many other standard methods for the analysis of VOCs are based on P&T concentrators.
Apart from complex instrumentation of P&T, the methodology has some important limitations. Purging causes evaporation of water thus water is inevitably transferred to the GC during the trap desorption step. However the current designs of purge and trap systems include dry purge cycle (Restek Corporation 2003) to eliminate water prior to the analytes are desorbed to GC column which further increases the analysis time. Moreover, the system is prone to carry-over effects and it is necessary to clean the system between every sample. The device must be washed, rinsed with distilled water, and dried before the analyses of next sample. Reagent blanks are often required to make sure sample to sample carry over effect has been eliminated which decreases the sample throughput of the system. Samples containing analytes at concentrations greater than 200µg/L can saturate the trap and contaminate the lines and other parts of the system which requires the trap and other parts of the system must be baked and purged resulting in increased downtime to clean the system. To avoid such severe problems a pre-screening step is required which requires extra efforts.Impurities in the purge gas may also be a major interference (Supelco 1998).
Another important limitation is incompatibility of P&T with the mass spectrometer (MS) operations under high vacuum conditions. Efficient removal of VOCs from the trap, during desorption step, requires carrier gas flow rates greater than 5mL/min which demands long wide bore capillary columns (0.53 mm internal diameter) which also results in longer analysis times
because of greater lengths of GC columns. Using jet separators after wide bore columns allows use of an MS but increases the detection limits. Narrow bore capillary columns are best suited for MS operations but capillary column can be operated under maximum carrier gas flow rate of 2mL/min which is also under the limitations of mass spectrometer (Restek Corporation 2003). Splitting the flow after the trap makes it possible to use a narrow bore capillary columns but splitting the flow can greatly decrease the amount of analytes entering the column by 90-95 % which obviously results in increased detection limits like jet separators (Supelco 1998). Cryofocusing or cold trap (secondary trapping) at very low temperatures like -160 °C, offers another possible replacement of jet separators but increases both cost and analysis time (Restek Corporation 2003).
1.1.2
Static Head Space (HS)
Static headspace may be the simplest technique; it is fast and may not require expensive materials or extensive laboratory work when gas tight syringe is used to transfer head space volumes for chromatographic run. However reproducibility issues are main concern with this technique because of possible sample loss. As the sample is transferred from the vial to the injection port, some of it may be lost because of the pressure differences between the vial and atmospheric conditions. A HS autosampler based on balanced pressure system (balanced pressure system explained in section 1.1.4, step 1-3) on the other hand provides excellent repeatability and reproducibility as the number of moving parts are minimized which decreases the chance for compound adsorption and loss via leaks. Head space autosamplers based on fixed loop systems are prone to carry over effects and may cause ghost peaks (Restek Corporation 2000).
Headspace (HS) is partial equilibrium technique and furthermore a portion of HS aliquot of volatiles is sampled which is 1 mL, 2mL or whatever the size of sample loop. Head space equilibrium is also greatly affected by the sample matrix (Restek Corporation 2000). Due to these limitations, sometimes the achieved LODs are not enough to comply with some environmental regulations, for example in case of benzene, the LOD cannot be achieved below 0.5µg/L (Barani, Dell’Amico et al. 2006). When more volume of aliquot is injected into GC to achieve lower detection limits, it results in the loss of resolution due to band broadening effect. Cryogenic focusing strategies are being applied to avoid band broadening effect. When Cryogenic focusing
column and achieve better detection limits even equal or better than those achieved by P&T. (José Luis Pérez Pavón 2008). One such cold trap is cold trap 9000 (Brechbühler, Switzerland). However, the use of cold traps further increases cost, time of the analysis and productivity of an analytical laboratory.
1.1.3
Fiber Solid Phase Microextraction (SPME)
Fiber solid phase microextraction or simply known as solid phase microextraction (SPME) technique is explained here in more details as a part of the master project was done using SPME as sample preparation technique (chapter 4). Solid phase micro-extraction involves the extraction of analytes from the sample matrix to a liquid or solid coating supported on glass or fused silica fiber. The transport of the analytes begins as the coated fiber is brought in contact with the sample. When the distribution equilibrium is achieved, it is considered that the maximum extraction is achieved because once the equilibrium is achieved there is no net gain in the quantity of the analytes extracted by the fiber. The quantity of the analyte extracted by the fiber is directly proportional to the initial concentration of the analyte in the sample. The fiber is then analyzed to determine the concentration of the analyte in the sample. The extraction can be interrupted prior to equilibrium at some fixed interval and the fiber can be analyzed. The latter determinations are called pre-equilibrium determinations. Equilibrium determinations are easy to perform. To get reproducible data in pre-equilibrium determinations, constant agitation conditions, temperature and careful extraction timings are required (page 15 (Pawliszyn 1997)). Since SPME is an equilibrium technique, the extraction by the fiber is not exhaustive. The fiber extracts a very small amount of the analyte from the matrix, which becomes a barrier to achieve very detection limits. However, this makes SPME a special and very useful for studying the natural systems where it can facilitate speciation without disturbing the equilibrium of the system. SPME is performed in following three modes depending on the volatility of the analyte and the nature of the matrix (page 16 (Pawliszyn 1997)):
1. Direct Immersion SPME: In the direct immersion mode SPME fiber is directly inserted in the sample and the transport of the analyte is directly from the sample matrix to the fiber. The position of the fiber while immersed in the sample matrix does not make any difference as the
quantity of the analyte extracted is always the same, if all other conditions are kept constant. Direct immersion mode is referred as DI-SPME.
2. Headspace SPME (HS-SPME): In the head space mode, the analytes are transported to the fiber through the air above the sample matrix. It allows protection of the fiber from the interferences due to sample matrix. It also allows modifications in the sample matrix, like pH changes, without damaging the fiber. The position of SPME fiber, in the headspace, may significantly affect the extraction efficiency of the HS-SPME operation.
3. Membrane protected SPME: The SPME fiber can be closed in semi permeable membrane, which can allow the transport of the analyte molecules to and from, avoiding the large molecular weight interferences from the sample matrix. The large molecular weight compounds can adsorb to the fiber surface making it partially or totally unavailable for interactions with the analyte molecules.
Nature of the coating material and thickness of the coating, temperature, agitation condition, pH, salt concentrations are the important parameters for SPME. Selection of the coating material depends on the nature of the analyte. Polydimethylsiloxane (PDMS) is widely used coating material for non-polar hydrophobic organic compounds like PAHs. Thickness of the coating affects the equilibrium time or speed of the analysis. The total amount extracted by the fiber depends on the volume of coating of the extraction material. Agitation conditions affect the mass transfer rate and equilibrium time between fiber coating and the analytes in the sample (page 89 (Pawliszyn 1997)). Temperature is very important parameter and affects the coating/sample distribution coefficient of the analyte and extraction efficiency. Salt concentration and pH affect SPME in similar fashion to solvent extraction (page 24 (Pawliszyn 1997)).
SPME was invented by Pawliszyn and Belardi (R.P Berlardi 1989) and became commercially available in 1993. SPME is fast, easy and compatible with narrow bore GC capillary columns. Even though SPME is relatively new technique but it is evolving rapidly. The development and availability of commercial autosampler devices such as TriPlus (Thermo Fisher scientific; Milan, Italy), Combi-PAL (CTC Analytics; Zwingen, Switzerland), MPS 2 (Gerstel Inc.; Mulheim and der Ruhr, Germany) made it possible to further increase the sample throughput (Spietelun, Marcinkowski et al. 2013).
SPME is well suited for a wide range of concentrations. Like head space, SPME is also equilibrium or partial extraction technique but may offer better detection limits than head space depending on the type and thickness of the fiber coating. Many studies have been carried out to find out the most suitable polymeric coating for the target compounds. A carboxen/polydimethylsiloxane (CAR/PDMS) fiber has the best extraction efficiency and sensitivity (Cho, Kong et al. 2003; Garcia-Esteban, Ansorena et al. 2004; O'Reilly, Wang et al. 2005) but a 100 µm PDMS fiber offers a wider range of linearity (Nakamura and Daishima 2005; Spietelun, Marcinkowski et al. 2013). A PDMS/DVB is a better choice in terms of repeatability along with better detection limits and broader linear range (San Juan, Carrillo et al. 2007). A DVB/CAR/PDMS provides narrower chromatographic peaks and better chromatographic resolutions (Lara Gonzalo)(José Luis Pérez Pavón 2008). In spite of being widely used, these fibers still have some drawbacks such as lower thermal and chemical stability, high cost, less reusability (less than 100 times).
SPME as compared with P&T meets the thresh hold limits but cannot compete in analytical performance especially LODs and precision. SPME produces higher broadening of peaks hence less chromatographic resolution as compared with P&T (Lara-Gonzalo, Sanchez-Uria et al. 2008).
1.1.4
Head Space-Trap (HS-Trap)
In the HS-T methodology, sample vapors from a head space vial are transferred to the trap by using balanced pressure principle. The analytes adsorbed to the trap are desorbed by rapid heating of the trap to high temperatures while passing the career gas flow through the trap to the column.
Figure 1 shows simplified schematics of a HS-T operation during trap load. The analysis sequence
of HS-T system is described below step by step:
1. Equilibration
A HS vial with the sample is heated in the incubation oven to a fixed temperature for a set constant time called “thermostattation time” in order to reach equilibration between the sample and its vapors in the headspace. The heating temperature is defined by the sample characteristics.
2. Pressurization
After equilibration, the vial is pressurized to a suitable pressure. Vial pressurization is done by a needle which pierces the septum and allows the carrier gas at a pre-set pressure to enter the vial to set the internal pressure to a particular value termed as “vial pressure”.
Figure 1 Turbomatrix HS Trap during trap load (Barani, Dell'Amico et al. 2006). Vapors from the HS vial, mixed with career gas, flow towards the column but column isolation flow prevents the branching of the flow from the vial to the column. The gaseous mixture from the vial ends up in passing only through the trap where VOCs get adsorbed.
3. Trap load
After vial pressurization, a solenoid valve interrupts the carrier gas flow towards the GC column. The pressurized vial then acts as a reservoir of the carrier gas (mixed with sample vapors) towards the column. A column isolation flow, also provided by the carrier gas reservoir, prevents branching of the decay flow to the GC column resulting in a flow of the mixed head space gas from the vial to the trap only and lasts until the pressure in the vial has decayed to its lowest value (decay time). This trap load step can be repeated up to four times for each vial. The number of times vial pressurization and trap load is performed per vial is termed as “cycle number” (Perkin Elmer Inc. 2008). The trap load step in HS-Trap methodology is illustrated in Figure 1. Keeping the transfer line and the analytical column pneumatically isolated constantly supplied with an isolation carrier gas flow during sample preparation by a pressurized vial is known as balanced pressure HS system.
4. Trap dry-purge
After vapor extraction is complete, the cold loaded trap is purged with dry carrier gas to remove moisture from the trap. The moisture to the trap is not avoidable even if the adsorbent material is mostly hydrophobic and the vial equilibration temperature is kept low. Moisture can damage the capillary column and worsen the detection limits by increasing the baseline. The amount of time needed for the dry purge is termed as “dry purge time” which depends on the type of sample and the HS-Trap “cycles number”. Higher number of Trap re-loadings and higher HS oven temperature gives rise to more moisture to the trap.
5. Trap desorb and trap hold
After dry purge is complete, the trap temperature is rapidly increased to a desired high value (desorb temperature) to release the trapped analytes. It is kept at that value for a specified time (Trap hold time) to clean it, avoiding any possible carry-over. A recommended trap hold time is five minutes. As soon as the trap is heated, the column isolation is stopped and the GC run begins. The trap is desorbed in the backflush mode with an optional split provided in the trap desorb flow. The HS-Trap pneumatics provides flow from the other end of the trap as well for backflushing the trap during the trap desorb. The trap desorb flow is generally set to 50 mL/min. If a split, in the desorb flow, is required for GC-MS analysis, the outlet split allows a fixed split flow of 15 mL/min. This is equivalent to split/splitless injection but the change in the split ratio is not accessible to the user in this case.
Combining head space with SPME (HS-SPME) offers greater sensitivity over simple head space sampling by concentrating the analytes in the extraction phase for GC analysis but analytical precision is better in case of simple headspace-GC analysis (Flórez Menéndez JC 2004). Combining balanced pressure head space extraction with a trap (PerkinElmer, Wellesley, MA) offers the potential to achieve good detection limits like purge and trap systems and a very good repeatability and reproducibility. HS-Trap system is relatively simple compared with purge and trap systems. Avoidance of purge gas eliminates interferences caused by impurities in the purging gas. Unlike P&T systems, trap in HS-Trap system is less prone to accumulation of water because there is no purging which causes relatively more evaporation of water compared with head space. Analytical methods based on HS-Trap-GC-MS offer the opportunity to simulate the standard methods based on purge and trap and GC methodology (Griffith 2004). Along with several
advantages, the use of trap in HS-Trap still requires pre-screening in order to avoid contamination of trap from samples with high concentrations of analytes. However, the presence of spilt vent in the HS-T system minimizes efforts to dilute samples found to be highly contaminated during pre-screening, if the split vent option is used in the HS-Trap system.
1.2
Gas chromatography-Mass Spectrometry (GC-MS) for VOCs
Analysis
GC-MS is a hyphenated technique which couples the good separation quality of gas chromatography with excellent qualitative and quantitative capabilities of mass spectrometry. The coupled GC-MS technique was pioneered in the 1950’s by Fred W. McLafferty and Roland S. Gohlke (Gohlke and McLafferty 1993) and has since found a wide range of applications. Compared to other hyphenated chromatography and spectroscopic techniques (e.g. CE-MS, LC-MS and LC-NMR), GC-LC-MS offers low costs and unsurpassed chromatographic reproducibility and resolution. Principles of gas chromatography and mass spectrometry are explained below separately.
1.2.1
Gas Chromatography
Gas chromatography (GC) is an important analytical method widely used in laboratories around the world. It’s a frequently used method to separate and analyze volatile compounds ranging from 2 to above 1000 Da (McNair H.M. and Miller J.M 2011).
In gas chromatography, a column is the central part of the chromatographic system. The stationary phase inside the column is a solid or a liquid coated on a solid support or directly on the column wall. When a sample, introduced into the column, is swept through the column with a carrier gas, analytes in the sample are separated based on differences in their vapor pressures and differences in their interactions with the stationary phase in the column (page 80 (C.F Poole 2003)). Basic components and schematics of a gas chromatograph are shown in Figure 2 and
Figure 2 Schematic of a simplified gas chromatograph (page 8 (McMaster 2008)
1.2.1.1
Carrier gas
In GC an inert gas such as nitrogen, helium or hydrogen is used as carrier gas and the main function of which is to carry the sample through the column. The choice of carrier gas is based on efficiency, availability, cost and safety as well as compatibility with the detector. The carrier gas reservoir is connected to the system at the sample injection chamber where the carrier gas is mixed with the sample vapor. The carrier gas flow is controlled by a flow controller or pressure regulator placed between the carrier gas reservoir and the sample injection chamber, (page 83-86 (C.F Poole 2003)).
1.2.1.2
Sample inlet
In typical GC, a sample is introduced into an injection chamber also termed as sample inlet which provides means by which the sample is vaporized and mixed with carrier gas prior to the start of the separation in the column. Various inlet types are available specific to the type of column and chromatographic application. The inlet should facilitate sample introduction into the column without reduction of the separation potential of the column; without thermal degradation, adsorption or rearrangement of sample components; without discrimination of sample components by boiling point, polarity or molecular weight; and with quantitative recovery for both trace and major sample components. It is also preferable that changes in the column operating conditions should not affect the sampling process. There is no universal inlet design
which can manage the full range of gas chromatographic applications and column types (page 180 (C.F Poole 2003)).
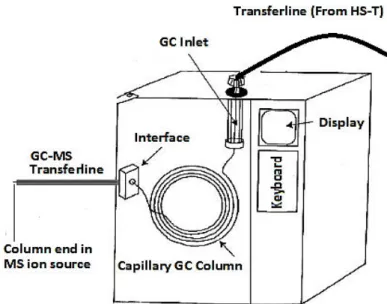
In the HS-Trap methodology, a HS-Trap autosampler can be connected to the GC in 3 ways. In the “on-column” configuration, capillary column is directly connected to the head of HS-Trap autosampler by passing through the GC inlet and transferline. In the “direct operation” configuration, HS-Trap transferline is passed through the GC inlet and connected to the GC column inside the oven. The third configuration, involves the HS-Trap transferline connection to the GC inlet. The column is connected to the GC inlet in usual configuration. For HS-Trap operations, the third mode is not generally recommended by the instrument manufacturer because of the complexity of the chromatography pressures and flows involved (page 60,61(Perkin Elmer Inc. 2008)).
1.2.1.3
Column
There are two main types of columns usually used in GC, packed columns and open tubular (capillary) columns. Packed columns contain a finely divided solid support material coated with the liquid stationary phase (page 33 (C.F Poole 2003). They range in size from 1 to 5 m in length and 2-4 mm in diameter. A typical capillary column used for GC is a coiled capillary tube of fused silica with an internal coating of stationary phase (page 10 (McMaster 2008)). Capillary columns used in GC have a length ranging from 10 to 100 meters and can further be divided into two groups based on their inner diameter (i.d): wide bore capillary columns (i.d≥0.53 mm) and narrow bore capillary columns (i.d ≤0.5) (page 393(Robert L. Grob 2004)). In general, fused-silica capillary columns applied for VOCs analysis have a dimethylpolysiloxane stationary phase (non-polar). It can be combined with different phenyl or cyanopropylphenyl groups, achieving different degrees of polarity suitable for different sample matrices for the analysis of VOCs. (José Luis Pérez Pavón 2008). Bonded and cross-linked stationary phases provide thermal stability and increase column life by avoiding loss of stationary phase due to evaporation while working at higher temperatures which can be as high as 400 ˚C. Loss of stationary phase due to evaporation is called Column bleeding which can offer problems in chromatographic separations and detection of the analytes. Ideally, a stationary phase in GC column should have a boiling point of more than 100 ˚C higher than the maximum working temperature (Douglas A. Skoog 2007).
Narrow bore capillary columns provide better separations than wide bore capillary columns and are compatible with MS operations but due to their smaller diameters they have low sample capacity. Sample capacity of an analytical column increases with increased diameter. Wide bore capillary columns due to larger diameters provide more sample capacity. Environmental samples with high analyte concentrations are better analyzed with wide bore columns. Table 1 lists common columns and stationary phases used for VOCs analysis.
Table 1 Columns used for VOCs analysis (H.J Th. Bloemen 2012)
Type of column Stationary phase composition Polarity temperature Operating °C
Packed column
SP-2100 100% Dimethylpolysiloxane non polar 0 to 180
OV-17 50% Diphenyl, 50% Dimethylpolysiloxane mid polarity -10 to 150
SP-1000 Polyethylene glycol ester Very polar 40 to 220
Capillary columns
Elite volatile 5% phenyl, 95% dimethyl polysiloxane non polar -20 to 260
OV-1 100% dimethylpolysiloxane non polar 40 to 130
ZB-5MS 5% phenyl, 95% dimethyl polysiloxane non polar -60 to 350
SE-54 5% phenyl, 95% dimethyl polysiloxane non polar 20 to 120
SE-52 5%-Phenyl)-methylpolysiloxane low polarity 50 to 220
Ucon HB 5100 Polyethylene/polypropyleneglycol ethers Polar 25 to 175 VOCOL (20%) Diphenyl - (80%) Dimethylpolysilioxane Intermediate 10 to 120 DB-624 6%Cyanopropyl-phenyl,94%dimethylpolysiloxane low to mid polar 5 to 115
1.2.2
GC Detectors for VOCs analysis
The electron capture detector (ECD) and electrolytic conductivity detector (ELCD) are highly specific for halogenated compounds. Generally, these detectors provide good limits of detection for the analysis of halogenated compounds in water samples but there is always a need of second chromatographic column when analyzing environmental samples to make sure that there was no co-elution and the peak response is just because of the analyte. Furthermore simultaneous analysis of non-halogenated VOCs is not possible along with the halogenated VOCs using ECD or ELCD alone. A mass spectrometric detector (MSD) S is a universal detector and is capable to correctly quantify the analyte response even though there are coelutions with the target analyte. A
rapid qualitative identification of analytes is possible by comparison of their mass spectra with those in a library of spectra of known compounds (José Luis Pérez Pavón 2008).
1.2.3
Mass spectrometry
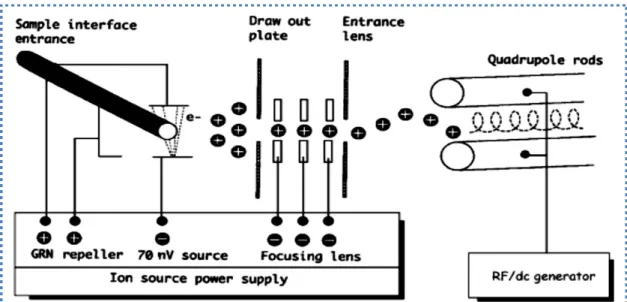
Mass spectrometry is a micro-analytical technique that can provide more structural information about a unit analyte than any other known analytical technique. Structural determination and compound characterization is based on the measured mass-to-charge (m/z) ratio of an analyte molecule. The sample molecules are first ionized by an ion source, the ions are then repelled towards the mass analyzer. Repulsion is done by a repeller plate at the back of the ion source provided with variable voltage of the same sign as the ionized fragments. Right after the pinhole, a series of focusing electrical lenses with variable voltage but same polarity like ionization fragment ions, squeezes the ion bean into an intense ion stream and it enters the mass analyzer (page.43-44 (McMaster 2008)). The process is illustrated in Figure 3. The mass analyzer separate the ions based on their m/z ratio. The selected masses from the mass analyzer strike the detector surface and produce signals. Main components of a mass spectrometer are briefly explained in the following text.
Figure 3 Schematics of mass spectrometric operation with EI as the ion source and quadruple mass analyzer (page 44 (McMaster 2008)
1.2.3.1
Ion source
The ion source produces ions in gas phase. There are many different ionization methods currently available depending on physical and chemical properties of the analyte and the internal energy transfer required during the ionization process. In the electron ionization (EI) source, sample from the gas chromatograph interface is exposed to a stream of 70-eV electrons from a filament. The EI is a highly energetic ionization technique, which typically offers extensive fragmentation. The advantage is that fragmentation patterns are reproducible. Characteristic fragments with specific masses can be used for either quantitative or qualitative analysis. Qualitative analysis offers structural determination, while quantitative analysis provides information about the concentration (J. Throck Watson 2007).
1.2.3.2
Mass analyzer
Several types of mass analyzers are in use. All mass analyzers use static or dynamic electric and magnetic fields that can be alone or in combination with each other. Most of the basic differences between the various common types of mass analyzer lie in the manner in which such fields are used to achieve separation. A quadruple mass analyzer is based on a combination of direct current (DC) and alternating current (AC) of radio frequency (RF) in four symmetrically arranged parallel rods. Diagonally aligned rods are electrically connected to make a pair. At any given time the two pairs have a potential of same magnitude, but with opposite signs. When accelerated ion stream enters a quadruple, the ions are forced into a corkscrew, three dimensional sine wave. The trajectories of the ions are determined by their m/z under the combined given DC/RF field. The combined DC/RF field is swept together for higher or lower field strength, upsetting the trajectories of all other ions, making them collapse with the walls of the rods and disappear, except the ions with one selected m/z as illustrated in Figure 4.
Heavy ions have low charge density and will therefore be less influenced by the attractions and repulsions while the lighter ions are more influenced by the changes in the AC electrodes due to high charge density. In other words, by sweeping DC/RF fields up or down, larger or smaller masses can be selectively directed towards the detector (page. 44 (Marvin McMaster)).
Figure 4 Principle and Scheme of a quadruple mass analyzer (Rolf Ekman 2009). Molecule A and C will not make
through the quadruple since they are not within the allowed m/z range. They will collapse with the walls of the analyzer and disappear.
1.2.3.3
Detector
Detectors in the MS convert the energy of incoming particles into electrical signals. The energy is registered by electronic devices and transferred to a computer that translates these electrical signals into mass spectrometric information about the analyte. The signal received by the detector is generally low, so the energy of the incoming particles is usually amplified by the structural configuration of the detector. When ions from the mass analyzer strike the detector, the energy of the impact causes a secondary emission of electrons or photons depending on the nature of the detector (page 49-50 (Rolf Ekman 2009)). Several types of detectors are available for mass spectrometers. The choice of a particular detector is made by considering the design of the instrument in connection with analytical applications (Hoffman 2007)
1.2.3.4
Coupling GC with MS
The type of interface between GC and MS depends on the flow rate of carrier gas in the GC column. Direct coupling of MS is preferred with a GC where the flow rate in GC column is <2 ml/min. Higher flow rates are not compatible with MS operations. At a flow rate >2 ml/min even with the most efficient 2 stage vacuum systems, it is very difficult to achieve required vacuum necessary for MS operations. The life of EI source filament is also greatly affected at higher flow rates. (Chromacademy).
1.3
Validating Analytical Methodologies
Analytical measurements play crucial role in the modern world. Decisions making about the control of the manufacturing process of a product, assessing whether a product complies with regulatory limits or taking decisions about legal affairs, international trade, supporting health care will not be possible without accurate and reliable analytical measurements. Checking the quality of drinking water or the environment to comply with regulatory requirements, international environmental standards or for public health are some other crucial applications of analytical measurements. That’s why an analytical lab must ensure that its analytical measurements are reliable and reproducible by other independent laboratories anywhere in the world and the user can use these results with great confidence for important decision making. Quality of analytical results can be guaranteed if they are obtained under the quality system developed by international analytical institutions. This system is based on four key concepts:
1. The laboratories which produce analytical results must operate under quality assurance principles of ISO/IEC 17025:2005 and should be accredited by this standard.
2. The laboratory must participate in proficiency testing schemes, in accordance with the “International harmonized protocol for proficiency testing of analytical laboratories”(M. Thompson 2006).
3. The laboratory must use internal quality control procedures which comply with the “Harmonized guidelines for internal quality control in analytical chemistry” (M. Thompson 1995).
4. The laboratory must use validated methods of analysis.
Using validated analytical methodology is one of the 4 key concepts to produce reliable and reproducible results. ISO 17025:2005 defines validation as confirmation by examination and the provision of objective evidence that particular requirements for a specific intended use are fulfilled (ISO/IEC 17025 2005). In fact, method validation is the means by which analysts have to demonstrate that the method is fit-for-purpose and the customers can trust the reported results.
1.3.1
When to validate a method
method validation in the following situations to confirm that the method is fit for an intended use. ((ISO/IEC 17025 2005) clause 5.4.5.2))
New method developed for a particular problem
Established method revised to incorporate improvements or extended to a new problem; Established method used in a different laboratory, or with different analysts or different
Instrumentation
To demonstrate the equivalence between two methods, e.g. a new method and a standard. When quality control indicates an established method is changing with time;
Method validation is hard to separate from method development when a new method is developed for an analytical problem. Many of the method validation parameters are usually evaluated, at least approximately, as part of method development andit is usually not possible to determine exactly where method development finishes and validation begins. (EURACHEM 1998). It is recommended as the method development proceeds, regular review should be carried out that customer needs are still being fulfilled. In case of chromatographic method development and validation, this can be well taken care of when method development and validation is broken down into four following steps (Bliesner 2006).
1. Method evaluation and further method development 2. Final method development and trial method validation 3. Formal method validation
4. Data review and method validation report
1.3.2
Components of Method Validation
The basic method validation parameters are commonly derived by using statistical procedures and usually refer to the reliability of the method. The trueness, accuracy, linearity, precision, selectivity, sensitivity, range, ruggedness, limit of detection and limit of quantification are the commonest and essential parameters that are required to be assessed in order to check whether a method satisfies previously defined analytical requirements and performance criteria and are required by ISO 17025:2005. These parameters are also called analytical method performance characteristics. Other complementary parameters are cost, ease of use, availability of material,
instruments and trained staff and sample throughput etc. (Ricard Boqué 2002). The latter parameters are not the main focus of this study.
The extent of method validation depends on the type of the method going to be applied or nature of the changes made in reapplying a method to different laboratories. The type of changes may include instrumentation, operators and the circumstances in which the method is going to be used. The type of method and extent of validation required accordingly is as follows:
Standard methods: when applied with their full specifications do not require full method validation but the lab will have to have data to show that it can achieve the level of performance which the standard specification claims for the method.
Documented in house methods based on standard methods: Extent of validation depends on the extent of the departure from the standard specifications.
In-house methods which are the laboratory’s own methods: need a high level of validation.
For method validation study to establish the performance characteristics of the method, mainly ISO 17025:2005 requirements and ISO 8466 and ISO 5725 approaches were attempted with the available data. However the method performance characteristics and their importance are supported in the following text by other method validation guides as well.
1.3.2.1
Limit of Detection (LOD) and Limit of Quantification (LOQ)
Limit of detection (LOD) is the lowest amount of an analyte to be examined in a test material that can be detected and regarded as different from the blank value with a given probability but not necessarily quantified.
The Quantitation limit (LOQ) is the lowest amount of an analyte to be examined in a test material that can be quantitatively determined under the experimental conditions described in the method with a defined variability given by coefficient of variation.
In practice, LOQ is generally more relevant than LOD. It is quite common to estimate LOD and LOQ as part of method development. There are several approaches to calculate LODs. The LOQ, by convention, is 3 times of LOD. The EU directive defines limit of detection as 3 times the
relative within batch standard deviation of a natural sample containing a low concentration of the parameter(Council Directive 98/83/EC 1998).
Two very common ways are based on regression statistics obtained during linearity study:
�
=
. ∗Equation 1
Where standard, Sres= standard deviation of residuals as found in the linear regression of the data
for linearity study
�
=
× Equation 2Where Sa
is the
standard deviation at the intercept point of the calibration function. The Sais
calculated by following expression:
= √ ∑=
.∑= − ̅ Equation 3
Where n= number of standard concentration levels used for linearity study,
̅
is the mean of all the reference values for standard concentrations, = accepted value of ith standard.The LOQ is more important. Once LOQ is calculated a standard concentration near or equal to the LOQ is must to test to ascertain whether the accuracy and precision achieved is satisfactory.
1.3.2.2
Working range
The working range of a method is defined as “the interval being experimentally established and statistically proved by the calibration of the method, between the lowest and highest quantity and mass concentration” (ISO 8466).
Working range may or may not be linear but for a method to be effective, the curve should be repeatable from day to day. Within a linear working range, signal response will have a linear relationship to analyte concentration (EURACHEM 1998).
While establishing a preliminary working range for linear functions, following requirements must be met:
2. The most frequently encountered sample concentration should lie in the center of the working range.
3. A linear correlation between the measured values concentration.
4. The lower limit of working range should be equal to or greater than the limit of quantification.
5. Information or measured values are independent of the concentration. Statistically speaking, the difference between the variance of the lowest and highest concentrations in the working range. This is called test for homogeneity of variances. Ten independent replicates of the lowest and highest standards in the working rang are recommended and comparison is made as follows.
= �
Equation 4Where is the variance of 1st standard and is the variance of last standard. The PG value is compared with the tabulated value of the distribution F (Fisher) for n-1 degrees of freedom and a 1% significance level. Where n is the number of standard replicas measured. If PG <F then the differences in the variances of the lowest and highest standards in the working range are not significant and the range of the work is well adjusted. If PG> F then the differences in variances are significant. The range of the work should be readjusted to that where the difference in the variances for the first and last standard are not significant i.e PG<F(ISO 8466).
1.3.2.3
Linearity
The linearity of a method is its ability, within a given range, to provide an informative value or results proportional to the amount of analyte to be determined in the test material (ISO 8466). For linearity study, ISO 8466-1 requires at least 5 standards in the calibration data but recommends regularly distributed over the studied range of values. Linearity may be ensured by following three points:
1. The statistical calculations
A data may have good statistics even with outliers and points of influence. An outlier is a data point which is significantly different from the rest of the data set. A point of influence is a
calibration point which has a disproportionate effect on the position of the regression line (LGC Limited 2003). The graphical representation of the calibration data with the calculated regression line will make outliers and point of influences evident and any nonlinearity may be detected. A visual inspection of plot of the residuals against concentration is strongly recommended to highlight problems with the calibration data that may not be immediately obvious from a simple scatter plot of the data. (EURACHEM 1998).
2. The statistical calculations:
Residual standard deviations from linear regression model and with a non-linear regression model of polynomial 2 for the same set of data set are compared as in followings.
= − − − ′ Equation 5
Where is variance of residuals for linear regression, ′ is variance of residuals for 2nd degree polynomial model and N is the number of reference materials/standards used. The DS2 and the variance of the nonlinear calibration function are compared by the F-test to determine whether there are significant differences or not.
� =
′ Equation 6The value PG is compared with the limit value F1-α given by the Fischer-Snedecor table for a
confidence level “1-α” and a degree of freedom 1 and (N-3). If PG ≤ F1-α: the nonlinear calibration function does not result in an improved adjustment; for example, the calibration function is linear. If PG > F1-α: the work scope must be made as narrow as possible to obtain a linear calibration function: otherwise, the information values from the analyzed samples must be evaluated using a nonlinear calibration function.
3. The correlation coefficient:
The correlation coefficient “R” and related parameter coefficient of determination (R2) are a
measure of the strength of the degree of correlation between the y and x values. And depending on the extent of correlation “r” can take any value between +1 and –1. Values closer to 1, show stronger correlation. The correlation coefficient is commonly used in analytical measurement and it is easily and frequently misinterpreted, because:
• Correlation and linearity are only loosely related. It should be noted that coefficient r is a measure of correlation not a measure of linearity. A low r value does not necessarily mean that there is no correlation. There could be a relationship between the y and x values, but not a linear one. (LGC Limited 2003)
• Apparently data may show good correlation. A plot of the data is necessary to make sure that the data is satisfactory for the purposes of calibration.
• Predictions made from the calibration curve would have small uncertainties when r is very close to unity (1).
1.3.2.4
Sensitivity
Sensitivity is defined as the slope of the calibration function of the complete analytical method inclusive of all procedural steps within the working range in question (ISO 8466).
In other words, it is the ratio between the variation of the information value of the analysis method and the variation of the analyte quantity and is given by the following equation:
=
∆∆� Equation 7∆� - Increase in the value read ∆ – Change in concentration
For the calibration curve, the sensitivity (slope of line) should be constant over the entire range. Sensitivity is the ability of the method to discriminate between differences in analyte contents. More sensitive methods are better able to distinguish small changes in analyte concentration (NATA Australia 2006).
The ratio of sensitivity and residual standard deviation is termed as standard deviation of the method ( ) which is a characteristic of analytical method and a measure for the quality of the analytical procedure. Standard deviation of a method is expressed as:
=
Equation 8As can be seen from the equation; the quality of analytical method increases with increasing sensitivity and decreasing residual standard deviation. Different analytical methods may have
different working ranges. The coefficient of variation of a method is a normalized expression and can be used to compare the analytical efficiency of new developed methods with that already in use or with the standard analytical methods even with different working ranges. The coefficient of variation of a method is expressed as percentage by the following expression (ISO 8466):
=
�̅
×
Equation 91.3.2.5
Selectivity/Specificity
If a method responds to only one analyte, it is called specific. Generally analytically methods respond to multiple analytes. The ability of a method to determine accurately and specifically the analyte of interest in the presence of other components in a sample matrix under the stated conditions of the test is termed as selectivity (NATA Australia 2006). During method development, it should be established first that the signals attributed to the analyte are being produced only due to analyte. The presence of something chemically or physically similar or arising as a coincidence is not contributing to the produced signals. The selectivity of analytical method can be assessed by determining % recoveries of the analytes in the real sample matrices (EURACHEM 1998).
1.3.2.6
Precision
Precision is the closeness of agreement between independent test results obtained under stipulated conditions (ISO 5725).
Precision is a measure of random errors and is normally determined for specific circumstances which in practice can be very varied. The three precision measures are:
1. Repeatability
2. Intermediate precision 3. Reproducibility
Repeatability and reproducibility represent 2 extreme cases of precision which can be obtained while analyzing the same sample, repeatability being the smallest and reproducibility the largest one. Intermediate precision is an intermediate case. (EURACHEM 1998).
Reproducibility study involves the analysis of same sample by the same method, in different laboratories, by different operators and different equipments. However for a single laboratory validation study this parameter is not assessed.
Purpose of the precision experiments is to find the limits within which results may vary in practice in. This information is very important for establishing rejection criteria by which the operator makes a conclusion to accept or reject results obtained in different circumstances in practice.
Precision is usually stated in terms of standard deviation or relative standard deviation (RSD) (EURACHEM 1998). It is recommended that for precision estimation, at least 7, preferably ≥10 determinations should be made on the same sample or standard under repeatability and intermediate precision conditions (IUPAC 1999).
1.3.2.6.1 Repeatability
Repeatability refers to tests performed on identical test items during a short interval of time in same laboratory by same operator using the same equipment. In other words repeatability is precision under conditions that are as constant as possible (NATA). Repeatability being the smallest expected precision (EURACHEM 1998).
Repeatability standard deviation is given by the equation:
= √
−. ∑
=− ̅
Equation 10Where n=number of replicates made under repeatability conditions for same sample or standard. = individual determination made in repeatability experiment
̅ = mean of all replicates for same sample/standard in repeatability experiment
When repeatability is determined on 2 different concentration levels in samples/standards, a comparison can be made between the two recoveries, even if determinations were done separately but for determinations on each sample/standard, identical conditions were kept constant. Repeatability of alternative method should be compared with that of the standard method.