Analytical Methods
Exploratory analysis of the volatile profile of beers by HS–SPME–GC
Gilmare Antônia da Silva, Fabio Augusto, Ronei Jesus Poppi
*Institute of Chemistry, P.O. Box 6154, University of Campinas – UNICAMP, 13083-970 Campinas, SP, Brazil
a r t i c l e
i n f o
Article history:
Received 4 December 2007
Received in revised form 23 April 2008 Accepted 5 May 2008
Keywords: Beer
Gas chromatography Solid phase microextraction Exploratory analysis Kohonen neural network
a b s t r a c t
Kohonen Neural Network maps were used for exploratory analysis of Brazilian Pilsner beers. The input data consisted of the peak areas of the volatile profile compounds of samples obtained after headspace solid phase microextraction coupled to gas chromatography. The chromatographic peaks were identified as originating from compounds such as alcohols, esters, organic acids, phenolic compounds, ketone and others typically found in the headspace of such samples. Analysis of the Kohonen maps showed that the 20 different brands of beer could be grouped into six sets, with three of these sets having only one sam-ple, according to the composition of their volatile fractions. The volatile species associated with the sim-ilarities and differences between each sample group were tentatively identified by mass spectrometry and their contributions to the grouping are discussed.
Ó2008 Elsevier Ltd. All rights reserved.
1. Introduction
Beer, a very complex mixture of constituents varying widely in nature and concentration levels is brewed from raw materials including water, yeast, malt, and hops and contains a broad range of different chemical components that may react and interact at all stages of the brewing process. Beer consumption has been increas-ing steadily in recent decades, even in countries where alcoholic beverages are not traditional: in 2005, the total world production was up to1.61011L (almost 25 L per capita, a 3% increase from 2004) (Barth-Haas Group, 2006); the top five producing countries – China, USA, Germany, Brazil and Russia – are responsible for more than 50% of the total output. Therefore, there is a large demand for fast and reliable methods to evaluate organoleptic characteristics such as the aroma and flavor. The volatile compounds that have been identified in beers and associated to their flavor belong to varied chemical groups, including several aliphatic and aromatic alcohols, esters, acids, carbonyl compounds, terpenic substances and others. A better understanding of the key aroma compounds is of paramount importance for modern brewing technology, help-ing the selection of raw materials and yeast strains, as well as for routine quality control.
Considering the nature and concentration of the involved chem-ical species, gas chromatography (GC) is the conventional tech-nique for the detection and identification of aroma components. However, a proper isolation and pre-concentration technique should be applied before the chromatographic analysis itself:
among the possible alternatives, headspace solid phase microex-traction (HS–SPME) is presently considered the best choice. SPME has been successfully applied to several different analytical prob-lems such as the aroma-related analysis of samples such as cupu-assu chocolate (Olivieira, Pereira, Marsaioli, & Augusto, 2004). There are some reports on HS–SPME studies using relevant beer volatiles for aroma and flavor evaluation, ranging from compre-hensive characterization of the volatile fraction (Pinho, Ferreira, & Santos, 2006; Wampler, Washall, & Matheson, 1996) to the detection of specific groups of analytes, such as sulphur com-pounds (Hill & Smith, 2000). In most cases, HS–SPME is employed for identification of individual analytes or groups of analytes. Since HS–SPME is faster and simpler than similar techniques, it allows more samples to be processed, generating larger amounts of data that also demands new interpretation procedures. Information regarding the samples, not revealed through conventional method-ologies, can be produced. So, multivariate data processing ap-proaches are increasingly popular. For example, after principal
components analysis (PCA) of HS–SPME chromatograms, Bicchi,
Panero, Pellegrino, and Vanni (1997)were able to distinguish be-tween pure and blended Arabica and Robusta coffees.
Although well established in the literature, conventional PCA has some limitations (Otto, 1999). In the cases when the sample set is described by a significant (large) number of principal compo-nents, these can complicate the interpretation of the results and the grouping of similar samples. More important, PCA does not work with non-linear data structures, as is the case of most real sample sets; therefore, more sophisticated chemometric algo-rithms should be employed. One of most interesting of these other approaches uses self-organizing maps (SOM) generated through
0308-8146/$ - see front matterÓ2008 Elsevier Ltd. All rights reserved. doi:10.1016/j.foodchem.2008.05.022
* Corresponding author. Tel.: +55 019 35213126; fax: +55 019 35213023. E-mail address:[email protected](R.J. Poppi).
Contents lists available atScienceDirect
Food Chemistry
the Kohonen artificial neural network (KANN) (Kohonen, 2001). ANN algorithms do not demand formal knowledge of a mathemat-ical function relating the response and the input data, allowing complex non-linear relationships to be modeled; the ANN-based approach has already been shown to be useful for simultaneous multioptimization of operational variables of the SPME procedure (Kowalski, da Silva, Poppi, Godoy, & Augusto, 2007). A Kohonen map allow complex, high dimensional data sets to be represented by bi- or tri-dimensional structures that stress the properties of the data set most relevant to the clustering of the samples. Users can intuitively group similar individuals by simple visual inspection of the map (Kohonen, 2001).
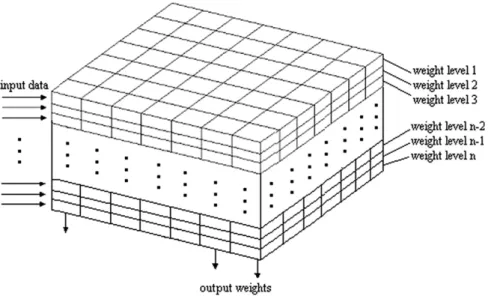
Kohonen maps are composed of a single layer of neurons ar-ranged regularly in a two-dimensional grid; a general scheme of a Kohonen network can be visualized in Fig. 1. Each sample in the input data set is associated to an input vectorx; the elements on the input vectorsxcorrespond to the value for each experimen-tal variable measured for the sample (e.g., the peak areas measured for each detected analyte). The neurons in the Kohonen map are vectors with dimensions equal to the number of experimental vari-ables on the input vectorsx.
Each neuron is a vector with dimension equal to that of each sample in the input data vectorx. Each input vectorxwill corre-spond to a specific sample, which normally contains the values for the experimental variables (in the present work, peak areas cor-responding to each compound in the beer samples). All the neu-rons have the same number of weights, according to the dimensionality of the input vectorx. The dimensionality of these vectors will depend on the number of variables contained in the data: the weights can be defined as a vector where each compo-nent will be related to a specific variable of the input vector. According to the weight values, specific variables from the input vector x will be considered to be more representative for the description of this sample. The values for the weight are estimated through the neural network.
The neurons are represented by ad-dimensional weight vector
w= [w1,w2,. . .,wd], wheredis equal to the dimension of the input
vectors. The weights of each neuron are obtained by looking at the weights in all levels exactly aligned in the same vertical column. When the input is presented to a Kohonen network, the distance between each data vector and all the SOM weight vectors is calcu-lated according to Eq.(1).
output min Xm
i¼1
ðxsiwjiÞ2
" #
j¼1;2; ; n ð1Þ
The indexjrefers to a particular neuron;nis the number of neu-rons;mis the number of weights per neuron; andsidentifies a par-ticular input. The neuron whose weight vectorwis closest to the input vectorxis called the best-matching unit (BMU) or winning neuron, where the difference between its weight vectorwand the input vectorxproduces a minimum in the network output. After reaching the BMU the correction of weights starts (adaptation of the ANN or learning process). The correction of weights does not af-fect all neurons in the network, but only those topologically close to the BMU, in an iterative process similar to those occurring in biolog-ical neural networks. The Kohonen neural network can be visual-ized as neurons spread on a bidimensional plane, which results on easier visualization and interpretation of the results. Samples as-signed to the same neuron can be considered as equivalent towards the property described by the input data set; also, individuals in neighboring neurons can be designed as forming groups of samples with similar properties. The larger the distance between the neu-rons, the more different, in respect to the measured property used as data input, are the samples associated with these neurons. HS–SPME–GC–MS has already been combined with the Kohonen network for sample classification purposes in a work that identified strawberry varieties according to the profile of extracted volatiles (De Boishebert, Urruty, Giraudel, & Montury, 2004).
In the present work, HS–SPME–GC–FID and MS were employed to assess the profiles of volatile organic compounds from Pilsner-type beer samples made in Brazil. The data sets (relative peak areas for the principal detected compounds for each sample) were eval-uated utilizing Kohonen artificial neural networks, to verify possi-ble similarities and groupings of the samples, as well as to identify volatile compounds that could be associated to each group of sim-ilar samples.
2. Materials and methods
2.1. Samples and materials
Pilsner beer of 20 different brands (three cans per brand) were obtained at the local market and stored in proper conditions before use. The content of each can was analyzed immediately after
opening. All extractions were performed manually using 65
lm
PDMS/DVB SPME fibers (Supelco, Bellefont – PA, USA) coupled to a holder and previously conditioned according to the supplier’s instructions; selection of this fiber was based on preliminary stud-ies. During the extractions, samples were contained in 16 mL glass vials capped with Teflon/silicone septa (Pierce, Rockford – IL, USA). Reagent grade NaCl (J.T. Baker, São Paulo, Brazil) and a C8–C20n -alkane standard solution (Fluka, Büchs, Switzerland) were also employed.2.2. Gas chromatography
Separation, detection and quantitation of volatile organics after HS–SPME was performed with a 6890 N GC–FID (Agilent
Technol-ogies, Wilmington – DE, USA) fitted with a 30 m0.25 mm
0.25
lm HP-50 column (Agilent), a split–splitless injector operated
in the splitless mode and a SPME glass liner. The oven temperaturewas programmed as follows: 40°C hold for 2 min, then
10°C min1to 140°C, then 7°C min1 to 250°C, hold for 3 min. The injector and detector temperatures were 210°C and 280°C, respectively. Helium was used as carrier gas at a flow rate of 1.0 mL min1
. Identification of the extracted analytes was per-formed in a Saturn 2000 Ion Trap GC–MS (Varian, Walnut Creek – CA, USA) fitted with the same column and operated under the same conditions as the GC–FID. GC–MS data treatment was carried out using the Automated Mass Spectral Deconvolution and Identifica-tion System (AMDIS) v. 2.61 software and the NIST Mass Spectral Search Program v. 1.6 d (NIST, Washington, DC, USA).
2.3. HS–SPME procedure
After opening the cans, beer samples were immediately
degassed in an ultrasonic bath for 15 min at 5 °C; NaCl
(27 g/100 mL beer) was added after CO2gas removal. Aliquots of 5 mL of degassed beer were enclosed in the sample vials and mag-netically stirred (1200 rpm) for 5 min for sample/headspace equil-ibration. After this period, the PDMS/DVB fiber was exposed to the headspace for 30 min. The sample temperature was kept at 50°C during the equilibration and extraction steps, using a heated circu-lating bath (Cole-Parmer, Vernon Hills – IL, USA). The extracted analytes were immediately desorbed in the injection port of the GC–FID at 210°C; the fiber was kept in the GC injector for 15 min to ensure total desorption and avoid inter-run carryover. Each sample was extracted in triplicate. For identification of the chromatographic peaks, the same procedure was repeated for se-lected samples, but with separation and detection with GC–FID and GC–MS; samples were spiked withn-alkane mix to estimate the linear temperature-programmed retention indexes (LTPRI) of the detected peaks.
2.4. Data processing
All calculations were performed in the MATLAB 6.5 program-ming environment (The MathWorks, Natick, MA) fitted with a
pub-lic domain SOM toolbox (Vesanto, Himberg, Alhoniemi, &
Parhankangas, 2000). The input data set was organized into a ma-trix of 20 lines (corresponding to 20 samples) and 32 columns (32 variables, corresponding to the average peak areas of selected chromatographic peaks). The whole data set was auto-scaled along all the variables in order to have the variances of the variables nor-malized and their means made equal to zero. Scaling of variables is of special importance for Kohonen neural network application, since its algorithm computes the Euclidian distances between vec-tors. If a particular variable is much higher than its counterparts, it will dominate the map organization due to its greater impact on the measured distances. The pre-processing procedure warrants
that all variables have the same importance in the map, allowing users to evaluate their significance in sample qualification.
The maps were linearly created and initialized. For the initiali-zation, eigenvalues and eigenvectors of the data were calculated. The map weight vectors are initialized along the largest eigenvec-tors of the covariance matrix. The Kohonen neural network was trained with the input data set using the batch training algorithm; in this algorithm, the whole set is presented to the map before any adjustments. The neighborhood function used in the training was a gaussian; the lattice structure was hexagonal and the map shape was planar. Two-dimensional maps with different architectures (from 44 to 1010 units) were tested, since the capacity of dis-crimination depends on the number of units selected to define the map. The structure that performed the best distribution and inter-pretation of the beer samples was then chosen.
3. Results and discussion
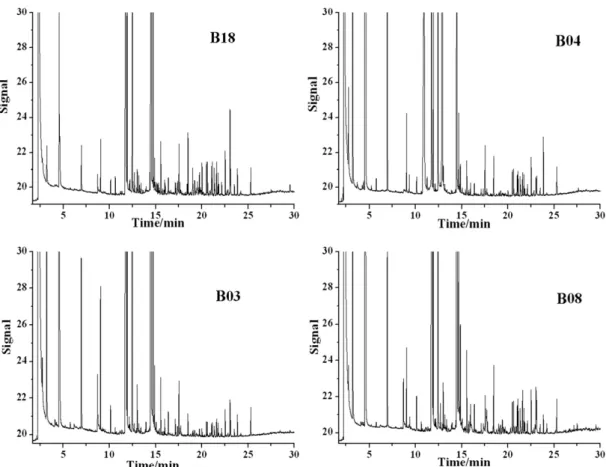
The HS–SPME–GC–FID chromatograms of some beer samples can be seen in Fig. 2. The most noticeable feature of these chro-matograms is their complexity; although a simple visual examina-tion of these plots reveals several peaks in common between samples, the range of their intensities is large. Also, several minor constituents are present in variable amounts. Therefore, it is clear that although these chromatograms certainly contain abundant information that can be associated to macroscopic properties of the samples (such as their quality or origin), it is necessary to use appropriate mathematical and statistical procedures to inter-pret this data in a practical and efficient way.
A total of 32 peaks, common to most samples, were selected as input variables for the generation of Kohonen maps. After data pro-cessing as described above, different neural network architectures were generated. The most suitable for interpretation and qualifica-tion of the samples was defined with 36 neurons, in a square arrangement of 66. For this evaluation, the most important nor-malized peak areas that provided enough information for beer sample data interpretation were considered.
The distributions of samples in the generated network enabled inferring about the similarities among the canned Brazilian beers studied, based on the chromatographic profiles, are shown inFig. 3. In this way, it is possible to perceive the formation of six sample sets, with three of these sets having just one sample.
To evaluate set formations, the individual variable map distri-butions (peaks, which reflect the retention times) were analyzed (Fig. 4), where the significant peaks utilized for data treatment are presented. According to these individual maps, it is possible to infer about the level of variable importance to the characteriza-tion of each different beer set.
The chromatographic profiles, specifically the chromatographic peak areas, reflect the extracted volatiles, in composition and quantity terms. These deductions were validated and comple-mented through the mass spectra of the SPME samples that al-lowed evaluation of the chemical composition of the commercial canned beers (Table 1).
Table 1presents the peak identifications performed, where di-verse kinds of compounds such as alcohols, esters, sulphide com-pound, organic acid, etc. were found. These compounds were responsible for the sets established inFig. 3.
isopropyl naphthalene, proposed to p56 and p57, and a non-iden-tified compound at p39. The beer samples combined in this set can be characterized in terms of the extracted volatile compounds listed above.
The composition of Set I was possible to be deduced due to the variable map analysis inFig. 4, according to the lateral intensity bars of each map. The white color in these bars indicates higher quantities of the compounds and the black one lower quantities. The gray scale shows intermediate quantity values. Thus, the com-pounds that are pronouncedly presented in a specific sample can be determined by the comparison of the position of this sample in the specific neuron in Fig. 3and the variables located in this same neuron or in its neighborhood inFig. 4.
Octanoic or caprylic acid is employed in food processing due to its antimicrobial activity; the toxic effects of octanoic acid on Sac-charomyces cerevisiae (a kind of yeast) culture have been shown, inhibiting the fungal population growth, but contrarily, increasing the mean fermentation rate (Kasemets, Kahru, Laht, & Paalme, 2006). Volatile esters are only trace compounds in fermented bev-erages such as beer and wine, but ester compounds are pointed out as strong contributors to the aroma and flavour of beverages. Many studies have identified ethyl esters, in several beverages, mainly as the result of yeast metabolism during fermentation ( Vallejo-Cor-doba, Gonzalez-Cordova, & del Carmen Estrada-Montoya, 2004) (Alves, Nascimento, & Nogueira, 2005).p-Vinylguaiacol is cited as a derivative of ferulic acid (hydroxycinnamic acid) during the brewing process, and it is frequently found in beer when wheat or wheat malt is used as a component of beer production (Coghe, Benoot, Delvaux, Vanderhaegen, & Delvaux, 2004). It can be an indication that beers presented in this upper left set were pro-duced using wheat or malt wheat, in agreement with the Brazilian legislation which allows the addition of other kind of components in beer production such as sugar and other cereals like rice, corn, rye, sorghum, oat and wheat (Brasil, 1997).
c-Nonalactone is cited
as a key compound whose concentration increases during ageing. It was also described thatc-nonalactone was not found in hop
ex-tracts, but was pronounced after hopping (Guyot-Declerck, Franc-ois, Ritter, Govaerts, & Collin, 2005). Butylated hydroxytoluene (BHT) is a phenolic compound commonly used as a food additive, because of its antioxidant activity. Nerolidol is a sesquiterpene present in essential oils of several plants possessing antibacterial, antifungal, and antiparasitic properties (Cowan, 1999). The last compound belonged to Set I, related to p56 or p57 was isopropyl naphthalene. It is not a beer flavour constituent. In the literature a citation was found that diisopropyl naphthalenes are widely em-Fig. 2.Chromatograms obtained from four commercial canned Brazilian beers (B18, B04, B03, B08) through HS–SPME–GC–FID analysis.ployed as solvents in the paper industry and in the manufacture of carbonless copy paper and thermal paper. The presence of the naphthalenes in foodstuffs may possibly occur due to its migration from paperboard packaging (Boccacci, Chiaccherini, & Gesumundo, 1999). Although beer is not stored in paperboard containers, a rea-sonable justification is that some of its ingredients could be stored or purchased in paperboard packaging.
The upper right set inFig. 3(Set II) is formed by the samples B05, B07, B10 and B15. The peaks responsible for this configuration
cor-respond to p35 (1-undecanol), p43 (p-vinylguaiacol), p45
(c-nonalactone), p51 (possible long chain alcohol), p55 (probable ester of phenylethyl alcohol with 6 carbons) and also p38, non-iden-tified (Fig. 4). If we compare these peaks with the ones verified in the previously described set (Set I), we can notice some common peaks that justify both arrangements. These are the cases of p43, p45, p51 and p55. This comes from the fact that some volatile compounds were responsible not only for the individual separations or within a same group, but also for separations in terms of upper and lower side or left and right side. This is the example of the peak p45 (c-non-alactone) that separates the upper network side from the lower one
(Fig. 3), showing that this substance is quite important and is pre-sented in all sets formed in the upper network region (Fig. 4).
In the samples of Set II the amount of a higher alcohol, 1-undec-anol, was significant. The alcohols constitute an important part of the by-products formed during beer fermentation. Alcohols con-tribute to the strong and pungent smell and taste of beer, and their formation is linked to yeast-protein synthesis. They are important as precursors of flavor-active esters (Pinho et al., 2006). Undecanol compounds were also reported as constituents of essential oils of various plant species (Limberger et al., 2002).
The samples B19 (Set III), B04 (Set IV) and B14 (Set V) constitute individual sets (Fig. 3). The sample B19, located at the right central part of the Kohonen map (Fig. 3) is placed next to Set II due to the strong presence of the non-identified compound with the peak number p38. On the other hand, this sample was not joined to the Set II because of the higher quantity of a long chain alcohol (suggestion for p51), and also due to the near absence of the com-pound
c-nonalactone (p45).
The two commercial beer labels B04 and B14 were separated individually for presenting very peculiar peaks, not verified in the Fig. 4.Individual variable map distributions (chemical compounds) from the Kohonen neural network.
other samples. The sample B04 was left apart from the others by presenting significant amounts of the following volatile compo-nents: sorbic acid (p26), 2-methyl-3-nonanone (p27), ethyl benzo-ate (p34), a probable long chain alcohol (p51) and isopropyl naphthalene (proposed for the p56 and p57 peaks) (Fig. 4). The peaks p26, p27, p34 are exclusive to this sample, being the motive to for its separation.
Sorbic acid is an antimicrobial food additive used to prevent the growth of yeasts, moulds and bacteria in food and beverages (Wang, Zhang, Wang, & Wang, 2006). Citation of nonanone car-bonyl compounds can be found in the literature as one of the prin-cipal compounds constituting flavour components (Camara, Alves, & Marques, 2006). Ethyl benzoate is an ester formed by the con-densation of benzoic acid and ethanol (Fan & Qian, 2005).
For beer sample B14 (Fig. 3), a variety of distinctive peaks were pointed out, many of them being almost exclusive to this beer, con-tributing to its individual sample position. The compounds were as follows: p3 (dimethyl sulphide), p4 (ethyl acetate), p8 (ethyl propanoate), p9 (1-pentanol), p10 (2-methyl-1-butanol), p11 (2-methyl propyl acetate), p12 (ethyl butanoate), p16 (3-methyl-1-butanol acetate), p18 (2-pentyl furan), p20 (ethyl hexanoate), p24 (1-octanol), p28 (octanoic acid), p29 (ethyl tiooctanoate), p32 (phenylethyl alcohol), p35 (1-undecanol), p37 (2-phenylethyl acetate), p42 (ethyl (Z)-4-decenoate), p51 (possible long chain alcohol), p56 and p57 (implied as possible peaks to isopropyl naph-thalene) (Fig. 4).
Although sulphur compounds contribute in a positive way to the aroma and taste of many foodstuffs, due to their low sensory
thresholds and powerful, often unpleasant characteristics, they are frequently the cause of off-flavors and odors (Hill & Smith, 2000). At low levels, sulphur compounds contribute to palate full-ness and overall beer aroma. A wide variety of sulphur compounds have been reported in beer, with dimethyl sulphide being one of the most abundant sulphur components. The ester compound, ethyl butanoate (ethyl butyrate), was identified in various works concerning beer, for example, in a Bavarian pilsner-type beer study, in which this odorant was suggested one of the key contrib-utors to the overall aroma (Fritsch & Schieberle, 2005). The volatile ester 3-methyl-1-butanol acetate (isoamyl or isopentyl acetate) is considered one of most important flavor-active esters in beer (Verstrepen et al., 2003). Furan, also known as furane and furfuran, is a heterocyclic organic compound described as a constituent of the volatile fraction of beer, also in the 2-pentyl furan form. The concentration of furan compounds changes during beer ageing and they are sensitive indicators of heat induced flavor damage to beer (Pinho et al., 2006), which can suggest some problems in the brewing process of the B14 sample. Phenylethyl alcohol is a product of yeast metabolism and a marker for fermentation parameters (Wei, Mura, & Shibamoto, 2001). The aromatic ester 2-phenylethyl acetate was detected as one of the most active odor-ants in Croatian Rhine Riesling wine (Komes, Ulrich, & Lovric, 2006).
A great number of compounds were responsible by the forma-tion of the last set (Set VI) located on the lower left side of the neu-ral network map (Fig. 3), composed of the beer samples B06, B09, B12, B16 and B20. Actually, these compounds influenced the for-mation of the other sets previously described, as we can notice through the observation ofFigs. 3 and 4. The most important vari-ables to the composition of lower left set were the following: p3 (dimethyl sulphide), p4 (ethyl acetate), p8 (ethyl propanoate), p9 (1-pentanol), p10 (2-methyl-1-butanol), p11 (2-methylpropyl ace-tate), p12 (ethyl butanoate), p16 (3-methyl 1-butanol aceace-tate), p18 (2-pentyl furan), p20 (ethyl hexanoate), p24 (1-octanol), p28 (octa-noic acid), p29 (ethyl thiooctanoate), p32 (phenylethyl alcohol), p35 (1-undecanol), p37 (2-phenylethyl acetate), p40 (ethyl decan-oate), p42 (ethyl (Z)-4-decenoate), p43 (p-vinylguaiacol), p45 (c-nonalactone), p48 (butylated hydroxytoluene), p51 (possible long chain alcohol), as well as the peaks p17 and p39 that were not identified (Fig. 4). All the components responsible for this set for-mation have already been described above.
Thus, as cited for p45 (c-nonalactone), it is still interesting to mention that the p28 (octanoic acid), p40 (ethyl decanoate) and p48 (butylated hydroxytoluene) variables were responsible for the separation of beer samples on the left and right sides of the Kohonen neural network map (Figs. 3 and 4) and the p3 (dimethyl sulphide), p4 (ethyl acetate), p9 (1-pentanol), p10 (2-methyl-1-butanol) peaks corresponding to the compounds that located the beer samples on the lower side of the network map (Figs. 3 and 4). The p42 (ethyl (Z)-4-decenoate) variable ‘‘isolated” the upper right set from the other samples that contained significant quantities of this compound (Figs. 3 and 4), and the p43 compound (p-vinylguaiacol) was responsible for the separation of the lower right set from the other beer samples that presented expressive quantities of this component (Figs. 3 and 4).
4. Conclusions
Utilization of the Kohonen neural network was of great impor-tance in this exploratory study of twenty Brazilian Pilsner beers be-cause the evaluation of the similarities and differences between the studied samples became possible, in terms of the significant volatile compounds. It was possible to infer which samples pre-sented analogous volatile profiles, even if they were produced by Table 1
Compounds utilized to exploratory analysis of beers, tentatively identified by mass spectrometry
Peak FIDtRa
(min)
MStRb
(min)
Compound I
p3 2.72 1.80 Dimethyl sulfide 701
p4 3.19 2.39 Ethyl acetate 728
p8 4.38 3.48 Ethyl propionate 795
p9 4.55 3.60 1-Pentanol 805
p10 4.60 3.66 2-Methyl 1-butanol 808
p11 5.20 4.27 iso-Butyl acetate 842
p12 5.75 4.81 Ethyl butyrate 873
p16 6.95 5.99 Isoamyl acetate 942
p17 6.99 –c – 944
p18 8.76 7.86 2-Pentyl furan 1045
p20 9.03 8.12 Ethyl hexanoate 1060
p24 10.11 9.21 1-Octanol 1122
p26 10.63 9.74 Sorbic acid 1151
p27 11.01 10.14 2-Methyl-3-nonanone 1173
p28 11.78 10.95 Octanoic acid 1217
p29 11.93 – Ethyl thiooctanoate 1225
p32 12.46 11.58 Phenylethyl alcohol 1255
p34 12.90 12.05 Ethyl benzoate 1280
p35 13.00 12.15 1-Undecanol 1286
p37 14.45 13.61 2-Phenylethyl acetate 1369
p38 14.49 – – 1371
p39 14.52 – – 1373
p40 14.69 13.89 Ethyl decanoate 1382
p42 14.87 14.02 Ethyl (Z)-4-decenoate 1393
p43 15.55 14.70 p-Vinylguaiacol 1431
p45 16.36 15.55 g-Nonalactone 1477
p48 17.52 16.72 Butylated hydroxytoluene 1543 p50 17.72 16.88 Sesquiterpenoid (?) 1555
p51 18.48 – Long chain alcohol 1598
p55 20.00 – Probably ester of phenylethyl alcohol with 6 carbons
1685
p56 20.49 19.71 Isopropyl naphthalene? 1713 p57 20.61 19.83 Isopropyl naphthalene? 1719
aThe term FIDt
Rcorresponds to the retention time achieved with the flame
ionization detection.
b The term MSt
Rrefers to the retention time obtained with mass spectrometry
detection.
different breweries, through the assessment of the six groups formed in the Kohonen map. Interesting information can be avail-able, such as problems in beer production or the suggestion of the use of similar raw materials. The combination of HS–SPME–GC–FID and MS and the Kohonen network proved to be very efficient for the study of the volatile profile of complex matrices that, conse-quently, generates complex data practically impossible to be ana-lyzed by traditional mathematical methods.
Acknowledgment
The authors thank the Conselho Nacional de Desenvolvimento Científico e Tecnológico (CNPq) for financial support and for fellowships to G.A.S., F.A. and R.J.P.; and Prof. Carol Collins for language assistance.
References
Alves, R. F., Nascimento, A., & Nogueira, J. (2005). Characterization of the aroma profile of Madeira wine by sorptive extraction techniques.Analytica Chimica Acta, 546, 11–21.
Barth-Haas Group. (2006). The Barth Report: Hops 2005/2006, Germain Hansmaennel, Strasbourg.
Bicchi, C. P., Panero, O. M., Pellegrino, G. M., & Vanni, A. C. (1997). Characterization of roasted coffee and coffe beverages by solid phase microextraction – gas chromatography and principal component analysis.Journal of Agricultural and Food Chemistry, 45, 4680–4686.
Boccacci, M. M., Chiaccherini, E., & Gesumundo, C. (1999). Potential migration of diisopropyl naphthalenes from recycled paperboard packaging into dry foods. Food Additives and Contaminants, 16, 207–213.
BRASIL, Decreto no. 2.314 de 04 de setembro de 1997. Regulamenta a Lei no. 8.914 de 14 de julho que dispõe sobre a padronização, a classificação, o registro, a inspeção, a produção e a fiscalização de bebidas.
Camara, J. S., Alves, M. A., & Marques, J. C. (2006). Multivariate analysis for the classification and differentiation of Madeira wines according to main grape varieties.Talanta, 68, 1512–1521.
Coghe, S., Benoot, K., Delvaux, F., Vanderhaegen, B., & Delvaux, F. R. (2004). Ferulic acid release and 4-vinylguaiacol formation during brewing and fermentation: Indications for feruloyl esterase activity inSaccharomyces cerevisiae.Journal of Agricultural and Food Chemistry, 52, 602–608.
Cowan, M. M. (1999). Plant products as antimicrobial agents.Clinical Microbiology Reviews, 12, 564–582.
De Boishebert, V., Urruty, L., Giraudel, J. L., & Montury, M. (2004). Assessment of strawberry aroma through solid-phase microextraction-gas chromatography and artificial neuron network methods. Variety classification versus growing years.Journal of Agricultural and Food Chemistry, 52, 2472–2478.
Fan, W., & Qian, M. C. (2005). Headspace solid phase microextraction and gas chromatography-olfactometry dilution analysis of young and aged Chinese
‘‘Yanghe Daqu” Liquors. Journal of Agricultural and Food Chemistry, 53, 7931–7938.
Fritsch, H. T., & Schieberle, P. (2005). Identification based on quantitative measurements and aroma recombination of the character impact odorants in a Bavarian Pilsner-type beer.Journal of Agricultural and Food Chemistry, 53, 7544–7551.
Guyot-Declerck, C., Francois, N., Ritter, C., Govaerts, B., & Collin, S. (2005). Influence of pH and ageing on beer organoleptic properties. A sensory analysis based on AEDA data.Food Quality and Preference, 16, 157–162.
Hill, P. G., & Smith, R. M. (2000). Determination of sulphur compounds in beer using headspace solid-phase microextraction and gas chromatographic analysis with pulsed flame photometric detection.Journal of Chromatography A, 872, 203–213. Kasemets, K., Kahru, A., Laht, T., & Paalme, T. (2006). Study of the toxic effect of short- and medium-chain monocarboxylic acids on the growth of Saccharomyces cerevisiae using the CO2-auxo-accelerostat fermentation
system.International Journal of Food Microbiology, 111, 206–215. Kohonen, T. (2001).Self-Organizing Maps(3rd ed.). Berlin: Springer.
Komes, D., Ulrich, D., & Lovric, T. (2006). Characterization of odor-active compounds in Croatian Rhine Riesling wine, subregion Zagorje.European Food Research and Technology, 222, 1–7.
Kowalski, C. H., da Silva, G. A., Poppi, R. J., Godoy, H. T., & Augusto, F. (2007). Neuro-genetic multioptimization of the determination of polychlorinated biphenyl congeners in human milk by headspace solid phase microextraction coupled to gas chromatography with electron capture detection.Analytica Chimica Acta, 585, 66–75.
Limberger, R. P., Simões-Pires, C. A., Sobral, M., Menu, C., Bessiere, J., & Henriques, A. T. (2002). Essential oils from some Myrceugenia species (Myrtaceae).Flavour Fragrance Journal, 17, 341–344.
Olivieira, A. M., Pereira, N. R., Marsaioli, A., Jr., & Augusto, F. (2004). Studies on the aroma of cupuassu liquor by headspace solid-phase microextraciton and gas chromatography.Journal of Chromatography A, 1025, 115–124.
Otto, M. (1999).Chemometrics – Statistics and Computer Application in Analytical Chemistry. Weinheim: Wiley-VCH Verlag.
Pinho, O., Ferreira, I., & Santos, L. (2006). Method optimization by solid-phase microextraction in combination with gas chromatography with mass spectrometry for analysis of beer volatile fraction.Journal of Chromatography A, 1121, 145–153.
Vallejo-Cordoba, B., Gonzalez-Cordova, A. F., & del Carmen Estrada-Montoya, M. (2004). Tequila volatile characterization and ethyl ester determination by solid phase microextraction gas chromatography/mass spectrometry analysis. Journal of Agricultural and Food Chemistry, 52, 5567–5571.
Verstrepen, K. J., Derdelinckx, G., Dufour, J. P., Winderickx, J., Thevelein, J. M., & Pretorius, I. S., et al. (2003). Flavor-active esters: Adding fruitiness to beer. Journal of Bioscience and Bioengineering, 96, 110–118.
Vesanto, J., Himberg, J., Alhoniemi, E., & Parhankangas, J. (2000). SOM Toolbox for Matlab 5.
Wampler, T. P., Washall, J. W., & Matheson, M. J. (1996). Applications of purge-and-trap to the analysis of beer.American Laboratory, 28, 18T–18V.
Wang, L., Zhang, X., Wang, Y., & Wang, W. (2006). Simultaneous determination of preservatives in soft drinks, yogurts and sauces by a novel solid-phase extraction element and thermal desorption-gas chromatography. Analytica Chimica Acta, 577, 62–67.