Ana C. Costa,
ISEGI, Universidade Nova de Lisboa, 1070-312 Lisboa, Portugal
(+351) 213 870 413 (+351) 213 872 140 ccosta@isegi.unl.pt
João A. Santos
Centre for the Research and Technology of Agro-Environmental and Biological Sciences, Physics Department, University of Trás-os-Montes e Alto Douro, Vila Real, Portugal
Joaquim G. Pinto
Institute for Geophysics and Meteorology, University of Cologne, Cologne, Germany
This is a post-peer-review, pre-copyedit version of an article published in
Theoretical and Applied Climatology. The final authenticated version is available
online at: https://doi.org/10.1007/s00704-011-0528-3.
This work is licensed under a
Creative Commons Attribution-NonCommercial 4.0 International License.
extremes in Portugal
2
Ana C. Costa 3
ISEGI, Universidade Nova de Lisboa, 1070-312 Lisboa, Portugal 4 (+351) 213 870 413 5 (+351) 213 872 140 6 ccosta@isegi.unl.pt 7 8 João A. Santos 9
Centre for the Research and Technology of Agro-Environmental and Biological 10
Sciences, Physics Department, University of Trás-os-Montes e Alto Douro, Vila 11 Real, Portugal 12 13 Joaquim G. Pinto 14
Institute for Geophysics and Meteorology, University of Cologne, Cologne, 15
Germany 16
17 18
2
ABSTRACT
19
Precipitation indices are commonly used as climate change indicators. Considering four
CLIVAR-20
recommended indices, this study assesses possible changes in their spatial patterns over Portugal
21
under future climatic conditions. Precipitation data from the regional climate model
COSMO-22
CLM ensemble simulations with ECHAM5/MPI-OM1 boundary conditions are used for this
23
purpose. For recent-past, medians and probability density functions of the CCLM-based indices
24
are validated against station-based and EOBS-based (gridded daily precipitation data provided by
25
the ECA&D project) indices. It is demonstrated that the model is able to realistically reproduce not
26
only precipitation, but also the corresponding extreme indices. Climate change projections for
27
2071–2100 (A1B and B1 SRES scenarios) reveal significant decreases in total precipitation,
28
particularly in autumn over northwestern and southern Portugal, though changes exhibit distinct
29
local and seasonal patterns and are typically stronger for A1B than for B1. The increase in winter
30
precipitation over northeastern Portugal in A1B is the most important exception to the overall
31
drying trend. Contributions of extreme precipitation events to total precipitation are also expected
32
to increase, mainly in winter and spring over northeastern Portugal. Strong projected increases in
33
the dry spell lengths in autumn and spring are also noteworthy, giving evidence for an extension of
34
the dry season from summer to spring and autumn. Although no coupling analysis is undertaken,
35
these changes are qualitatively related to modifications in the large-scale circulation over the
Euro-36
Atlantic area, more specifically to shifts in the position of the Azores High and associated changes
37
in the large-scale pressure gradient over the area.
38
Keywords: extreme precipitation indices, future scenarios, Portugal, COSMO-39
CLM, ECHAM5/MPI-OM1, regional modelling 40
Abbreviations: CCLM, COSMO-CLM – Consortium for Small-Scale Modelling – Climate
41
version of the Lokal-Model; GCM, Global Climate
42
Model; GHG, greenhouse gas; IPCC, International
43
Panel on Climate Change; MSLP, mean sea level
44
pressure; NAO, North Atlantic Oscillation; RCM,
45
regional climate model; SRES, Synthesis Report on
46
Emission Scenarios; WMW, Wilcoxon-Mann-Whitney
47 48
3
1. Introduction
49
Precipitation is one of the most relevant climatic parameters, not only in 50
describing the climatic conditions at a given location, but also in assessing the 51
potential impacts of climate change on many environmental and socio-economic 52
systems (e.g. Giorgi 2006). Precipitation is decisive for many systems that 53
critically depend on its amounts and regularity, such as the design and 54
management of irrigation systems, farm management systems, water supplies and 55
hydropower generation. Precipitation extremes, including either meteorological 56
droughts (dry spells with lengths above a pre-defined threshold; “dry extremes”) 57
or episodes with extremely high precipitation amounts (e.g. above the 95th 58
percentile; “wet extremes”), are also of major interest, mainly due to their 59
potential damaging impacts (Trenberth et al. 2007). They often trigger severe 60
hydrological droughts, devastating floods, and landslides, among other extreme 61
events. 62
Taking into account the most recent climate change projections, this vulnerability 63
might be further enhanced: the frequencies of occurrence and strength of 64
precipitation extremes have not only sharply increased worldwide since the 1960s 65
(Trenberth et al. 2007), but are also expected to grow until the end of this century 66
(Meehl et al. 2007). Significant changes in the frequencies of occurrence of 67
extreme precipitation events under human-driven climate change (due to 68
anthropogenic radiative forcing) are projected throughout Europe (Beniston et al. 69
2007; Frei et al. 2006; Santos et al. 2007a). Most of these changes are related to a 70
northward and/or eastward shift in the synoptic activity over the North Atlantic 71
under future climate conditions (e.g. Bengtsson et al. 2006; Pinto et al. 2006; 72
Ulbrich et al. 2009). In southern Europe, extensive irrigation might be required in 73
response to higher temperatures, enhanced evapotranspiration, less precipitation 74
and prolonged dry spells in future climate (Kjellström et al. 2011; Kostopoulou 75
and Jones 2005; Sillmann and Roeckner 2008; Vicente-Serrano and Cuadrat-Prats 76
2007). However, the local climate change signal may be significantly different 77
from the large-scale mean signal, highlighting the need of regional-scale 78
assessment studies (Christensen et al. 2007). 79
4
More specifically, Portugal is highly vulnerable to droughts, particularly taking 80
into account the strong seasonality and irregularity of its precipitation regime (e.g. 81
Santos et al. 2007b, 2009a). Further, precipitation in Portugal is strongly 82
dependent on the large-scale atmospheric circulation within the Euro-Atlantic 83
sector (e.g. Goodess and Jones 2002; Santos et al. 2005; Ulbrich et al. 1999). As 84
an illustration, it has been shown that anomalously wet winters in Portugal, such 85
as the 2009/2010 winter, are trigged by anomalies in the atmospheric flow over 86
the North Atlantic (cf. Andrade et al. 2011; Vicente-Serrano et al. 2011). 87
Furthermore, future projections predict higher temperature extremes over 88
mainland Portugal with increasing greenhouse gas (GHG) forcing (Carvalho et al. 89
2010; Ramos et al. 2011). 90
On the other hand, the severest droughts in Portugal are often related to the 91
development of strong and persistent anticyclonic ridges, associated with quasi-92
stationary and equivalent barotropic anomalies in the Eastern North Atlantic 93
(Santos et al. 2009b). Droughts have also major impacts on Portugal, as 36% of 94
the Portuguese continental territory is already susceptible to desertification under 95
the mean climatic regime evaluated by the National Action Programme to Combat 96
Desertification, (Rosário 2004). Higher temperatures and less precipitation will 97
potentially amplify the vulnerability of some Portuguese regions to desertification, 98
by increasing their economic and environmental problems, e.g. by increasing soil 99
erosion and forest fires, and by decreasing agro-forestry-grazing productivity, 100
aquifers recharge and biological diversity. 101
Therefore, precipitation change scenarios, not only focused on central tendency 102
parameters (e.g. mean precipitation), but also on the projected changes in the 103
occurrence of extremes, are of high relevance in developing suitable 104
mitigation/adaptation measures at local and regional scales, which might 105
effectively prevent the negative impacts of climate change on the environment and 106
on a large number of human activities. Future scenarios, specifically developed 107
for Portugal using global-regional numerical model chains, are thereby expected 108
to provide useful information for stakeholders, decision-makers and policy-109
makers. 110
Several extreme precipitation indices are commonly used as indicators for the 111
detection and quantification of possible climate change signals (e.g. Peterson et al. 112
5
2001; Sillmann and Roeckner 2008; Tebaldi et al. 2006). In general, these 113
indicators represent events that occur several times per season, having then more 114
robust statistical properties than other measures of extremes located in the very far 115
tails of the distributions (e.g. Alexander et al. 2006; Frich et al. 2002). Aiming at 116
isolating the likely temporal changes in the spatial patterns of precipitation 117
extremes over the Portuguese mainland, four widely known indices are selected in 118
this study: three of them are specifically devoted to the analysis of “wet extremes” 119
and one to the analysis of “dry extremes”. As such, the selected indices jointly 120
provide information from both tails of the distributions. Although these four 121
indices represent different perspectives of the extreme events, they are 122
undoubtedly interrelated, as will be apparent in the discussion of the results 123
below. 124
The first goal of the present study is to assess whether the selected global-regional 125
numerical model chain is able to replicate not only precipitation totals, but also its 126
extreme precipitation indices in Portugal. Secondly, the potential changes in these 127
extreme indices under future climate projections are analysed. Section 2 briefly 128
describes the regional model, the precipitation indices and the methodology. In 129
Section 3.1, the model-based indices are validated by observation-based indices, 130
computed using both weather station data and gridded daily precipitation. Future 131
climate projections for the indices are presented in Section 3.2. Lastly, a 132
discussion of the main results is presented in Section 4. 133
2. Data and Methods
1342.1 Regional model
135
Climate modelling using Earth system numerical models is the most valuable tool 136
for assessing climate change at global, regional and local scales (Randall et al. 137
2007). Climate change projections are commonly generated by varying the GHG 138
concentrations in the Earth system models (boundary conditions), according to 139
pre-specified emission pathways based on likely storylines of the human 140
development and population growth. The International Panel on Climate Change 141
(IPCC) produced a number of family scenarios until the end of the 21st century, 142
described in its Synthesis Report on Emission Scenarios (SRES), which cover a 143
6
feasible level of uncertainty and have been widely applied in climate research and 144
in modelling the impacts of climate change on a vast number of systems 145
(Nakićenović and Swart 2000). 146
However, the output fields from global climate models are commonly defined 147
over relatively coarse spatial grids, not allowing assessments at local/regional 148
scales. Therefore, regional climate models nested in global models have been used 149
as a dynamically-coherent downscaling strategy, generating higher resolution 150
datasets. In the present study, climate change assessments for Portugal are based 151
on simulations produced by the state-of-the-art regional climate model COSMO-152
CLM (Consortium for Small-Scale Modelling – Climate version of the Lokal-153
Model; Böhm et al. 2006, Rockel et al. 2008; hereafter CCLM). Model output is 154
available over a regular grid of 0.165° latitude x longitude (grid size of about 18 155
km). This grid resolution is higher than the 25 km grid size in the ENSEMBLES 156
project models (van der Linden and Mitchell, 2009), which is an important 157
advantage, particularly when carrying out regional climate change assessments 158
such as in the present study. 159
The CCLM is nested in the ECHAM5/MPI-OM1 global circulation model for 160
both past and future climate conditions (Roeckner et al 2006; hereafter 161
ECHAM5). The ECHAM5 simulations have been extensively used in many 162
previous studies. (e.g. Bengtsson et al. 2006; Pinto et al. 2007; Demuzere et al., 163
2009). As an illustration, Pinto et al. (2007) analyzed the impact of the enhanced 164
GHG forcing on the synoptic activity using ECHAM5 simulations. For the CCLM 165
simulations, a two-member ensemble is used in the present study for both a 166
recent-past period (C20, 1961–2000, cf. Lautenschlager et al. 2009a, b) and two 167
future scenarios (IPCC SRES A1B and B1 scenarios, 2071–2100; cf. 168
Lautenschlager et al. 2009c-f). The SRES A2 scenario runs are currently not 169
available. The A1B scenario corresponds to a balance across all energy sources 170
(fossil and non-fossil energies), while the B1 scenario features a more 171
environmentally sustainable world (Nakićenović and Swart 2000); during the 21st 172
century, the carbon dioxide concentrations raises from 367 ppm (year 2000) to 173
540 ppm (B1) and 703 ppm (A1B, both year 2100). Data from these CCLM runs, 174
extracted only for a sector covering the Portuguese mainland (Portuguese sector 175
hereafter: 36.8º–42.2ºN; 9.6º–5.8ºW; 560 grid-boxes), are used here. The two 176
7
ensemble members have very similar signals, as it is exemplified for the A1B 177
scenario (Figs. A1-A8). Therefore, in all upcoming analysis, they are merged and 178
jointly analysed for the same period and scenario, doubling the respective sample 179
sizes. 180
The skilfulness of the CCLM in reproducing different atmospheric fields (e.g. 181
Hollweg et al. 2008) and precipitation characteristics (e.g. Bachner et al. 2008; 182
Roesch et al. 2008) has already been documented. The CCLM data used here has 183
already been considered in a large number of climate impact studies (e.g. Früh et 184
al. 2011; Malheiro et al. 2010; Panferov et al. 2009). Nevertheless, a 185
complementary model validation is undertaken herein, now giving more emphasis 186
to the CCLM skill in simulating the extreme precipitation indices in Portugal. 187
Despite the model validation for the present-day conditions, it must be stressed 188
that this is only a 'necessary but not sufficient' condition for assessing the 189
reliability of future projections. 190
2.2 Precipitation indices
191
Four extreme precipitation indices recommended by the joint project 192
CCI/CLIVAR/JCOMM Expert Team on Climate Change Detection and Indices 193
(http://cccma.seos.uvic.ca/ETCCDI/indices.shtml) are selected: Rx5day, R95T, 194
R95pTOT and CDD (Frich et al. 2002; Karl et al. 1999; Peterson 2005). The 195
Rx5day index is defined as the highest consecutive 5-day precipitation total (in 196
mm), providing then a measure of the medium-term precipitation totals. The 197
R95T index is computed as the ratio between R95pTOT and PRCPTOT, where 198
R95pTOT (in mm) is the total precipitation falling in days with amounts greater 199
than the corresponding long-term 95th percentile (calculated only for wet days and 200
for the baseline period 1961–1990) and PRCPTOT is the total precipitation falling 201
in wet days (in mm). A wet day is defined as a day with an accumulated 202
precipitation of at least 1.0 mm (otherwise it is a dry day). Hence, the R95T 203
represents the dimensionless fraction of total precipitation falling during extreme 204
rainfall events or, in other words, the contribution of extreme events to total 205
precipitation (in %). Finally, CDD is defined as the maximum length of a dry spell 206
(in days per season). The extreme indices are computed at all CCLM grid-boxes 207
within the Portuguese sector for each meteorological season separately (winter: 208
8
DJF; spring: MAM; summer: JJA; autumn: SON). This seasonal analysis is 209
plainly justified when considering the aforementioned strong seasonality of the 210
Portuguese precipitation regime (Gallego et al. 2011; Trigo and DaCamara 2000). 211
For the CCLM validation, the indices are also calculated for a network of 13 212
weather stations in Portugal (Fig. 1). Daily precipitation recorded at seven 213
meteorological stations (Barcelos, Porto, Vila Real, Bragança, Coimbra, Lisboa 214
and Beja) was provided by the European Climate Assessment & Dataset 215
(ECA&D; http://eca.knmi.nl/), while data from the six remaining stations was 216
supplied by the Instituto Nacional da Água (INAG). Only daily precipitation time 217
series without data gaps within a minimum length of 30 years were retained. 218
Some stations were also rejected because of their close proximity to other stations. 219
Data quality checking of the seven ECA&D stations was already undertaken 220
within this project (e.g., Klein Tank et al. 2002; Wijngaard et al. 2003). The 221
INAG stations were quality-controlled and comprehensively studied for 222
homogeneity by Costa and Soares (2009a, 2009b). 223
2.3 Methodological framework
224
2.3.1 CCLM validation 225
The CCLM-based indices computed for the recent-past period (1961–2000) are 226
compared to those based on observational data, recorded at the network of 13 227
Portuguese weather stations (Fig. 1); the relatively low density of available 228
weather stations in central Portugal is noteworthy. The station-based indices are 229
compared to the corresponding CCLM-based indices at the grid-boxes that 230
enclose each station (grey grid boxes in Fig. 1). This comparison is carried out by 231
applying both the nonparametric Wilcoxon-Mann-Whitney test (WMW; Mann 232
and Whitney 1947; Wilcoxon 1945) for equal medians and the two-sample 233
Kolmogorov-Smirnov test for equal probability density functions. As previously 234
explained, the two-member ensemble medians and probability density functions 235
are used for validation, though the validation outcomes are very similar to those 236
obtained using single member statistics (not shown). 237
The WMW test can be summarised as follows. Simple linear rank statistics have 238
the form: 239
9
= = n 1 j j ja(R ) c S (1) 240where Rj is the rank of observation j; a(R j) is the score based on R j; cj is an 241
indicator variable denoting the group (i.e., period) to which the j-th observation 242
belongs; and n is the sample size. Wilcoxon scores are simply the ranks: 243 j j) R R ( a = (2) 244
Using Wilcoxon scores in the linear rank statistic for two-sample data (Eq. 1) 245
produces the rank sum statistic of the WMW. Standard asymptotic methods to 246
compute the p-values of the test imply the assumption that the test statistic follows 247
a particular distribution when the sample size is large enough. Asymptotic results 248
might be unreliable, not only when the sample size is not large, but also when the 249
distribution of data is sparse, skewed or heavily tied. If the asymptotic 250
assumptions are not met, the asymptotic p-values are not reliable approximations 251
to the true p-values. In such situations, exact p-values can be estimated by a 252
Monte Carlo simulation. 253
The p-values of the test are estimated using Monte Carlo simulations with 10 000 254
samples. The random sample of 10 000 tables is generated through the algorithm 255
proposed by Agresti et al. (1979), which generates tables in proportion to their 256
hypergeometric probabilities conditional on the marginal frequencies. Each 257
sample table has the same total sample size, row totals and column totals as the 258
observed table. For each sample table, the value of the test statistic is computed 259
and compared to the value obtained for the observed table. When estimating a 260
right-sided p-value, for example, the p-value estimate equals to the relative 261
frequency of sample tables for which the test statistic is greater than or equal to 262
the observed test statistic. 263
In order to improve the CCLM validation, the observational gridded daily 264
precipitation obtained from the EOBS dataset and provided by the ECA&D 265
project (Haylock et al. 2008) is also used. Being a gridded dataset, with a spatial 266
aggregation of observations, it enables a more direct validation of the CCLM 267
output. However, it does not substitute station data, which does not suffer from 268
gridding biases that may be particularly significant when considering daily 269
precipitation. It should also be noted that the EOBS grid has a spatial resolution of 270
10
25 km (as in the ENSEMBLES-project models) that does not directly correspond 271
to the CCLM grid. Hence, the nearest EOBS grid cell from each CCLM grey cell 272
in Fig. 1 (with the closest central points) is extracted for the CCLM validation. 273
The smoothed topography in the EOBS grid may also explain important 274
discrepancies between EOBS-estimated medians and those obtained from station 275
data, despite being both observational datasets; this is particularly pertinent over 276
the northern half of Portugal, where orography is generally quite complex. 277
It is still worth noting that the validation of regional climate model (RCM) data 278
against observations is not trivial. Model variables are averages over a grid-box 279
area, while station observations are point values that may be more or less 280
representative of a certain area. To assess this problem, a number of model output 281
statistic techniques have been developed (cf. Maraun et al. 2010 for a review). 282
However, this problem is considered to be less important when considering 283
aggregated variables (over time), as the aggregation makes the RCM output and 284
observations more comparable. Therefore, no model output statistics is performed 285
in this study. 286
2.3.2 Climate change assessment 287
The seasonal distributions of the four CCLM-based indices are tested for their 288
normality, both in the recent-past period (1961–2000) and in the future period 289
(2071–2100), through the application of the Shapiro-Wilk test (Shapiro and Wilk 290
1965) to all 560 grid-boxes (Portuguese sector). The normality hypothesis is 291
rejected at the 95% confidence level in most of the seasonal indices and for most 292
grid-boxes, particularly in the recent-past period (1961–2000). Taking for 293
example the winter two-member ensemble CDD index, the normality hypothesis 294
is rejected at 93% of the grid-boxes in 1961–2000, while it is rejected at only 23% 295
in 2071–2100. As a result, nonparametric approaches are more appropriate for the 296
current statistical analysis and are used here. 297
As previously stated, climate change projections for the two-member ensemble 298
indices are calculated and their statistical significance is assessed through the 299
application of the one-sided WMW test to all 560 grid-boxes. Hence, the WMW 300
one-sided tests are used both to validate the model outputs using observational 301
11
datasets and to compare the two-member ensemble medians of the indices in 302
2071–2100 with their values in 1961–2000 (recent-past period). 303
3. Results
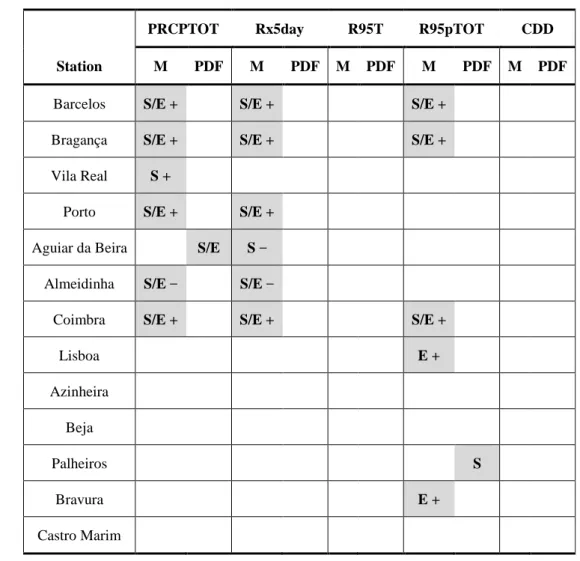
3043.1 CCLM validation for recent climate conditions
305
The model validation is carried out for the recent-past period (C20; 1961–2000), 306
when the CCLM is forced by historical records of GHG emissions, providing thus 307
possible representations of recent climatic conditions that can be compared to 308
historical data. In order to compare the two-member ensemble medians (M) and 309
probability density functions (PDF) of the CCLM-based indices with the 310
corresponding station-based and EOBS-based indices (PRCPTOT, Rx5day, R95T, 311
R95pTOT and CDD), the hypothesis testing results for equal M (WMW test) and 312
for equal PDF (two-sample Kolmogorov-Smirnov test applied to the centred 313
indices) are summarized in Tables 1–3 for each season in 1961–2000. In these 314
tables, grey cells indicate a rejection of the null hypothesis at a 1% significance 315
level. S or E characters specify whether the null hypothesis is rejected based on 316
station or EOBS data, respectively. Overestimation (underestimation) of the 317
medians by CCLM are also indicated by ‘+’ (‘-’). As summer precipitation is 318
generally very scarce and highly irregular in continental Portugal (e.g. Trigo and 319
DaCamara 2000), it does not fulfil the basic assumptions for a proper application 320
of the hypothesis tests and will then not be considered in this testing. 321
A close inspection of the hypothesis testing outcomes reveals that the CCLM 322
clearly tends to overestimate precipitation (PRCPTOT) over northern and central-323
western Portugal (Barcelos, Bragança, Vila Real, Porto, Coimbra and Lisboa), 324
while it tends to underestimate precipitation in central-eastern Portugal (Aguiar da 325
Beira and Almeidinha). Although the topographic barrier effect in central and 326
northern Portugal, imposed by mountain ranges that are predominantly north-327
south-oriented, contributes to an actual strong contrast between west-side 328
(windward) and east-side precipitation (leeward), the validation results show that 329
the CCLM tends to overestimate this barrier effect by overestimating 330
(underestimating) PRCPTOT in the west (east) side. Similar considerations can be 331
made for the most southwestern part of the country, where the effect of the 332
12
smaller-scale orographic barrier is also exacerbated by the CCLM, explaining the 333
overestimations (underestimations) of PRCPTOT in Bravura (Palheiros). These 334
model biases in PRCPTOT are particularly pronounced in winter, when frontal 335
and orographic precipitations prevail, enhancing the topographic barrier effect. 336
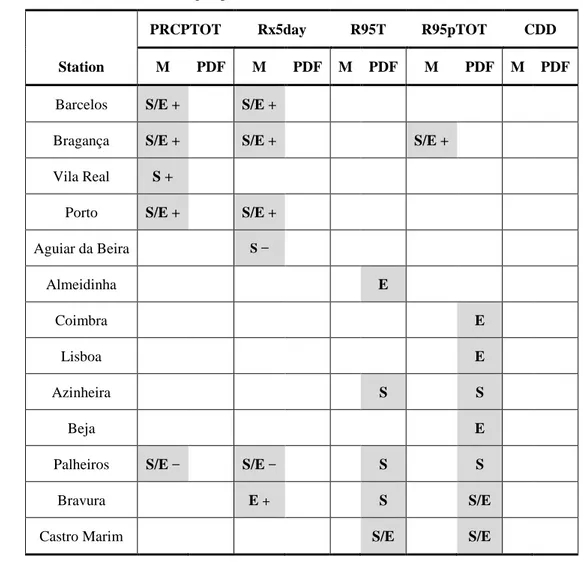
The previous shortcomings from the CCLM simulation are also mostly reflected 337
in Rx5day (cf. Tables 1–3), where analogous biases are apparent. This can be 338
easily understood, since this index represents precipitation amounts accumulated 339
in a consecutive 5-day period. Some repercussions of the PRCPTOT biases in 340
R95pTOT are also identified, though to a much lesser extent than in Rx5day and 341
without significant impact on the R95T derived-index. Lastly, no significant 342
deviations in the CDD index are detected, which means that the PRCPTOT biases 343
tend to produce biases in the daily precipitation totals, rather than in the frequency 344
of occurrence of rainy days. In fact, for all selected weather stations, the simulated 345
numbers of rainy days per season do not show significant biases (not shown). 346
All these biases in the indices’ medians are offset when taking differences 347
between two periods (climate change signal). Although bias in medians can be 348
easily calibrated in most of the applications, they also suggest some limitations in 349
modelling the physical processes underlying precipitation. Conversely, biases in 350
the shape of the simulated distributions are generally more difficult to correct, 351
being important limitations of model simulation. No important biases in the 352
shapes of PRCPTOT (apart from the winter in Aguiar da Beira), Rx5day and 353
CDD are found, which highlights the CCLM skilfulness in reproducing the 354
distributions of daily precipitation in Portugal. 355
Nevertheless, significant biases can be found in the distributions of R95pTOT, 356
mainly in autumn and spring, with direct implications also in the distributions of 357
R95T. This constraint only applies to southern Portugal (Azinheira, Beja, 358
Palheiros, Bravura and Castro Marim) and this spatial coherency suggests some 359
inability of the CCLM in simulating extreme precipitation in this region. A more 360
detailed analysis showed that the CCLM tends to overestimate the precipitation 361
amounts occurring in some extreme events (not shown). Consequently, the 362
contribution of extreme precipitation events to total precipitation tends to be 363
overestimated by the RCM, yielding a deviation in the shape of the R95pTOT and 364
R95T distributions and ultimately contributing to the rejection of the null-365
13
hypothesis. No significant differences can be found in the validation results using 366
either station or EOBS-derived indices (Tables 1-3). 367
3.2 Climate change projections
368
After the validation of the CCLM-based indices for recent climate conditions, we 369
now evaluate the same two-member ensemble indices and precipitation totals for 370
a period at the end of the current century (2071–2100; 30 years), following the 371
A1B and B1 SRES scenarios, and compare them to recent climate conditions 372
(1961–2000; 40 years). A sensitivity study using a 30-year period for quantifying 373
the recent-past conditions (either 1961-1990 or 1971-2000) revealed no 374
significant changes in the results (not shown). 375
Although changes in the accumulated precipitation values are of utmost relevance 376
in regional climate change assessments, the projected changes in extremes might 377
also play a key role in the decision-making processes. In this way, the statistical 378
significance of the changes in the selected four extreme indices (Rx5day, R95T, 379
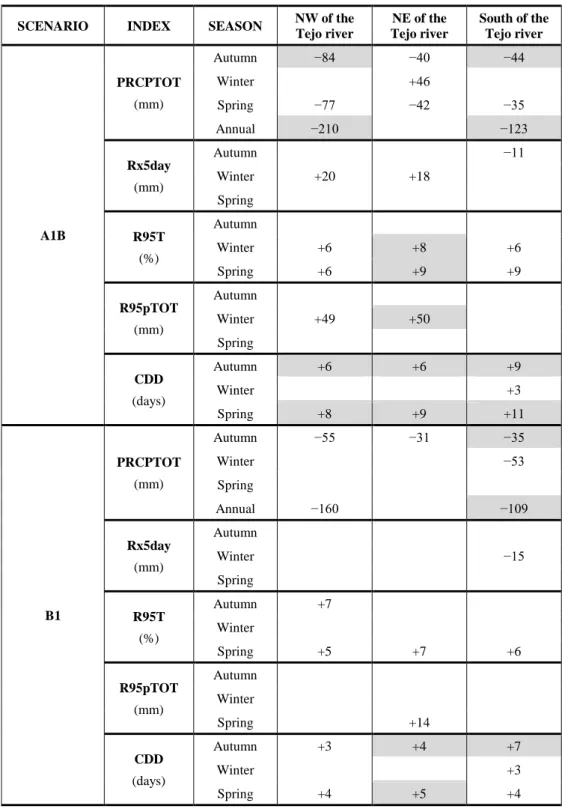
R95pTOT and CDD) is assessed here for each season separately. Since the 380
projected changes in the extreme precipitation indices exhibit distinct local and 381
seasonal patterns, Portugal can be divided into three regions. These regions 382
roughly correspond to the northwestern, northeastern and southern Portugal, 383
where the Tejo River delineates the boundary between northern and southern 384
Portugal. Administrative divisions represent the boundaries between northwestern 385
and northeastern Portugal (cf. limits outlined in Figs. 3-5). Table 4 discriminates 386
the most significant changes within each region and provides a summary of the 387
results described below. Although the A1B scenario implies more significant 388
changes than B1 (lower GHG forcing), these changes are of the same signal. 389
3.2.1 Precipitation (PRCPTOT) 390
The projected changes in the annual precipitation under the A1B scenario reveal 391
an overall decrease throughout Portugal, apart from some few exceptions in the 392
interior north (Fig. 2); north-western Portugal is projected to experience the most 393
remarkable decrease (less 200–400 mm per year). For the seasonal totals, the 394
projected changes are largely coherent with those found for the annual totals, with 395
the exception of winter, when precipitation increases are projected over northern 396
14
Portugal. Statistical significances are not assessed in these patterns because, as 397
shown before, daily precipitation is far from being normally distributed and the 398
WMW tests are applied below to the differences in the PRCPTOT medians. 399
Hence, the climate change signal for the annual precipitation in Portugal mainly 400
reflects a widening of the dry season from summer to autumn and spring. The 401
increases in wintertime precipitation are not generally large enough to offset the 402
drying trend in northwestern Portugal, but can explain the absence of a clear trend 403
in the annual totals over northeastern Portugal. 404
Results of the non-parametric WMW tests for the annual precipitation totals 405
(PRCPTOT) under A1B (Fig. 3) are in clear agreement with the projected changes 406
in the precipitation amounts (Fig. 2), though the most significant decreases are 407
now verified over southern Portugal. Precipitation in this region is already at very 408
low levels, making decreases of 200 mm very substantial. The statistically 409
significant increases in wintertime precipitation over northeastern Portugal are 410
still noteworthy (Fig. 3). In fact, they tend to compensate the downward 411
precipitation trends in the other seasons, leading to non-significant changes in the 412
annual amounts over this region. The strong decreases (at a 99% confidence level) 413
in autumn precipitation over northwestern and southern Portugal are also worth 414
mentioning. Similar results are obtained for the B1 scenario in autumn and annual 415
values (Fig. A9), but with less significant decreases in precipitation (lower forcing 416
scenario). Winter precipitation is also expected to decrease over the south. In 417
spring, B1 is in clear contrast with A1B (Figs. A9 and 3, respectively), showing 418
no significant changes throughout Portugal. 419
3.2.2 Autumn indices 420
For autumn, the significant increase (at a 99% confidence level) in the CDD index 421
is the most remarkable change in the precipitation regime in Portugal (Fig. 4). The 422
length of the dry spells is predicted to increase, on average, 9 days in the south 423
and 6 days in the northern part of the country (Table 4). The other indices do not 424
depict clear and spatially consistent signals, except the Rx5day index which is 425
predicted to decrease in a large area of the south. 426
In the B1 scenario, the significant increase in the CDD index over the country is 427
still remarkable (Fig. A10), whereas the significant decreasing patterns of the 428
15
Rx5day index are only located around the southern coastline. The R95T index 429
presents a highly significant increase in the Atlantic Ocean along the northwestern 430
coast in the A1B scenario (Fig. 4), whereas significant increases also appear 431
inland in the B1 scenario (Fig. A10). 432
3.2.3 Winter indices 433
For winter, however, there is a significant increase in the contribution of extreme 434
precipitation to the total amounts (R95T) over Portugal (at least 6% on average; 435
cf. Table 4), while no strong signal exists for the CDD index, except in the 436
southernmost part of the country (Fig. 5). The Rx5day and R95pTOT indices tend 437
to be a direct manifestation of the changes in the precipitation amounts (Fig. 2), 438
with most of the significant increases occurring over northern Portugal. In fact, 439
according to Table 4, the highest consecutive 5-day precipitation total (Rx5day) is 440
expected to increase, on average, at least 18 mm in the north, which is consistent 441
with the expected increase of at least 49 mm in the total amount of precipitation 442
associated with extreme events (R95pTOT). The B1 scenario results (Fig. A11) 443
imply less significant changes than A1B for the “wet extremes”. 444
These outcomes show that the CCLM climate change projections (under the A1B 445
and B1 SRES scenarios) for precipitation in Portugal suggest an overall increase 446
in the contribution of extreme precipitation events to total precipitation in winter. 447
It is also worth mentioning that, under the B1 scenario, the Rx5day index is 448
predicted to significantly decrease in the south, while the pattern of increase in the 449
length of the dry spells (CDD) extends over a larger area from the south to the 450
northeast. 451
3.2.4 Spring indices 452
Finally, in spring similar results to autumn are obtained (Figs. 6 and A12). There 453
is a pronounced increase in the length of the dry spells (CDD) over the whole 454
country: the CDD is predicted to increase, on average, 11 days in southern 455
Portugal and at least 8 days in the north (Table 4). Such increase might yield more 456
frequent and severe meteorological droughts that commonly play a key role in 457
triggering hydrological droughts. 458
16
Spring precipitation is projected to undergo a significant decrease, which is 459
accompanied by a clear extension of the “dry spells”, but without clear changes in 460
the occurrence of “wet extremes”. 461
3.3.5 Dynamical features 462
Both sides of the precipitation extremes (extremely high precipitation events and 463
meteorological droughts) are projected to become more frequent under human-464
driven climate change. Apart from some differences in detail, the main results for 465
both scenarios are quite similar (Figs. 4–6 and A10–A12). However, more “dry 466
extremes” (CDD) and less “wet extremes” can be clearly identified in B1 than in 467
A1B in winter. A decrease in PRCPTOT is apparent, particularly in autumn, and 468
over northwestern and southern Portugal. The contribution of extreme 469
precipitation to total precipitation (R95T) is also expected to increase, mainly in 470
winter and spring over northeastern Portugal. The length of dry spells (CDD) is 471
also projected to increase throughout Portugal, primarily in autumn and spring. 472
In order to understand the dynamical features underlying the previous changes in 473
the precipitation extreme indices, the mean sea level pressure (MSLP) fields for 474
the recent-past period (1961-2000) and for the future period (2071–2100) under 475
A1B and B1 are now analysed using the ECHAM5 data for the whole North 476
Atlantic / European Region (Fig. 7 and A13). For the recent-past period, 477
ECHAM5 underestimates MSLP north of the British Isles, and slightly 478
overestimates MSLP over the Mediterranean, leading to a stronger latitudinal 479
pressure gradient than in reality (e.g., Demuzere et al., 2009). However, 480
ECHAM5 reproduces the mean MSLP pattern over the North Atlantic / European 481
area better than most GCMs (Donat et al., 2010). For future climate conditions, a 482
slight northward extension in the climate-mean Azores high pressure system is 483
depicted in these patterns in both spring and autumn (Fig. 7), explaining the 484
projected precipitation decreases in these two seasons (Fig. 2). In winter, 485
however, there are a clear strengthening and significant shifts in its location, but 486
with significant differences between both scenarios: the maximum positive 487
anomaly in the MSLP is found northward of Iberia in B1 (Fig. A13), whilst it is 488
found over the Mediterranean Basin in A1B (Fig. 7). These differences justify the 489
contrasting projections for winter precipitation, since the northern half of Portugal 490
17
is much more exposed to the westerly winds and to the associated cyclonic (rain-491
generating) systems in A1B than in B1. Consequently, we can state that part of the 492
projected changes in precipitation and in its extreme indices, obtained with the 493
ECHAM5/CCLM model chain, reflect the shifts in the large-scale circulation over 494
the Euro-Atlantic region, as observed in ECHAM5 under future climate 495
conditions. However, these large-scale changes cannot explain all the changes in 496
precipitation, particularly in its extremes. In fact, the atmospheric dynamics 497
leading to precipitation extremes is complex and cannot be exclusively related to 498
large-scale changes. 499
4. Summary and discussion
500The present study investigated possible temporal changes in the spatial patterns of 501
precipitation in Portugal, based on simulations with the regional climate model 502
CCLM for current (1961-2000) and future (2071-2100) climate conditions under 503
the A1B and B1 SRES scenarios. With this aim, total precipitation and four 504
CLIVAR-recommended indices (Rx5day, R95T, R95pTOT and CDD) were 505
analysed. The validation against station data shows that CCLM is able to reliably 506
reproduce the main statistical characteristics of precipitation in Portugal, better for 507
the northern than for the southern half. Similar results were obtained with the 508
EOBS-derived indices. 509
Regarding a possible climate change signal, results give clear evidence for a 510
future increase in both the occurrence and strength of the precipitation extremes 511
over Portugal (following both scenarios). Typically, the results for the B1 scenario 512
(more environmentally sustainable than the A1B) revealed, as expected, less 513
significant changes in the precipitation totals and respective indices than for the 514
A1B, but their spatial patterns tend to be very similar; A1B might be considered 515
an intermediate emission scenario. Globally, the western half of the country 516
(windward side) tends to be subject to more significant decreases in precipitation 517
amounts than its eastern half (leeward side). There is a projected decrease in the 518
precipitation totals over most of the country, particularly in autumn over 519
northwestern and southern Portugal. Extreme precipitation is also more likely in 520
the future, mainly in winter and spring over northeastern Portugal (R95pTOT and 521
18
R95T). The length of dry spells (CDD) is also expected to increase over most of 522
the country, particularly in spring and autumn. 523
These results are in line with the recorded trends in extreme precipitation during 524
the last century. In the context of the Iberian Peninsula, Gallego et al. (2011) 525
found a significant decrease in light rainfall days for 1903–2003 over southern 526
Portugal. In addition, Costa and Soares (2009a) found an increase in the length of 527
dry spells and a tendency towards drier climatic conditions for 1955–1999 in that 528
same region. A decreasing trend in March precipitation over the twentieth century 529
for mainland Portugal was also reported in other studies (e.g. de Lima et al. 2010; 530
Trigo and DaCamara, 2000). 531
Our results are also consistent with those obtained by Sillmann and Roeckner 532
(2008), which have also used the ECHAM5 simulations with the A1B and B1 533
scenarios. They concluded that the CDD index is projected to substantially 534
increase over southern Europe: the longest dry period within a year is projected to 535
be prolonged by 1 (1.5) months at the end of this century under the B1 scenario 536
(A1B scenario). However, the projected changes in the “wet extremes” over the 537
Mediterranean are less apparent in the aforementioned study than in our study, 538
which might be due to the relatively coarse grid (low spatial resolution) of the 539
global model compared to the CCLM output considered here. 540
The large-scale circulation over the mid-latitude North Atlantic is strongly 541
connected to the position and intensity of the Icelandic low and of the Azores 542
high, with Portugal being more or less affected by westerly winds that carry moist 543
air originated in the North Atlantic (e.g. Santos et al. 2005; Trigo et al. 2002). 544
Precipitation in Portugal is indeed largely favoured by the negative phase of the 545
North Atlantic Oscillation (NAO), particularly during winter (e.g. Andrade et al. 546
2011; Trigo and DaCamara 2000; Ulbrich et al. 1999). 547
Based on the spatial patterns of the changes in the indices, Portugal was divided 548
into three regions (northwest, northeast and south) that are also characterized by 549
distinct precipitation regimes. In fact, precipitation in the north is predominantly 550
frontal and orographic, whereas it tends to be more associated with cyclogenetic 551
activity in the south (Trigo and DaCamara 2000). Additionally, as the mountain 552
ranges located north of the Tejo River have a significant north-south orientation, 553
on their windward side, forced lifting of approaching air masses causes orographic 554
19
precipitation. As a result, precipitation will decrease on the leeward side, being 555
the leeward slopes drier and warmer than the windward slopes (Föhn effect). 556
Therefore, there is a distinct precipitation pattern in the western (windward-side) 557
and eastern (leeward-side) regions northwards of the Tejo River, justifying the 558
separation between northwestern and northeastern Portugal. Orographic effects 559
are much weaker in southern Portugal. All these spatial features are well captured 560
by the CCLM, despite some overestimation of the orographic effects, and clearly 561
support the decision to depict the three regions considered in the present study. 562
Future scenarios for precipitation and its extremes mostly reflect the projected 563
strengthening and displacement of the Azores high pressure system, particularly 564
for winter, which are also manifested as an upward trend in the NAO index 565
(stronger and more frequent positive phase; cf. Pinto et al. 2007; Stephenson et al. 566
2006), leading to more stable and drier atmospheric conditions in the future (Trigo 567
et al. 2002). These findings are also widely supported by many previous studies 568
(Haylock and Goodess 2004; Kyselý and Domonkos 2006; Pauling et al. 2006; 569
Scaife et al. 2008) and are related with a northward and/or eastward shift of the 570
North Atlantic storm tracks under future climate conditions (e.g. Bengtsson et al. 571
2006; Pinto et al. 2006; Ulbrich et al. 2009). These dynamical changes also 572
explain the widening of the summertime dry season. These changed dynamical 573
features are also largely unfavourable to the establishment of the moist westerly 574
winds over Portugal, coming from the North Atlantic, and to orographic 575
precipitation (mountain barrier effects), which is currently an important 576
precipitation mechanism over the western half (windward side) of the country. 577
The precipitation scenarios here presented are likely to have strong impacts on the 578
water cycle in Portugal, by contributing to a decrease in the water fluxes and 579
eventually to a weakening of the entire cycle. Similar results have also been 580
reported when investigating the impacts of climate change on the water resources 581
of the Tejo and Guadiana Rivers using future scenarios derived from the regional 582
climate model HadRM3H (Kilsby et al. 2007). Water supply and quality may then 583
be strongly affected. In fact, recent studies have documented the relevance of the 584
regular occurrence of rainy winters to refill the water dams in Portugal (Andrade 585
et al. 2011). This finding is also very relevant when planning the Portuguese 586
electricity production (as well as its distribution and consumption), since 587
20
hydropower generation represents an important fraction of the national electrical 588
production. In fact, considering the climate projections derived from the HadCM3 589
global climate model, the developed hydropower potential in Portugal is expected 590
to decrease 22.1% by the 2070s (and 44.4% using the ECHAM4/OPYC3 model) 591
(Lehner et al. 2005). The ratio of renewable energy production might then be 592
negatively affected, which implies a growth in the fossil fuel consumption (and 593
imports), as well as in the national GHG emissions. 594
Furthermore, the Portuguese agro-forestry sector tends to be highly water-595
demanding, being many of these activities based on irrigation systems that rely on 596
artificial water reservoirs and dams, which are in turn critically dependent on 597
precipitation. The greater vulnerability of many economically important cultivars 598
(e.g. grapevines, olive trees, pine trees, among many others) to excessive water 599
stress will also be a major challenge. 600
The identified increase in the dry spell length in spring and autumn, and the 601
associated extension of the dry season from spring and autumn, will also have 602
consequences in terms of forest wildfires, which have affected over 3 million ha 603
in Portugal between 1980 and 2007 (Moriondo et al. 2006). The extent of burnt 604
area in Portugal is controlled by two main factors (Pereira et al 2005; Verde and 605
Zêzere 2010): (i) a relatively long dry period with absence of precipitation in late 606
spring and early summer; and (ii) the occurrence of very intense dry spells during 607
days of extreme synoptic situations. Thus, future climate conditions should favour 608
wildfire activity. This consideration in line with other studies (e.g.., Carvalho et 609
al. 2010; Moriondo et al. 2006), which estimated an increase in the severity and 610
length of the fire season with increasing GHG forcing. 611
Furthermore, increased drought periods, forest fires and irregular precipitation 612
regimes tend to decrease vegetation cover and ecological resistance, thereby 613
increasing erosion prone areas. All these impacts of climate change in soil and 614
water may intensify the desertification susceptibility of large areas, particularly in 615
southern and northeastern Portugal. 616
Finally, it should be emphasized that the results presented here are based on a 617
single global-regional model chain (ECHAM5-CCLM). Despite the existence of 618
some level of uncertainty in our results, they are largely supported by many 619
previous studies that give clear evidence for a drying of southern Europe in 620
21
response to changes in the large-scale atmospheric flow (e.g. Beniston et al. 2007; 621
Haugen and Iversen 2008; Kilsby et al. 2007; Kjellström et al. 2011; Sillmann and 622
Roeckner 2008; Trenberth et al. 2007). In future work we aim at extending this 623
analysis to outputs from other regional model runs with multiple GCM forcing, 624
including those from the ENSEMBLES project dataset (Hewitt and Griggs, 2004; 625
van der Linden and Mitchell, 2009). 626
Acknowledgments
627We thank the MPI for Meteorology (Hamburg, Germany), the WDCC/CERA database and the
628
COSMO-CLM community for providing the COSMO-CLM data. We acknowledge the E-OBS
629
dataset from the EU-FP6 project ENSEMBLES (http://ensembles-eu.metoffice.com) and the data
630
providers in the ECA&D project (http://eca.knmi.nl).
631
Appendix: Supplementary material
632This Appendix presents a set of additional figures addressing the results obtained 633
for the B1 SRES scenario and for the two ensemble members of the A1B SRES 634
scenario. 635
References
636Agresti A, Wackerly D, Boyett JM (1979) Exact conditional tests for cross-classifications:
637
approximation of attained significance levels. Psychometrika 44:75–83
638
Alexander LV, Zhang X, Peterson TC, Caesar J et al (2006) Global observed changes in daily
639
climate extremes of temperature and precipitation. J Geophys Res 111:D05109. doi:
640
10.1029/2005JD006290
641
Andrade C, Santos JA, Pinto JG, Corte-Real J (2011) Large-scale atmospheric dynamics of the
642
wet winter 2009–2010 and its impact on hydrology in Portugal. Clim Res 46:29–41. doi:
643
10.3354/cr00945
644
Bachner S, Kapala A, Simmer C (2008) Evaluation of daily precipitation characteristics in the
645
CLM and their sensitivity to parameterizations. Meteorol Z 17:407–419. doi:
10.1127/0941-646
2948/2008/0300
647
Bengtsson L, Hodges KI, Roeckner E (2006) Storm tracks and climate change. J Climate 19:3518–
648
3543. doi: 10.1175/JCLI3815.1
649
Beniston M, Stephenson D, Christensen O, Ferro C et al (2007) Future extreme events in European
650
climate: an exploration of regional climate model projections. Climatic Change 81:71–95. doi:
651
10.1007/s10584-006-9226-z
22
Böhm U, Kücken M, Ahrens W, Block A, Hauffe D, Keuler K, Rockel B, Will A (2006) CLM -
653
the climate version of LM: Brief description and long-term applications. COSMO Newsletter
654
6:225–235
655
Carvalho A, Flannigan MD, Logan KA, Gowman LM, Miranda AI, Borrego C (2010) The impact
656
of spatial resolution on area burned and fire occurrence projections in Portugal under climate
657
change. Climatic Change 98:177–197. doi: 10.1007/s10584-009-9667-2
658
Christensen JH, Hewitson B, Busuioc A, Chen A, Gao X et al (2007) Regional Climate
659
Projections. In: Solomon S, Qin D, Manning M, Chen Z et al (eds) Climate Change 2007: The
660
Physical Science Basis. Contribution of Working Group I to the Fourth Assessment Report of the
661
Intergovernmental Panel on Climate Change, Cambridge University Press, Cambridge, United
662
Kingdom and New York, NY, USA, 847–940
663
Costa AC, Soares A (2009a) Trends in extreme precipitation indices derived from a daily rainfall
664
database for the South of Portugal. Int J Climatol 29:1956–1975. doi: 10.1002/joc.1834
665
Costa AC, Soares A (2009b) Homogenization of climate data: review and new perspectives using
666
geostatistics. Math Geosci 41:291–305. doi: 10.1007/s11004-008-9203-3
667
de Lima MIP, Carvalho SCP, de Lima JLMP (2010) Investigating annual and monthly trends in
668
precipitation structure: an overview across Portugal. Nat Hazards Earth Syst Sci 10:2429–2440.
669
doi: 10.5194/nhess-10-2429-2010
670
Demuzere M, Werner M, van Lipzig NPM, Roeckner E (2009) An analysis of present and future
671
ECHAM5 pressure fields using a classification of circulation patterns. Int J Climatol 29:1796–
672
1810. doi: 10.1002/joc.1821
673
Donat MG, Leckebusch GC, Pinto JG, Ulbrich U (2010) European storminess and associated
674
circulation weather types: Future changes deduced from a multi-model ensemble of GCM
675
simulations. Clim Res 42:27–43. doi: 10.3354/cr00853
676
Frei C, Schöll R, Fukutome S, Schmidli J, Vidale PL (2006) Future change of precipitation
677
extremes in Europe: Intercomparison of scenarios from regional climate models. J Geophys Res
678
111:D06105. doi: 10.1029/2005JD005965
679
Frich P, Alexander LV, Della-Marta P, Gleason B, Haylock M, Klein Tank AMG, Peterson T
680
(2002) Observed coherent changes in climatic extremes during the second half of the twentieth
681
century. Clim Res 19:193–212. doi: 10.3354/cr019193
682
Früh B, Becker P, Deutschländer T, Hessel J-D et al (2011) Estimation of climate change impacts
683
on the urban heat load using an urban climate model and regional climate projections. J Appl
684
Meteor Climatol 50:167–184. doi: 10.1175/2010JAMC2377.1
685
Gallego MC, Trigo RM, Vaquero JM, Brunet M et al (2011) Trends in frequency indices of daily
686
precipitation over the Iberian Peninsula during the last century. J Geophys Res 116:D02109. doi:
687
10.1029/2010JD014255
688
Giorgi F (2006) Climate change hot-spots, Geophys Res Lett 33:L08707. doi:
689
10.1029/2006GL025734
690
Goodess CM, Jones PD (2002) Links between circulation and changes in the characteristics of
691
Iberian rainfall. Int J Climatol 22:1593–1615. doi: 10.1002/joc.810
23
Haugen JE, Iversen T (2008) Response in extremes of daily precipitation and wind from a
693
downscaled multimodel ensemble of anthropogenic global climate change scenarios. Tellus A, 60:
694
411–426. doi: 10.1111/j.1600-0870.2008.00315.x
695
Haylock MR, Goodess CM (2004) Interannual variability of European extreme winter rainfall and
696
links with mean large-scale circulation. Int J Climatol 24:759–776. doi: 10.1002/joc.1033
697
Haylock MR, Hofstra N, Klein Tank AMG, Klok EJ, Jones PD, New M (2008) A European daily
698
high-resolution gridded data set of surface temperature and precipitation. J Geophys Res
699
113:D20119. doi: 10.1029/2008JD010201
700
Hewitt CD, Griggs DJ (2004) Ensembles-Based Predictions of Climate Changes and Their
701
Impacts. EOS, Transactions American Geophysical Union 85:566. doi: 10.1029/2004EO520005
702
Hollweg HD, Böhm U, Fast I, Hennemuth B, et al (2008) Ensemble simulations over Europe with
703
the regional climate model CLM forced with IPCC AR4 global scenarios. M & D Technical
704
Report 3. http://www.mad.zmaw.de/service-support/documents/reports/. Accessed 15 November
705
2010. doi: 10.2312/WDCC/MaD_TeReport_No03
706
Karl TR, Nicholls N, Ghazi A (1999) CLIVAR/GCOS/WMO workshop on indices and indicators
707
for climate extremes: Workshop summary. Climatic Change 42:3–7. doi:
708
10.1023/A:1005491526870
709
Kilsby CG, Tellier SS, Fowler HJ, Howels TR (2007) Hydrological impacts of climate change on
710
the Tejo and Guadiana Rivers. Hydrol Earth Syst Sc 11:1175–1189. doi:
10.5194/hess-11-1175-711
2007
712
Kjellström E, Nikulin G, Hansson U, Strandberg G, Ullerstig A (2011) 21st century changes in the
713
European climate: uncertainties derived from an ensemble of regional climate model simulations.
714
Tellus A, 63: 24–40. doi: 10.1111/j.1600-0870.2010.00475.x
715
Klein Tank AMG et al (2002) Daily dataset of 20th-century surface air temperature and
716
precipitation series for the European climate assessment. Int J Climatol 22:1441–1453. doi:
717
10.1002/joc.773
718
Kostopoulou E, Jones PD (2005) Assessment of climate extremes in the Eastern Mediterranean.
719
Meteorol Atmos Phys 89:69–85. doi: 10.1007/s00703-005-0122-2
720
Kyselý J, Domonkos P (2006) Recent increase in persistence of atmospheric circulation over
721
Europe: comparison with long-term variations since 1881. Int J Climatol 26:461–483. doi:
722
10.1002/joc.1265
723
Lautenschlager M, Keuler K, Wunram C, Keup-Thiel E et al (2009a) Climate Simulation with
724
CLM, Climate of the 20th Century run no.1, Data Stream 3: European region MPI-M/MaD. World
725
Data Center for Climate. doi: 10.1594/WDCC/CLM_C20_1_D3
726
Lautenschlager M, Keuler K, Wunram C, Keup-Thiel E et al (2009b) Climate Simulation with
727
CLM, Climate of the 20th Century run no.2, Data Stream 3: European region MPI-M/MaD. World
728
Data Center for Climate. doi: 10.1594/WDCC/CLM_C20_2_D3
729
Lautenschlager M, Keuler K, Wunram C, Keup-Thiel E et al (2009c) Climate Simulation with
730
CLM, Scenario A1B run no.1, Data Stream 3: European region MPI-M/MaD. World Data Center
731
for Climate. doi: 10.1594/WDCC/CLM_A1B_1_D3
24
Lautenschlager M, Keuler K, Wunram C, Keup-Thiel E et al (2009d) Climate Simulation with
733
CLM, Scenario A1B run no.2, Data Stream 3: European region MPI-M/MaD. World Data Center
734
for Climate. doi: 10.1594/WDCC/CLM_A1B_2_D3
735
Lautenschlager M, Keuler K, Wunram C, Keup-Thiel E et al (2009e) Climate Simulation with
736
CLM, Scenario B1 run no.1, Data Stream 3: European region MPI-M/MaD. World Data Center for
737
Climate. doi: 10.1594/WDCC/CLM_B1_1_D3
738
Lautenschlager M, Keuler K, Wunram C, Keup-Thiel E et al (2009f) Climate Simulation with
739
CLM, Scenario B1 run no.2, Data Stream 3: European region MPI-M/MaD. World Data Center for
740
Climate. doi: 10.1594/WDCC/CLM_B1_2_D3
741
Lehner B, Czisch G, Vassolo S (2005) The impact of global change on the hydropower potential
742
of Europe: a model-based analysis. Energy Policy 33:839–855. doi: 10.1016/j.enpol.2003.10.018
743
Malheiro AC, Santos JA, Fraga H, Pinto JG (2010) Climate change scenarios for viticultural
744
zoning in Europe. Clim Res 43:163–177. doi: 10.3354/cr00918
745
Mann HB, Whitney DR (1947) On a test of whether one of two random variables is stochastically
746
larger than the other. Ann Math Stat 18:50–60
747
Maraun D, Wetterhall F, Ireson AM, Chandler RE et al (2010) Precipitation downscaling under
748
climate change: Recent developments to bridge the gap between dynamical models and the end
749
user. Rev Geophys 48:RG3003. doi: 10.1029/2009RG000314
750
Meehl GA, Stocker TF, Collins WD, Friedlingstein P, Gaye AT et al (2007) Global climate
751
projections. In: Solomon S, Qin D, Manning M, Chen Z et al (eds) Climate Change 2007: The
752
Physical Science Basis. Contribution of Working Group I to the Fourth Assessment Report of the
753
Intergovernmental Panel on Climate Change, Cambridge University Press, Cambridge, United
754
Kingdom and New York, NY, USA
755
Moriondo M, Good P, Durão R, Bindi M, Giannakopoulos C, Corte-Real J (2006) Potential impact
756
of climate change on fire risk in the Mediterranean area. Climate Research 31:85–95. doi:
757
10.3354/cr031085
758
Nakićenović N, Swart R (eds) (2000) IPCC Special Report on Emissions Scenarios. Cambridge
759
University Press, Cambridge, United Kingdom, England
760
Panferov O, Doering C, Rauch E, Sogachev A, Ahrends B (2009) Feedbacks of windthrow for
761
Norway spruce and Scots pine stands under changing climate. Environ Res Lett 4:045019. doi:
762
10.1088/1748-9326/4/4/045019
763
Pauling A, Luterbacher J, Casty C, Wanner H (2006) Five hundred years of gridded
high-764
resolution precipitation reconstructions over Europe and the connection to large-scale circulation.
765
Clim Dynam 26:387–405. doi: 10.1007/s00382-005-0090-8
766
Pereira MG, Trigo RM, da Camara CC, Pereira JMC, Leite SM (2005) Synoptic patterns
767
associated with large summer forest fires in Portugal. Agr Forest Meteorol 129:11–25. doi:
768
10.1016/j.agrformet.2004.12.007
769
Peterson TC (2005) Climate Change Indices. WMO Bulletin 54:83–86
770
Peterson TC, Folland C, Gruza G, Hogg W, Mokssit A, Plummer N (2001) Report on the activities
771
of the Working Group on Climate Change Detection and Related Rapporteurs 1998–2001. World
25
Meteorological Organization, WCDMP–No. 47 / WMO–TD No. 1071, Geneva: Switzerland, 143
773
pp
774
Pinto JG, Spangehl T, Ulbrich U, Speth P (2006) Assessment of winter cyclone activity in a
775
transient ECHAM4-OPYC3 GHG experiment. Meteorol Z 15:279–291. doi:
10.1127/0941-776
2948/2006/0128
777
Pinto JG, Ulbrich U, Leckebusch GC, Spangehl T, Reyers M, Zacharias S (2007) Changes in
778
storm track and cyclone activity in three SRES ensemble experiments with the
ECHAM5/MPI-779
OM1 GCM. Clim Dynam 29:195–210. doi: 10.1007/s00382-007-0230-4
780
Ramos AM, Trigo RM, Santo FE (2011) Evolution of extreme temperatures over Portugal: recent
781
changes and future scenarios. Clim Res: in press. doi: 10.3354/cr00934
782
Randall DA, Wood RA, Bony S, Colman R, Fichefet T et al (2007) Climate models and their
783
evaluation. In: Solomon S, Qin D, Manning M, Chen Z et al (eds) Climate Change 2007: The
784
Physical Science Basis. Contribution of Working Group I to the Fourth Assessment Report of the
785
Intergovernmental Panel on Climate Change, Cambridge University Press, Cambridge, United
786
Kingdom and New York, NY, USA
787
Rockel B, Will A, Hense A (2008) The regional climate model COSMO-CLM. Meteorol Z (Berl)
788
17:347–348. doi: 10.1127/0941-2948/2008/0309
789
Roeckner E, Brokopf R, Esch M, Giorgetta M, Hagemann S, Kornblueh L (2006) Sensitivity of
790
simulated climate to horizontal and vertical resolution in the ECHAM5 atmosphere model. J
791
Climate 19:3771–3791. doi: 10.1175/JCLI3824.1
792
Roesch A, Jaeger EB, Lüthi D, Seneviratne SI (2008) Analysis of CCLM model biases in relation
793
to intra-ensemble model variability. Meteorol Z 17:369–382. doi: 10.1127/0941-2948/2008/0307
794
Rosário L (2004) Indicadores de desertificação para Portugal Continental. Direcção-Geral dos
795
Recursos Florestais (Ed.), Lisboa, May 2004, 56 pp
796
Santos JA, Corte-Real J, Leite SM (2005) Weather regimes and their connection to the winter
797
rainfall in Portugal. Int J Climatol 25:33–50. doi: 10.1002/joc.1101
798
Santos JA, Corte-Real J.; Ulbrich U, Palutikof J (2007a) European winter precipitation extremes
799
and surface large-scale circulation: a coupled model and its scenarios. Theor Appl Climatol 87:85–
800
102. doi: 10.1007/s00704-005-0224-2
801
Santos JA, Corte-Real J, Leite SM (2007b) Atmospheric large-scale dynamics during the
802
2004/2005 winter drought in Portugal. Int J Climatol 27:571–586. doi: 10.1002/joc.1425
803
Santos JA, Andrade C, Corte-Real J, Leite SM (2009a) The role of large-scale eddies in the
804
occurrence of precipitation deficits in Portugal. Int J Climatol 29:1493–1507. doi:
805
10.1002/joc.1818
806
Santos JA, Pinto JG, Ulbrich U (2009b) On the development of strong ridge episodes over the
807
eastern North Atlantic. Geophys Res Lett 36:L17804. doi: 10.1029/2009GL039086
808
Scaife AA, Folland CK, Alexander LV, Moberg A, Knight JR (2008) European climate extremes
809
and the North Atlantic Oscillation. J Climate 21:72–83. doi: 10.1175/2007JCLI1631.1
810
Shapiro SS, Wilk MB (1965) An analysis of variance test for normality (complete samples).
811
Biometrika 52:591–611. doi: 10.1093/biomet/52.3-4.591