NHESSD
2, 4031–4068, 2014Novel approaches for revealing hydro-meteorological
signals multi-scale characteristics
S. P. Yu et al.
Title Page
Abstract Introduction
Conclusions References
Tables Figures
◭ ◮
◭ ◮
Back Close
Full Screen / Esc
Printer-friendly Version
Interactive Discussion
Discussion
P
a
per
|
Discus
sion
P
a
per
|
Discussion
P
a
per
|
Discussion
P
a
per
|
Nat. Hazards Earth Syst. Sci. Discuss., 2, 4031–4068, 2014 www.nat-hazards-earth-syst-sci-discuss.net/2/4031/2014/ doi:10.5194/nhessd-2-4031-2014
© Author(s) 2014. CC Attribution 3.0 License.
This discussion paper is/has been under review for the journal Natural Hazards and Earth System Sciences (NHESS). Please refer to the corresponding final paper in NHESS if available.
Improvement for the multi-scale periodic
characteristics revealing of precipitation
signals and its impact assessment on soil
hydrological process by combining HHT
and CWT approaches
S. P. Yu1,2, J. S. Yang1,2, G. M. Liu1, R. J. Yao1,2, and X. P. Wang1
1
State Key Laboratory of Soil and Sustainable Agriculture, Institute of Soil Science, Chinese Academy of Sciences, 71 East Beijing Road, Nanjing 210008, China
2
Dongtai Institute of Tidal Flat, Nanjing Branch of the Chinese Academy of Sciences, 8 Beihai Road, Dongtai 224200, China
Received: 2 March 2014 – Accepted: 30 April 2014 – Published: 6 June 2014
Correspondence to: J. S. Yang (jsyang@issas.ac.cn) and S. P. Yu (spyu@issas.ac.cn)
NHESSD
2, 4031–4068, 2014Novel approaches for revealing hydro-meteorological
signals multi-scale characteristics
S. P. Yu et al.
Title Page
Abstract Introduction
Conclusions References
Tables Figures
◭ ◮
◭ ◮
Back Close
Full Screen / Esc
Printer-friendly Version
Interactive Discussion
Discussion
P
a
per
|
Discus
sion
P
a
per
|
Discussion
P
a
per
|
Discussion
P
a
per
|
Abstract
This study conducts a detailed analysis of the multi-scale periodic features involved in the annual and seasonal precipitation signals at the Chinese coastal reclamation region by selecting the suitable Continuous Wavelet Transform (CWT) and innova-tively combining the improved Hilbert Huang Transform (HHT), and further deduces
5
the precipitation trend and its impact on the future soil hydrological process. The Morlet wavelet transform is proved suitable in revealing the precipitation signals broad-scale periodicities, however, the critical mode mixing problem in the CWT causes the poor significances of the fine-scale periodicities, which can not well match the climate back-ground. By combining the HHT approach, the fine-scale mode mixing drawback in the
10
CWT is effectively eliminated, and the multi-scale periodicities of the studied precipita-tion signals are accurately revealed, based on which an overall decreasing trend of the annual and seasonal precipitation in the future years is demonstrated. Furthermore, by novelly using the Cross Wavelet Transform (XWT) and Wavelet Transform Coherence (WTC) approaches the prominent correlations between the precipitation dynamics and
15
soil and groundwater salinities dynamics, that the precipitation increase can effectively leach the surface soil salt downwards into the deeper soil layers and groundwater with 5–7 days lag, in the new cultivated tidal land are demonstrated. The revealed future de-creasing trend of precipitation especially in spring and summer may aggravate the soil salinization at the coastal reclamation region, thus we suggest reasonable salt leaching
20
and evaporation suppression measures to prevent the possible soil secondary saliniza-tion process.
1 Introduction
The precipitation dynamics always plays a prominent role in the soil hydrological pro-cess, which has significant impacts on the health of the water-soil-crop system. In
25
NHESSD
2, 4031–4068, 2014Novel approaches for revealing hydro-meteorological
signals multi-scale characteristics
S. P. Yu et al.
Title Page
Abstract Introduction
Conclusions References
Tables Figures
◭ ◮
◭ ◮
Back Close
Full Screen / Esc
Printer-friendly Version
Interactive Discussion
Discussion
P
a
per
|
Discus
sion
P
a
per
|
Discussion
P
a
per
|
Discussion
P
a
per
|
tidal lands are being enclosed for agricultural utilization, which has aroused the inter-national attention, e.g., the average annual reclamation amount of about 7000 ha tidal lands during the year 2010–2020 at Dongtai County takes up about 40 % of the total amounts in China (Wang and Ke, 1997; Meng and Tang, 2010). These new lands com-monly need 5–10 years of soil amelioration and desalting process before they can be
5
cultivated for wheat and corn in a rain-fed farming system. Thus, the precipitation dy-namics at the coastal region plays a key role in both the new-land soil desalting process and the cultivated-land soil secondary salinization process (Zhao et al., 2010), which makes the precise study of the precipitation dynamics very important for the agriculture development and environment health in these new lands. However, the uneven
precip-10
itation distribution during seasons and years and the special and stochastic climatic and environmental factors, such as typhoon and storm tide, at the coastal region make the study hard to be precise enough and usually bring some environmental risks, such as waterlog and salinization. In view of this, more effective approaches need to be in-troduced into the precise analysis of the precipitation multi-scale characteristics and
15
the accurate forecast of the precipitation trend and its impact on the soil hydrological process.
Since the hydro-meteorological signals are highly nonstationary and their physical processes often operate under a large range of scales varying from one day to several decades, the Continuous Wavelet Transform (CWT) has been introduced and
devel-20
oped to reveal the multiple time scales characteristics of these nonstationary signals (Mandelbrot and Wallis, 1968; Grossmann and Morlet, 1984; Mallat, 1989; Daubechies, 1994; Torrence and Compo, 1998; Labat et al., 2000). Because the CWT can provide information about both time and frequency simultaneously, and enables a separation to be made between features associated with different characteristic length scales, it
25
NHESSD
2, 4031–4068, 2014Novel approaches for revealing hydro-meteorological
signals multi-scale characteristics
S. P. Yu et al.
Title Page
Abstract Introduction
Conclusions References
Tables Figures
◭ ◮
◭ ◮
Back Close
Full Screen / Esc
Printer-friendly Version
Interactive Discussion
Discussion
P
a
per
|
Discus
sion
P
a
per
|
Discussion
P
a
per
|
Discussion
P
a
per
|
the Morlet and Mexican Hat wavelets are two types of the most popularly used con-tinuous wavelets (Foufoula and Kumar, 1995). To well and truly assess the statistical significance of the hydro-meteorological signals multi-scale periodicities, the wavelet power spectrum and its confidence test are usually requested to be combined with the wavelet transform analysis (Ge, 2007; Zhang et al., 2010). In view of the above
back-5
ground, it is feasible to utilize the CWT approach to effectively reveal the multi-scale characteristics of the precipitation at the studied coastal reclamation region, although little research has been carried out in this area.
One major problem in the CWT is the frequent appearance of mode mixing (Gong et al., 2005; Huang and Wu, 2008), which is defined as the CWT decomposed
in-10
formation of one scale (or frequency) either consisting of information of other widely disparate scales (or frequencies) or the decomposed information of a similar scale residing in different scales information. Mode mixing is often a consequence of sig-nal intermittency, which could cause serious aliasing in the time-frequency distribution and make the signal’s multi-scale periodicities unclear. To overcome the mode mixing
15
problem in the CWT, we innovatively introduced the improved Hilbert Huang Transform (HHT) approach, based on the Ensemble Empirical Mode Decomposition (EEMD) (Wu and Huang, 2009), to improve the revealing capability of hydro-meteorological signals multi-scale periodic characteristics in the presented study. As a new noise-assisted data analysis method, the EEMD is proposed based on the original HHT, which is
20
based on the original Empirical Mode Decomposition (EMD) method (Huang et al., 1998, 1999), to overcome the similar mode mixing drawback in the EMD as that in the CWT. The improved EEMD method defines the true Intrinsic Mode Function (IMF) com-ponents as the mean of an ensemble of trials, each consisting of the signal plus a white noise of finite amplitude. Although adding noise may result in smaller signal-to-noise
25
NHESSD
2, 4031–4068, 2014Novel approaches for revealing hydro-meteorological
signals multi-scale characteristics
S. P. Yu et al.
Title Page
Abstract Introduction
Conclusions References
Tables Figures
◭ ◮
◭ ◮
Back Close
Full Screen / Esc
Printer-friendly Version
Interactive Discussion
Discussion
P
a
per
|
Discus
sion
P
a
per
|
Discussion
P
a
per
|
Discussion
P
a
per
|
in a broad range of applications for extracting signals from data generated in noisy nonlinear and nonstationary processes.
One crucial issue in assessing the impact of precipitation dynamics on the future soil hydrological process is to precisely reveal the correlation between the precipita-tion dynamics and the soil and groundwater salinities dynamics. However, because of
5
the large numbers of zero value data in the daily hydro-meteorological signals, which highly increase the signals noisy and nonlinear dynamics (Yu et al., 2013), the clas-sic regression analysis can not well reveal the correlation. Thus, the Cross Wavelet Transform (XWT) and Wavelet Transform Coherence (WTC) approaches were novelly introduced into the study to discuss the resonance feature between the precipitation
10
and salinity signals at multiple time scales. By combining the continuous wavelet anal-ysis and cross spectrum analanal-ysis (Roth, 1971; Liu, 1994), the XWT and WTC have been developed and utilized to expose the common power, relative phase and signifi-cant coherence of two signals in time-frequency space (Torrence and Webster, 1999; Grinsted et al., 2004). Because of the embedded wavelet theory, the XWT and WTC
15
have advantages over the single cross spectrum analysis in revealing the cross in-formation of nonstationary signals about both time and frequency simultaneously and have been popularly used for meteorological, geophysical, mechanical and electronical signals (Gurley et al., 2003; Jevrejeva et al., 2003; Yang et al., 2009; Yu et al., 2014).
In the remainder of this paper, the studied sites and data details and the
method-20
ologies of CWT, XWT, WTC and HHT are presented. In the next section, the results of multi-scale periodic characteristics of different precipitation signals are revealed by selecting the suitable CWT, and the future precipitation trends at corresponding domi-nant scales are deduced and forecasted with the comparison with the traditional linear fitting results. In the discussion section, the mode mixing problems in the CWT are
25
precipita-NHESSD
2, 4031–4068, 2014Novel approaches for revealing hydro-meteorological
signals multi-scale characteristics
S. P. Yu et al.
Title Page
Abstract Introduction
Conclusions References
Tables Figures
◭ ◮
◭ ◮
Back Close
Full Screen / Esc
Printer-friendly Version
Interactive Discussion
Discussion
P
a
per
|
Discus
sion
P
a
per
|
Discussion
P
a
per
|
Discussion
P
a
per
|
tion and salinization dynamics, where the XWT and WTC approaches are novelly used to reveal the oscillation coherence and time lag property between the precipitation and groundwater salinity signals at daily scales. Finally, the conclusions are drawn.
2 Data and methodology
2.1 Studied sites and data
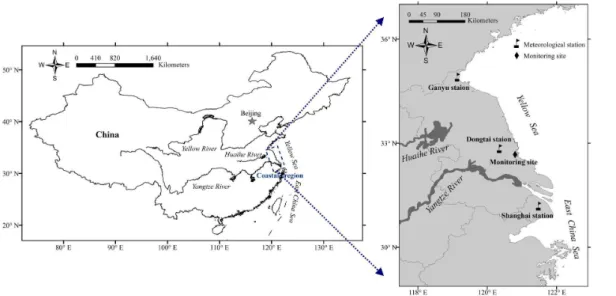
5
Three meteorological stations in the coastal region in North Jiangsu, China were se-lected as the study sites in this paper (Fig. 1). The Ganyu station (N 34.84◦, E 119.12◦) locates at the north part of Huaihe River valley and is about 5 km from the Yellow Sea. The Shanghai station (N 31.16◦, E 121.43◦) locates at the south part of lower reach of Yangtze River and is about 27 km from the East China Sea. The Dongtai station (N
10
32.85◦, E 120.31◦) locates at the crossing part of the two valleys and is about 54 km from the Yellow Sea. Supported and quality controlled by China Meteorological Admin-istration, the data of monthly precipitation covering 1957–2011 at the Ganyu station, the monthly precipitation covering 1953–2011 at the Dongtai station, and the monthly precipitation covering 1951–2011 at the Shanghai station were utilized in this study.
15
The monitoring site (N 32.65◦, E 120.90◦) locates at a new cultivated farmland at the typical reclamation area Dongtai County, which is about 5 km from the Yellow Sea. This tidal land was enclosed from the sea in 2004 and first cultivated for wheat and corn in June, 2011. The soil electrical conductivity (EC) data of different layers (10 cm, 50 cm and 100 cm) were monitored 6 times each month from June 2011 to May. 2013. The
20
daily groundwater EC data and corresponding daily rainfall data covering one whole year (365 days) from 11 May 2012 to 10 May 2013 were monitored and collected.
2.2 CWT and wavelet power spectrum test
The CWT is a mathematical tool which allows the decomposition of the signal f(t) in terms of elementary contributions called wavelets, which can be thought of as a packet
NHESSD
2, 4031–4068, 2014Novel approaches for revealing hydro-meteorological
signals multi-scale characteristics
S. P. Yu et al.
Title Page
Abstract Introduction
Conclusions References
Tables Figures
◭ ◮
◭ ◮
Back Close
Full Screen / Esc
Printer-friendly Version
Interactive Discussion
Discussion
P
a
per
|
Discus
sion
P
a
per
|
Discussion
P
a
per
|
Discussion
P
a
per
|
of sine waves of varying amplitude and wavelength (Sadowskey, 1996; Torrence and Compo, 1998; Labat et al., 2000). For time seriesf(t)∈L2(R),R is the domain of real numbers, or finite energy signal, the CWT of signalf(t) with the analyzing waveletϕis the convolution off(t) with a set of dilated and translated wavelets:
Wf(a,b)=hf(t),φa,b(t)i=
r
δt a
Z
R
f(t)φ
t
−b a
dt (1)
5
where a is the dilation (scale or frequency) parameter, b is the translation (position or time) parameter, ϕ(t) is the complex conjugate functions of ϕ(t), and δt is the time interval of data series. In our case, two popularly used wavelets, the Mexican Hat and Morlet wavelets (Eq. 2), were selected as the ϕ(Mallat, 1989; Daubechies,
10
1994; Torrence and Compo, 1998). The Mexican Hat wavelet, as a real-value wavelet function, is the second derivative of the Gaussian function. The Morlet wavelet, as a complex wavelet, is consisting of a plane wave modulated by a Gaussian function.
(Mexican Hat)ϕ(t)=
2
√
3π
−1/4
(1−t2)e(−t2/2) (Morlet)ϕ(t)=π−1/4ei ω0te(−t2/2) (2)
15
whereω0is the non-dimensional frequency, usually taken to be 6 to satisfy the admis-sibility condition (Farge, 1992; Torrence and Compo, 1998).
The local wavelet power spectrum is defined as|Wf(a,b)|2, and the global wavelet
power spectrum is defined asEa=N1 N
P
b=1|
Wf(a,b)|
2
, whereN is the length of data. The
statistical significance of wavelet power can be assessed relative to the null hypotheses
20
that the signal is generated by a stationary process with a given background power spectrum (P) (Torrence and Compo, 1998). For global wavelet power spectrum test, the theoretical spectrumP is defined as P =σ2Pkx
2
v/v, where σ
2
NHESSD
2, 4031–4068, 2014Novel approaches for revealing hydro-meteorological
signals multi-scale characteristics
S. P. Yu et al.
Title Page
Abstract Introduction
Conclusions References
Tables Figures
◭ ◮
◭ ◮
Back Close
Full Screen / Esc
Printer-friendly Version
Interactive Discussion
Discussion
P
a
per
|
Discus
sion
P
a
per
|
Discussion
P
a
per
|
Discussion
P
a
per
|
level, andPk is the Fourier white noise or red noise power spectrum. For local wavelet power spectrum test, thev value is selected as 2.Pk is defined as Eq. (3):
Pk=
1−r(1)2
1+r(1)2−2·r(1)·cos(2πδ
t/T)
(3)
wherer(1) is the autocorrelation coefficient under a first order lag of data series, and
5
T is the period of data series. For Morlet wavelet,T ≈1.033a, while for Mexican Hat wavelet,T ≈3.974a. When r(1)>0.1,Pk is red noise spectrum, and whenr(1)≤0.1, Pkis white noise spectrum and equals the default value 1.0 (Allen and Smith, 1996; Ge,
2007). Thevvalues in Mexican Hat and Morlet wavelet power spectrums are calculated by:
10
(Mexican Hat)v=
s
1+
Nδt
1.43a
2
; (Morlet) v=2
s
1+
Nδt
2.32a
2
(4)
2.3 XWT and WTC
The XWT of two signals x(t) and y(t) with finite energy is defined as Wxy(a,b)=
Wx(a,b)Wy∗(a,b), where∗denotes complex conjugation. The cross wavelet power
spec-15
trum is defined as|Wxy(a,b)|2=|Wxy(a,b)Wxy∗ (a,b)|. The theoretical distribution of the cross wavelet power of two signals with background power spectrum Pkx and Pky is given by Torrence and Compo (1998) as:
D |Wxy(a,b)|
2
σxσy
< p
!
=Zvv(p)
q
PkxPky (5)
20
where Zv(p) is the confidence level associated with the probability p for a
NHESSD
2, 4031–4068, 2014Novel approaches for revealing hydro-meteorological
signals multi-scale characteristics
S. P. Yu et al.
Title Page
Abstract Introduction
Conclusions References
Tables Figures
◭ ◮
◭ ◮
Back Close
Full Screen / Esc
Printer-friendly Version
Interactive Discussion
Discussion
P
a
per
|
Discus
sion
P
a
per
|
Discussion
P
a
per
|
Discussion
P
a
per
|
distributions. In this study 0.05 significance level was selected and Z2(95 %)=3.999
(Grinsted et al., 2004).
Because the wavelet is not completely localized in time, the XWT has edge artifacts and a Cone of Influence (COI) in which edge effects can not be ignored is introduced. Here we take the COI as the area in which the wavelet power caused by a discontinuity
5
at the edge has dropped to e−2 of the value at the edge (Grinsted et al., 2004). The phase difference between the components of two signals, revealed from the complex angles ofWxy(a,b), can be estimated by calculating the mean and confidence interval
of the phase difference. The circular mean of the phase over regions with higher than 5 % statistical significance that are outside the COI are used to quantify the phase
10
relationship. The circular mean of a set of angles (αi, i =1. . .n) is defined as (Zar,
1999):
¯
αi =arg (X,Y) ;X =
n
X
i=1
cos(αi);Y =
n
X
i=1
sin(αi) (6)
The circular standard deviation, reflecting the scatter of angles around the mean, is
15
defined ass=
q
−2 ln(R/n), where R=√X2+Y2. The circular standard deviation is
analogous to the linear standard deviation in that it varies from zero to infinity. In some cases there might be reasons for calculating the mean phase angle for each scale, and then the phase angle can be quantified as a number of days.
Analysis of the wavelet transform coherence (WTC) of two signals x(t) andy(t) is
20
another useful measure to reveal the high common wavelet power and the localized correlation coefficient of the two signals in time frequency space. The wavelet coher-ence is defined by Torrcoher-ence and Webster (1999) as:
R2(a,b)
=
S
a−1Wxy(a,b)
2
Sa−1|W
x(a,b)|2
·Sa−1
Wy(a,b)
2 (7)
NHESSD
2, 4031–4068, 2014Novel approaches for revealing hydro-meteorological
signals multi-scale characteristics
S. P. Yu et al.
Title Page
Abstract Introduction
Conclusions References
Tables Figures
◭ ◮
◭ ◮
Back Close
Full Screen / Esc
Printer-friendly Version
Interactive Discussion
Discussion
P
a
per
|
Discus
sion
P
a
per
|
Discussion
P
a
per
|
Discussion
P
a
per
|
whereS is a smoothing operator. For the Morlet wavelet a suitable smoothing operator is given by Torrence and Webster (1999):
Stime(Wf(a,b))|a=
Wf(a,b)·c−1t2/(2a2)
a
(8)
Sscale(Wf(a,b))|t=
Wf(a,b)·c2
Y
(0.6a)
t (9)
5
whereSscaledenotes smoothing along the wavelet scale axis,Stimedenotes smoothing
in time,c1andc2are normalization constants and
Q
is the rectangle function. And the statistical significance level of WTC is estimated using Monte Carlo methods (Grinsted et al., 2004).
2.4 EEMD and HHT marginal spectrum
10
In the original HHT, based on the EMD approach, the data seriesx(t) is decomposed in terms of truth (IMFs) and trend (R) components (Huang et al., 1998, 1999):
x(t)=
n
X
j=1
cj+Rn (10)
wherecj is the IMF component, and Rn is the residue of datax(t) afternnumber of
15
IMFS are extracted.
As proposed by Wu and Huang (2009), The first step of EEMD process is to add a white noise seriesw(t) to the targeted data. The added white noise is treated as the possible random noise that would be encountered in the measurement process. Under such conditions, theith “artificial” observation will be:
20
xi(t)=x(t)+wi(t) (11)
NHESSD
2, 4031–4068, 2014Novel approaches for revealing hydro-meteorological
signals multi-scale characteristics
S. P. Yu et al.
Title Page
Abstract Introduction
Conclusions References
Tables Figures
◭ ◮
◭ ◮
Back Close
Full Screen / Esc
Printer-friendly Version
Interactive Discussion
Discussion
P
a
per
|
Discus
sion
P
a
per
|
Discussion
P
a
per
|
Discussion
P
a
per
|
observation as given in Eq. (11). The second step is to decompose the data with added white noise into IMFs. Repeat step 1 and step 2 again and again, but with different white noise series each time, and at last obtain the ensemble means of corresponding IMFs of the decompositions as the final result. As the ensemble number approaches infinity, the truth,cj(t), as defined by EEMD, is:
5
cj(t)= lim
N→∞
1 N
N
X
k=1
[cjk(t)], cjk(t)=cj(t)+Rjk(t) (12)
whereRjk(t) is the contribution to the jth IMF from the added white noise of thekth
trial of thejth IMF in the noise-added signal. The amplitude of noisewi(t) is not neces-sarily small, usually setting an amplitude of 0.2 of that of the standard deviation of the
10
corresponding data. But the ensemble number of the trialsN has to be large, usually not lower than 100.
The HHT marginal spectrum represents the accumulated amplitude (energy) over the entire data span in a probabilistic sense and offers a measure of the total ampli-tude (energy) contribution from each frequency (period) value, serving as an
alterna-15
tive spectrum expression of the traditional Fourier spectrum. The marginal spectrum is defined as (Huang and Wu, 2008):
h(ω)=
T
Z
0
H(ω,t)dt (13)
where [0,T] is the temporal domain within which the data is defined, H expresses
20
NHESSD
2, 4031–4068, 2014Novel approaches for revealing hydro-meteorological
signals multi-scale characteristics
S. P. Yu et al.
Title Page
Abstract Introduction
Conclusions References
Tables Figures
◭ ◮
◭ ◮
Back Close
Full Screen / Esc
Printer-friendly Version
Interactive Discussion
Discussion
P
a
per
|
Discus
sion
P
a
per
|
Discussion
P
a
per
|
Discussion
P
a
per
|
3 Results
3.1 Precipitation trend forecast based on the conventional linear fitting method
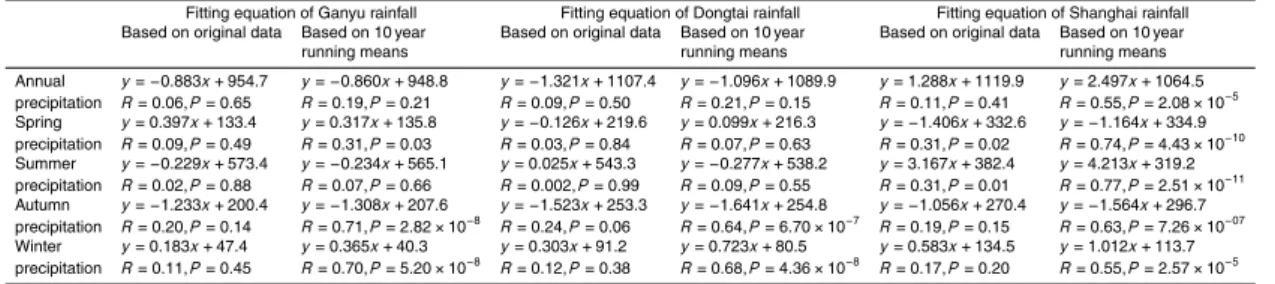
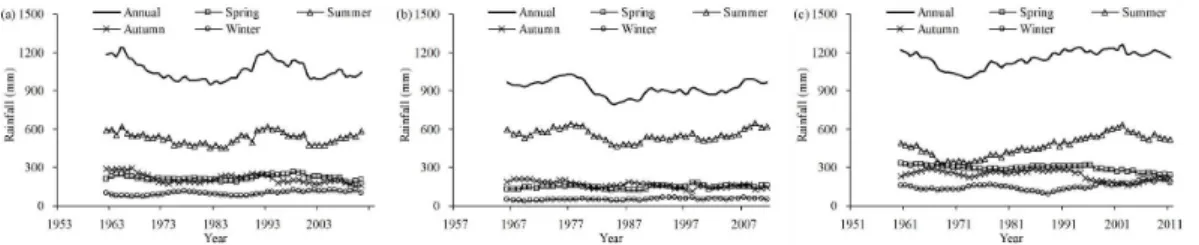
The average coefficients of variation (CVs) of the monthly precipitation during each year reached 122.1 %, 95.4 % and 75.6 % at the coastal Ganyu, Dongtai and Shang-hai meteorological stations, respectively, and the average CVs of the annual
precipi-5
tation among years reached 24.5 %, 24.0 % and 18.4 %, respectively, which showed the prominent uneven precipitation distribution during seasons and years in the stud-ied area and a slightly decreasing trend of this kind of unevenness with the latitude dropping. The summer precipitation made up 61.0 %, 51.0 % and 41.4 % of the annual precipitation at Ganyu, Dongtai and Shanghai, respectively, with the significant
correla-10
tion coefficients of 0.88, 0.84 and 0.77, respectively, between the summer and annual precipitation at the 0.05 confidence levels. Further more, the 10 year running means of the summer precipitation signals showed the most similar dynamic curves with the annual precipitation signals (Fig. 2). The above analysis indicated that the summer pre-cipitation dynamics played a dominant role in the annual prepre-cipitation changes in the
15
studied area.
As one conventional method for assessing the precipitation dynamics, the original precipitation data series are usually treated by linear fitting, in which the ten times of the slope of the fitting line, i.e. the climate tendency rate (CTR), denotes the precipita-tion changes of every ten years (Xu et al., 2004; Wang et al., 2006). A negative CTR
20
denotes a decreasing precipitation trend, while a positive CTR denotes an increas-ing trend. The fittincreas-ing equations of the original annual and seasonal precipitation data series, together with the fitting equations of the 10 year running means data, at the three studied stations were computed and showed in Table 1. Results showed that the CTRs of the annual precipitation at Ganyu, Dongtai and Shanghai were−8.83,−13.21
25
NHESSD
2, 4031–4068, 2014Novel approaches for revealing hydro-meteorological
signals multi-scale characteristics
S. P. Yu et al.
Title Page
Abstract Introduction
Conclusions References
Tables Figures
◭ ◮
◭ ◮
Back Close
Full Screen / Esc
Printer-friendly Version
Interactive Discussion
Discussion
P
a
per
|
Discus
sion
P
a
per
|
Discussion
P
a
per
|
Discussion
P
a
per
|
can be calculated in the same way. However, it should be noted that most of the fitting equations based on the original precipitation data did not pass the statistical test at the 0.05 confidence level. Although the statistic significance of the fitting equations based on the 10 year running means data increased slightly, the overall performance of pre-cipitation trend forecast based on the conventional CTR analysis was too poor to be
5
used for the accurate precipitation dynamics assessment. In view of this, the popular wavelet analysis method CWT was used to forecast the precipitation trend by revealing the periodic characteristics of the precipitation signals at multiple temporal-frequency scales.
3.2 Multi-scale periodic characteristics of annual and seasonal precipitation
10
signals based on the CWT
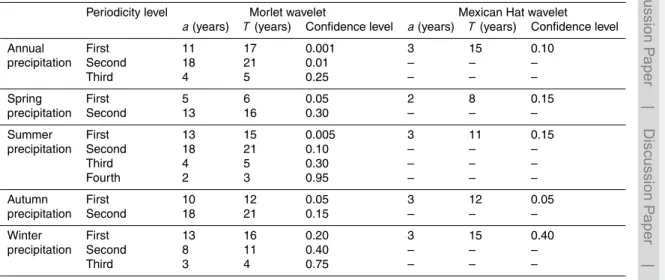
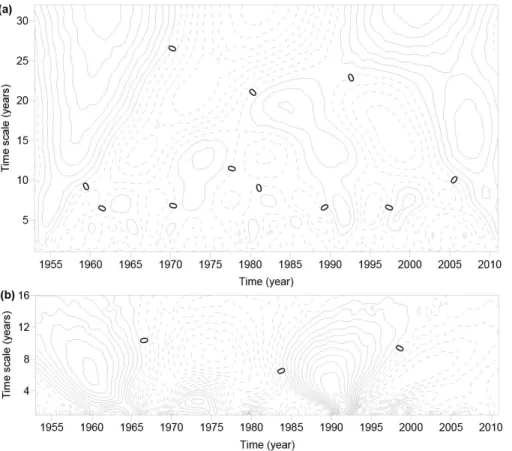
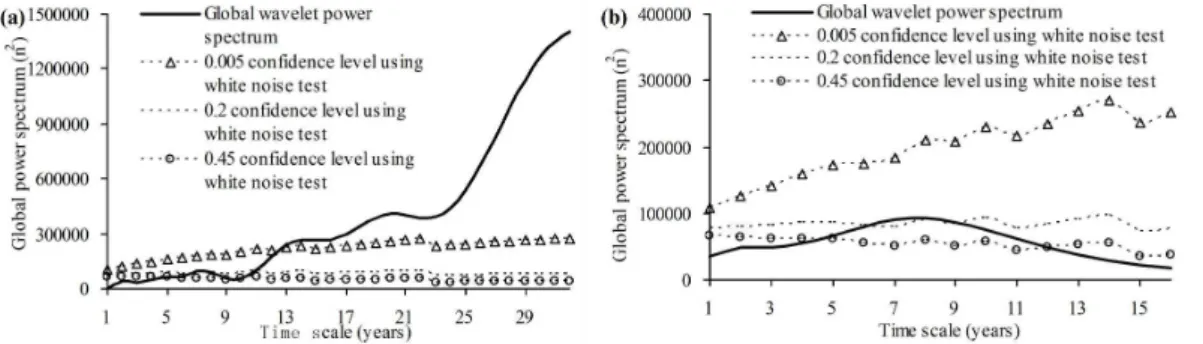
The Morlet and Mexican Hat wavelet transform coefficients of the annual and seasonal precipitation signals at different meteorological stations were calculated by MATLAB. Taking the annual precipitation at Dongtai as an example (Fig. 3), the Morlet and Mex-ican Hat wavelet transform coefficients clearly indicated the distribution conditions of
15
the annual precipitation signal at multiple time scales. The solid isograms indicated the positive wavelet coefficients and an increasing trend of the annual precipitation, and the dashed isograms indicated the negative wavelet coefficients and a decreasing trend. In oreder to more directly reveal the multi-scale periodic characteristics of the precipitation signal, the global wavelet power spectra based on the Morlet and
Mex-20
ican Hat wavelet transform coefficients were calculated and showed in Fig. 4. Since ther(1) of the Dongtai annual precipitation data series was −0.23, the corresponding theoretical power spectra for testing the Morlet and Mexican Hat wavelet power density significances at different time scales were calculated by using the white noise model.
Results showed that the Morlet wavelet transform coefficients of the Dongtai annual
25
NHESSD
2, 4031–4068, 2014Novel approaches for revealing hydro-meteorological
signals multi-scale characteristics
S. P. Yu et al.
Title Page
Abstract Introduction
Conclusions References
Tables Figures
◭ ◮
◭ ◮
Back Close
Full Screen / Esc
Printer-friendly Version
Interactive Discussion
Discussion
P
a
per
|
Discus
sion
P
a
per
|
Discussion
P
a
per
|
Discussion
P
a
per
|
cycle years between each two time domains with positive wavelet coefficients) at the five time scales were 24, 16, 9, 5 and 2 years, respectively, which were obtained by calculating and averaging the year numbers of each two neighbouring high and low precipitation periods. Among the five QPOs, the 24 and 16 year periods passed the 0.005 confidence test, and the 9 year period passed the 0.2 confidence test, but the
5
5 and 2 year periods showed very poor significances. With respect to the Mexican Hat wavelet transform, only one QPO at 8 year time scale was revealed and its corre-sponding periodT was 31 years, which passed the 0.2 confidence test. The multi-scale periodic characteristics for the Dongtai seasonal precipitation signals and for the an-nual and seasonal precipitation signals at the Ganyu and Shanghai stations based on
10
the Morlet and Mexican Hat wavelet transforms were obtained in the same way, and were showed in Tables 2–4. It should be noted that the global wavelet power spectra of the Shanghai autumn and winter precipitation series were tested using the red noise model because theirr(1) were 0.13 and 0.16, respectively.
Comparing the two types of CWTs performances, the Morlet wavelet transform
15
showed more significant advantage than the Mexican Hat in capturing the oscillatory behaviors and revealing the local features of the studied precipitation signals period-icities, especially prominent in increasing the confidence level of the wavelet power spectrum test. In view of this, the dominant precipitation periods with the highest confi-dence level revealed from the Morlet wavelet transform were selected to further deduce
20
and forecast the annual and seasonal precipitation trends in the studied area.
3.3 Precipitation trend forecast based on the CWT
According to the dominant periods of the annual and seasonal precipitation signals revealed by the Morlet wavelet transforms, the precipitation trends in the next future years can be forecasted by deducing the future fluctuating of the wavelet transform
25
precip-NHESSD
2, 4031–4068, 2014Novel approaches for revealing hydro-meteorological
signals multi-scale characteristics
S. P. Yu et al.
Title Page
Abstract Introduction
Conclusions References
Tables Figures
◭ ◮
◭ ◮
Back Close
Full Screen / Esc
Printer-friendly Version
Interactive Discussion
Discussion
P
a
per
|
Discus
sion
P
a
per
|
Discussion
P
a
per
|
Discussion
P
a
per
|
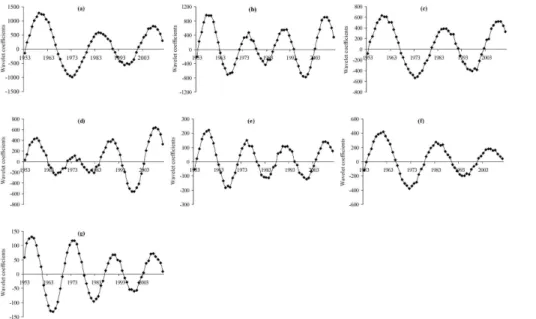
itation signals, and the dominant periods of 16, 23 and 17 years were revealed in the Dongtai spring, autumn and winter precipitation signals. The corresponding wavelet coefficient curves of the annual and seasonal precipitation at different dominant time scales were showed in Fig. 5. Each single cycle in the wavelet coefficient curve was constituted by a high-precipitation half-period, in which the wavelet coefficients were
5
positive, and a low-precipitation half-period, in which the coefficients were negative. Results in Fig. 5 showed that all the wavelet coefficients of the annual and seasonal precipitation in 2011 located at the end of each high-rainfall half-period, which indicated that the annual and summer precipitation in the next 8–12 years, the spring precipita-tion in the next 8 years, the autumn precipitaprecipita-tion in the next 12 years, and the winter
10
precipitation in the next 8 years would probably be in the relatively low periods.
Similarly, the future precipitation trends at the Ganyu and Shanghai stations were deduced and forecasted. Results showed that the annual and summer precipitation in the next 8–10 years, the autumn rainfall in the next 6 years and the winter precipitation in the next 7 years at the Ganyu station would probably be in the relatively low periods,
15
because all their wavelet coefficients at the corresponding dominant periods in 2011 lo-cated at the end of each high-precipitation half-period. With respect to the Ganyu spring precipitation, it would still be in a relatively low period in the next 2 years and then revert to a relatively high period in the next 3 years, because the wavelet coefficient in 2011 located at the first year of one low-precipitation half-period. At the Shanghai station, all
20
the annual and summer precipitation in the next 5–12 years, the spring precipitation in the next 12 years and the winter precipitation in the next 8 years would probably be in the relatively low periods. With respect to the Shanghai autumn precipitation, it would still be in a relatively high period in the next 2 years and then revert to a relatively low period in the next 12 years. The above forecast showed an overall decreasing trend of
25
NHESSD
2, 4031–4068, 2014Novel approaches for revealing hydro-meteorological
signals multi-scale characteristics
S. P. Yu et al.
Title Page
Abstract Introduction
Conclusions References
Tables Figures
◭ ◮
◭ ◮
Back Close
Full Screen / Esc
Printer-friendly Version
Interactive Discussion
Discussion
P
a
per
|
Discus
sion
P
a
per
|
Discussion
P
a
per
|
Discussion
P
a
per
|
4 Discussions
4.1 Improvement of the multi-scale periodic characteristics revealing capabili-ties by combining the CWT and HHT methods
The previous studies have reported the significant decadal QPO of the summer precip-itation at about 30 years and inter-annual QPOs of the summer precipprecip-itation at about
5
2 and 8 years in both the Huaihe River Walley and the Yangze River Lower Reach in China (Zhu and Wang, 2001; Wei and Zhang, 2009; Zhu, et al., 2011). The climate background is the corresponding decadal and iner-annual QPOs characteristics of the East Asian summer monsoon circulation (Chang et al., 2000). In our study, the Ganyu station locates at the north part of Huaihe River Valley, the Shanghai station locates
10
at the south part of the Yangze River Lower Reach, and the Dongtai station locates at the crossing part of the two valleys. All the three studied stations locate at the coastal region. Based on the popular CWT method, the summer precipitation signals in the studied stations showed significant broad-scale periodicities at approximate 9 years and 25 years, which matched the approximate 8 and 30 year scales QPO
characteris-15
tics of the two valleys precipitation in the previous studies. However, the three stations summer precipitation periodicities at the fine scales, revealed by the CWT, showed very poor significances, which did not match the significant inter-annual QPO characteris-tics of the two valleys precipitation at about 2 year scale. The main reason causing the poor performance of the CWT method on revealing the fine-scale periodicity of the
20
coastal precipitation signal was the mode mixing problem in the CWT process, e.g., in Fig. 3 the precipitation QPO at a fine time scale was often nested in a broad time scale QPO. In addition, the coastal precipitation dynamics is often influenced by some unique climatic and environmental factors, such as the typhoon and the storm tide. These factors may lead some stochastic impacts on the periodic characteristics of the
25
NHESSD
2, 4031–4068, 2014Novel approaches for revealing hydro-meteorological
signals multi-scale characteristics
S. P. Yu et al.
Title Page
Abstract Introduction
Conclusions References
Tables Figures
◭ ◮
◭ ◮
Back Close
Full Screen / Esc
Printer-friendly Version
Interactive Discussion
Discussion
P
a
per
|
Discus
sion
P
a
per
|
Discussion
P
a
per
|
Discussion
P
a
per
|
Since the improved HHT method, which is based on the EEMD algorithm, has been popularly used in recent years in decomposing data into multi-scale IMF components with prominent advances on eliminating the mode mixing drawback in the traditional EMD, here we try to use the EEMD to reveal the multi-scale periodic characteristics of the studied precipitation signals and to eliminate the mode mixing in the CWT results.
5
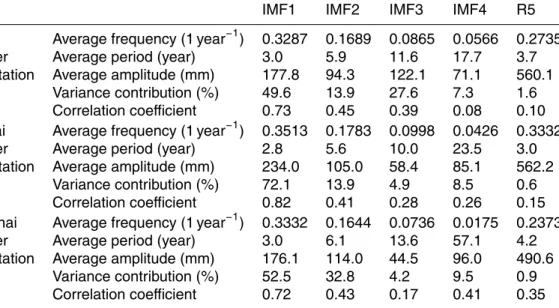
For each summer precipitation signal, the statistical results of the five decomposition components obtained from the EEMD were displayed in Table 5. The corresponding HHT marginal spectra from the EEMD were showed in Fig. 6a3, b3 and c3). In the EEMD, an ensemble size of 100 was used, and the added white noise in each en-semble member had a standard deviation of 0.2. Among the five decomposition
com-10
ponents of each summer precipitation signal, the IMF1-IMF4 were the intrinsic mode function components at multiple frequencies and the R5 was the trend component. For the three summer precipitation signals, the fist decomposed IMF1s, which denoted an average period scale at approximately 2 years, had the highest variance contribution ra-tios and the most significant correlation coefficients with the original data. Further more,
15
in each summer precipitation signal’s HHT marginal spectrum the most significant am-plitude (or energy) accumulation occurred at the periods of approximately 2 years. The EEMD-based HHT marginal spectra of the annual and the other seasonal precipitation signals (Fig. 6) showed the similar and significant fine-scale periodicities as the sum-mer precipitation signal. Comparing the CWT method, the EEMD-based HHT method
20
well improved the capabilities in eliminating the fine-scale mode mixing problem and in revealing the precipitation signals fine-scale periodic characteristics. As for the broad-scale periodicities analysis, the HHT method showed the similar results with the CWT method that the studied annual and seasonal precipitation signals had the periods at approximate 9 years and 25 years. However, the significances of the broad-scale
peri-25
draw-NHESSD
2, 4031–4068, 2014Novel approaches for revealing hydro-meteorological
signals multi-scale characteristics
S. P. Yu et al.
Title Page
Abstract Introduction
Conclusions References
Tables Figures
◭ ◮
◭ ◮
Back Close
Full Screen / Esc
Printer-friendly Version
Interactive Discussion
Discussion
P
a
per
|
Discus
sion
P
a
per
|
Discussion
P
a
per
|
Discussion
P
a
per
|
backs in the CWT and to improve the signal’s multi-scale periodic characteristics. In view of this, the precipitation trend forecast based on the CWT should not ignore the precipitation signals fine-scale periodicities. In our case study, the three stations an-nual and seasonal precipitation trends at fine scales can be forecasted by deducing the future fluctuating of the wavelet transform coefficient curves at the corresponding
5
periods of 2–3 years. Results showed an overall decreasing trend of the precipitation in the next future 1–2 years in the studied stations, because all the fine-scale wavelet coefficients in 2011 located at the end of each high-precipitation half-period.
4.2 Applying the research results of the precipitation multi-scale
time-frequency characteristics to the soil hydrological process study
10
Before the evaluation of the coastal-region multi-scale precipitation trends on the soil hydrological process, we firstly quantitatively analyzed the relationship between the precipitation dynamics and the soil and groundwater salinization dynamics, taking the relatively short monitoring data in a new cultivated farmland at the typical reclamation area Dongtai as an example.
15
Comparing the dynamics of monthly average soil electric conductivity (EC), stand-ing for the soil salinity, of different layers and the monthly precipitation (Fig. 7a), we found that the surface soil EC (10 cm layer) decreased significantly with the precipita-tion increase and increased with the precipitaprecipita-tion decrease. On the contrary, the 50 and 100 cm layers soil EC dynamics were in keeping with the precipitation dynamics.
20
That’s to say the soil salt was leached from the surface part to lower part when the precipitation increased. Further analysis showed that in average every 10 mm monthly precipitation increase in the monitoring site caused correspondingly 0.1–0.2 dS m−1 decrease of the surface soil EC (Fig. 7b).
Because of the shallow groundwater table, usually changing from 80 to 150 cm layer
25
sig-NHESSD
2, 4031–4068, 2014Novel approaches for revealing hydro-meteorological
signals multi-scale characteristics
S. P. Yu et al.
Title Page
Abstract Introduction
Conclusions References
Tables Figures
◭ ◮
◭ ◮
Back Close
Full Screen / Esc
Printer-friendly Version
Interactive Discussion
Discussion
P
a
per
|
Discus
sion
P
a
per
|
Discussion
P
a
per
|
Discussion
P
a
per
|
nificantly when the precipitation increased and leached the soil salt downwards, and decreased when the salt in the groundwater moved upwards into the soil under the low precipitation and high evaporation. The cross wavelet power spectrum from the XWT of daily precipitation and groundwater EC data series and the corresponding WTC of the two signals were shown in Fig. 8b and c, respectively. Ther(1)s of the daily
ground-5
water EC and rainfall series were 0.98 and 0.30 respectively, which asked for the red noise test in the XWT. Prominent resonant periods of the two signals around the 5, 15, 25 and 70 days bands stood out as being significant at the 0.05 significance level. The average squared wavelet coherence coefficients of the two signals around the 70 days band were the highest and equaled to 0.88, which proved the most significant
10
oscillation coherence of the two series at the periods around the 70 days band. In view of this, the XWT phase angles within the 0.05 significant regions around the 70 days band were calculated. The mean phase−34.1±5.3◦(where±designates the circular standard deviation) at the periods around the 70 days band was in-phase, which indi-cated about 5–7 days lag of the impact of precipitation dynamics on the groundwater
15
EC dynamics.
The above discussion indicates that the precipitation increase at the coastal recla-mation area can be very helpful for the surface soil salt leaching, while may increase the salt accumulation in the deeper soil profile and groundwater, which asks for reason-able drainage measures especially in rainy seasons to prevent the coastal groundwater
20
salinization. The revealed subsequent decreasing trend of precipitation especially in spring and summer in the studied coastal region may aggravate the new desalted and cultivated land salinization and probably lead a new secondary salinization process in the next future years because of its impact on the decrease of surface soil salt leach-ing. This suggests reasonable salt leaching and evaporation suppression measures to
25
ad-NHESSD
2, 4031–4068, 2014Novel approaches for revealing hydro-meteorological
signals multi-scale characteristics
S. P. Yu et al.
Title Page
Abstract Introduction
Conclusions References
Tables Figures
◭ ◮
◭ ◮
Back Close
Full Screen / Esc
Printer-friendly Version
Interactive Discussion
Discussion
P
a
per
|
Discus
sion
P
a
per
|
Discussion
P
a
per
|
Discussion
P
a
per
|
vanced mathematical models and algorithms, such as Discrete Wavelet Transform and Neuro Fuzzy (Yang et al., 2013), and more attention on the impact of stochastic factors to quantitatively forecast the future precipitation trend. In addition, because the soil and groundwater salinities monitoring site locates at the new cultivated farmland, the longer time series of soil and groundwater salinities monitoring data will need to be collected
5
in the future research for the improvement of quantitative correlation analysis between the precipitation and salinization dynamics.
5 Conclusions
In this paper, we conducted a detailed analysis of the multi-scale periodic characteris-tics involved in the annual and seasonal precipitation signals at different
meteorolog-10
ical stations along the coastal reclamation region by using and comparing two types of popular CWTs and their wavelet power spectrums. Furthermore we deduced and forecasted the future annual and seasonal precipitation trends in the studied coastal stations by selecting suitable wavelet to reveal the dominant precipitation periods. The critical fine-scale mode mixing problem in the CWT was discussed and innovatively
15
improved by combining the EEMD-based HHT method. In addition, by analyzing the quantitative relationship between the precipitation dynamics and soil and groundwater salinities dynamics, we made some novel attempts to evaluate the impact of the re-vealed precipitation trend on the future soil hydrological process in the new cultivated coastal farmland. Some interesting conclusions can be drawn as follows:
20
1. By combining the CWT and the corresponding wavelet power spectrum test, the multi-scale periodic characteristics, mainly the broaqd-scale periodicities, of the annual and seasonal precipitation signals in the studied coastal reclamation re-gion were revealed. Comparing the performances of two popular CWTs, the Mor-let waveMor-let transform was proved more suitable than the Mexican Hat in the
stud-25
NHESSD
2, 4031–4068, 2014Novel approaches for revealing hydro-meteorological
signals multi-scale characteristics
S. P. Yu et al.
Title Page
Abstract Introduction
Conclusions References
Tables Figures
◭ ◮
◭ ◮
Back Close
Full Screen / Esc
Printer-friendly Version
Interactive Discussion
Discussion
P
a
per
|
Discus
sion
P
a
per
|
Discussion
P
a
per
|
Discussion
P
a
per
|
behaviors and revealing local feature of coastal rainfall periodicity, especially in in-creasing the confidence level of wavelet power spectrum test.
2. Comparing the traditional method of judging the precipitation trend by the cli-mate tendency rate, which showed relatively poor significances, the CWT-based forecast approach by deducing the future wavelet coefficients dynamics at the
5
dominant precipitation period with the highest significance level was proved more reasonable. By means of this approach, a general decreasing trend of the coastal annual and seasonal precipitation in the future years was demonstrated.
3. Although the superiorities of the CWT method in revealing the precipitation sig-nals broad-scale periodicities and forecasting the precipitation trend were proved,
10
we found the critical fine-scale mode mixing problem in the CWT caused the poor significances of the fine-scale periodicities, which couldn’t well match the pre-vious studies on the whole valleys precipitation periodicities and on the climate backgrounds. Thus, the EEMD-based HHT method was innovatively introduced to effectively eliminate the fine-scale mode mixing drawback in the CWT. By our
15
research, we suggest that it is reasonable to accurately analyze the precipitation signals multi-scale periodicities by combining the CWT and HHT methods.
4. The demonstrated prominent correlation between the precipitation and the soil and groundwater salinities dynamics indicated that the precipitation increase could effectively leach the surface soil salt downwards, but might aggravate the
20
salt accumulation in the deeper soil layers and groundwater, which asked for rea-sonable drainage measures in rainy seasons to prevent the possible groundwater salinization. By innovatively using the XWT and WTC approaches, the signifi-cant coherence around the 70 day resonant period between the precipitation and groundwater EC dynamics was revealed, which indicated the approximately 5–7
25
NHESSD
2, 4031–4068, 2014Novel approaches for revealing hydro-meteorological
signals multi-scale characteristics
S. P. Yu et al.
Title Page
Abstract Introduction
Conclusions References
Tables Figures
◭ ◮
◭ ◮
Back Close
Full Screen / Esc
Printer-friendly Version
Interactive Discussion
Discussion
P
a
per
|
Discus
sion
P
a
per
|
Discussion
P
a
per
|
Discussion
P
a
per
|
which asks for reasonable salt leaching and evaporation suppression measures to prevent the future soil secondary salinization process. In addition, some ideas about the further improvements of the quantitative evaluation of the precipitation trend and its impact on the soil hydrological process and the longer monitoring data collection in the new cultivated land were proposed.
5
Postscript
In this paper, Fig. 1 was created in ArcGIS 9.3., Figs. 4, 5 and 7 were created in Microsoft Excel 2003. Figure 3 was created in Surfer 8.0. Figure 6 was created in Origin 8.0. Figure 8 was created in MATLAB-2011b.
Acknowledgements. This study is financially supported by the Natural Science Foundation
10
of China and Jiangsu Province (No.41101518, No.BK2011425, and No.BY2013062). Cordial thanks should be extended to the editors and the anonymous reviewers. The Cross Wavelet Transform software package was provided by A. Grinsted, J. C. Moore and S. Jevrejeva, and is available at: http://www.pol.ac.uk/home/research/waveletcoherence/.
References
15
Allen, M. R. and Smith, L. A.: Monte Carlo SSA: detecting irregular oscillations in the presence of coloured noise, J. Climate, 9, 3373–3404, 1996.
Chang, C. P., Zhang, Y. S., and Li, T.: Interannual and interdecadal variations of the East Asian summer monsoon and tropical pacific SSTs.I.II, J. Climate, 13, 4310–4340, 2000.
Coulibaly, P. and Burn, H. D.: Wavelet analysis of variability in annual Canadian streamflows,
20
Water Resour. Res., 40, W03105, doi:10.1029/2003WR002667, 2004. Daubechies, I.: Ten Lectures on wavelets, CBMS, SIAM, 61, 194–202, 1994.
Farge, M.: Wavelet transforms and their applications to turbulence, Annu. Rev. Fluid Mech., 24, 395–457, 1992.
Foufoula-Georgiou, E. and Kumar, P. (Eds.): Wavelets in Geophysics, Academic Press, New
25
York, 373 pp., 1995.
NHESSD
2, 4031–4068, 2014Novel approaches for revealing hydro-meteorological
signals multi-scale characteristics
S. P. Yu et al.
Title Page
Abstract Introduction
Conclusions References
Tables Figures
◭ ◮
◭ ◮
Back Close
Full Screen / Esc
Printer-friendly Version
Interactive Discussion
Discussion
P
a
per
|
Discus
sion
P
a
per
|
Discussion
P
a
per
|
Discussion
P
a
per
|
Gong, Z. Q., Zou, M. W., Gao, X. Q., and Dong, W. J.: On the difference between empirical mode decomposistion and wavelet decomposition in the nonlinear time series, Acta Phys. Sin.-Ch. Ed., 54, 3947–3957, 2005 (in Chinese).
Grinsted, A., Moore, J. C., and Jevrejeva, S.: Application of the cross wavelet transform and wavelet coherence to geophysical time series, Nonlinear Proc. Geoph., 11, 561–566, 2004.
5
Grossmann, A. and Morlet, J.: Decomposition of hardy functions into square integrable wavelets of constant shape, SIAM J. Math. Anal., 723–736, 1984.
Gurley, K., Kijewski, T., and Kareem, A.: First and higher order correlation detection using wavelet transforms, J. Eng. Mech., 129, 188–201, 2003.
Huang, N. E. and Wu, Z. H.: A review on Hilbert–Huang transform: method and its applications
10
to geophysical studies, Rev. Geophys., 46, doi:10.1029/2007RG000228, 2008.
Huang, N. E., Shen, Z., Long, R. S., Wu, M. C., Shih, E. H., Zheng, Q., Tung, C. C., and Liu, H. H.: The empirical mode decomposition method and the Hilbert spectrum for non-stationary time series analysis, P. R. Soc. London, 454, 903–995, 1998.
Huang, N. E., Shen, Z., and Long, R. S.: A new view of nonlinear water waves – the Hilbert
15
spectrum, Ann. Rev. Fluid Mech., 31, 417–457, 1999.
Jevrejeva, S., Moore, J. C., and Grinsted, A.: Influence of the Arctic Oscillation and El Nino– Southern Oscillation (ENSO) on ice conditions in the Baltic Sea: the wavelet approach, J. Geophys. Res., 108(D21), 4677, doi:10.1029/2003JD003417, 2003.
Labat, D., Ababou, R., and Mangin, A.: Rainfall–runoffrelations for karstic springs Part II:
Con-20
tinuous wavelet and discrete orthogonal multiresolution analyses, J. Hydrol., 238, 149–178, 2000.
Labat, D., Ronchail, J., and Guyot, J. L.: Recent advances in wavelet analyses, Part 2: Ama-zon, Parana, Orinoco and Congo discharges time scale variability, J. Hydrol., 314, 289–311, 2005.
25
Liu, D. L., Liu, X. Z., Li, B. C., Zhao, S. W., and Li, X. G.: Multiple time scale analysis of river runoffusing wavelet transform for Dagujia River Basin, Yantai, China, Chin. Geogra. Sci., 19, 158–167, 2009.
Liu, P. C.: Wavelet spectrum analysis and ocean wind waves, in: Wavelets in Geophysics, edited by: Foufoula-Georgiou, E. and Kumar, P. (Eds.), Academic Press, New York, 151–166, 1994.
30
NHESSD
2, 4031–4068, 2014Novel approaches for revealing hydro-meteorological
signals multi-scale characteristics
S. P. Yu et al.
Title Page
Abstract Introduction
Conclusions References
Tables Figures
◭ ◮
◭ ◮
Back Close
Full Screen / Esc
Printer-friendly Version
Interactive Discussion
Discussion
P
a
per
|
Discus
sion
P
a
per
|
Discussion
P
a
per
|
Discussion
P
a
per
|
Mandelbrot, B. B. and Wallis, J. R.: Noah, Joseph and operational hydrology, Water Resour. Res., 4, 909–918, 1968.
Meng, E. J. and Tang, B. P.: Jiangsu seabeach resources and the development strategy, South-east University Process, Nanjing, 180–210, 2010 (in Chinese).
Nener, B. D., Ridsdill-Smith, T. A., and Zeisse, C.: Wavelet analysis of low altitude infrared
5
transmission in the coastal environment, Infrared Phys. Techn., 40, 399–409, 1999.
Roth, P. R.: Effective measurements using digital signal analysis (correlation, transfer and co-herence functions in measurements, using digital signal analysis), IEEE Spectrum, 8, 62–70, 1971.
Sadowskey, J.: Investigation of signal characteristics using the continuous wavelet transform, J.
10
Hopkins APL Tech. D., 17, 258–269, 1996.
Shark, L. K. and Yu, C.: Design of matched wavelet based on generalized Mexican-Hat function, Signal Process., 86, 1451–1469, 2006.
Torrence, C. and Compo, G. P.: A practical guide to wavelet analysis, B. Am. Meteorol. Soc., 79, 61–78, 1998.
15
Torrence, C. and Webster, P. J.: Interdecadal changes in the Enso-Monsoon System, J. Climate, 12, 2679–2690, 1999.
Walker, J. S.: Fourier analysis and wavelet analysis, Notices Am. Math. Soc., 44, 658–670, 1997.
Wang, X. Y. and Ke, X. K.: Grain size characteristics of the extant tidal flat sediments along the
20
Jiangsu coast, China, Sediment Geol., 112, 105–122, 1997.
Wang, Y., Cao, M. K., Tao, B., and Li, K. R.: The characteristics of spatio-temporal patterns in precipitation in China under the background of global climate change, Geogr. Res., 25, 1031–1041, 2006 (in Chinese).
Wei, F. Y. and Zhang, T.: Oscillation characteristics of summer precipitation in the Huaihe River
25
valley and relevant climate background, Sci. China Ser. D, 39, 1360–1374, 2009 (in Chi-nese).
Wu, Z. H. and Huang, N. E.: Ensemble empirical mode decomposition: a noise-assisted data analysis method, Adv. Adapt. Data Anal., 1, 1–41, 2009.
Xu, Y. Q., Li, S. C., and Cai, Y. L.: Wavelet-based characteristics of rainfall behaviors in the
30
NHESSD
2, 4031–4068, 2014Novel approaches for revealing hydro-meteorological
signals multi-scale characteristics
S. P. Yu et al.
Title Page
Abstract Introduction
Conclusions References
Tables Figures
◭ ◮
◭ ◮
Back Close
Full Screen / Esc
Printer-friendly Version
Interactive Discussion
Discussion
P
a
per
|
Discus
sion
P
a
per
|
Discussion
P
a
per
|
Discussion
P
a
per
|
Yang, J.-S., Yu, S.-P., and Liu, G.-M.: Multi-step-ahead predictor design for effective long-term forecast of hydrological signals using a novel wavelet neural network hybrid model, Hydrol. Earth Syst. Sci., 17, 4981–4993, doi:10.5194/hess-17-4981-2013, 2013.
Yang, R. W., Cao, J., Huang, W., and Nian, A. B.: Cross wavelet analysis of the relationship between total solar irradiance and sunspot number, Chinese Sci. Bull., 54, 871–875, 2009.
5
Yu, S. P., Yang, J. S., and Liu, G. M.: A novel discussion on two long-term forecast mechanisms for hydro-meteorological signals using hybrid wavelet-NN model, J. Hydrol., 497, 189–197, 2013.
Yu, S. P., Yang, J. S., and Liu, G. M.: Impact assessment of Three Gorges Dam’s impoundment on river dynamics in the north branch of Yangtze River estuary, China, Environ. Earth Sci.,
10
doi:10.1007/s12665-013-2971-1, 2014.
Zar, J. H.: Biostatistical Analysis, Prentice Hall, New Jersey, 800–920, 1999.
Zhang, Q., Xu, C. Y., and Chen, Y. D.: Wavelet-based characterization of water level behaviors in the Pearl River estuary, China, Stoch. Env. Res. Risk A., 24, 81–92, 2010.
Zhao, X. F., Yang, J. S., and Yao, R. J.: Relationship between soil salt dynamics and factors of
15
water balance in the typical coastal area of Northern Jiangsu Province, T. Chinese Soc. Agr. Eng., 26, 52–57, 2010 (in Chinese).
Zhu, J. H. and Wang, S. W.: 80a-Oscillation of summer rainfall over the East Part of China and East-Asian Summer Monsoon, Adv. Atmos. Sci., 18, 1043–1051, 2001.
Zhu, Y. L., Wang, H. J., Zhou, W., and Ma, J. H.: Recent changes in the summer precipitation
20
NHESSD
2, 4031–4068, 2014Novel approaches for revealing hydro-meteorological
signals multi-scale characteristics
S. P. Yu et al.
Title Page
Abstract Introduction
Conclusions References
Tables Figures
◭ ◮
◭ ◮
Back Close
Full Screen / Esc
Printer-friendly Version
Interactive Discussion
Discussion
P
a
per
|
Discus
sion
P
a
per
|
Discussion
P
a
per
|
Discussion
P
a
per
|
Table 1.Fitting equations of the annual and seasonal precipitation series at the Ganyu, Dongtai and Shanghai stations based on the original data and 10 year running means data (ydenotes the rainfall (mm), x denotes the time series (1, 2, 3, . . . .), R and P denote the correlation coefficient andP value in the regression model.)
Fitting equation of Ganyu rainfall Fitting equation of Dongtai rainfall Fitting equation of Shanghai rainfall Based on original data Based on 10 year Based on original data Based on 10 year Based on original data Based on 10 year
running means running means running means
Annual y=−0.883x+954.7 y=−0.860x+948.8 y=−1.321x+1107.4 y=−1.096x+1089.9 y=1.288x+1119.9 y=2.497x+1064.5 precipitation R=0.06,P=0.65 R=0.19,P=0.21 R=0.09,P=0.50 R=0.21,P=0.15 R=0.11,P=0.41 R=0.55,P=2.08×10⁻⁵ Spring y=0.397x+133.4 y=0.317x+135.8 y=−0.126x+219.6 y=0.099x+216.3 y=−1.406x+332.6 y=−1.164x+334.9 precipitation R=0.09,P=0.49 R=0.31,P=0.03 R=0.03,P=0.84 R=0.07,P=0.63 R=0.31,P=0.02 R=0.74,P=4.43×10⁻¹⁰ Summer y=−0.229x+573.4 y=−0.234x+565.1 y=0.025x+543.3 y=−0.277x+538.2 y=3.167x+382.4 y=4.213x+319.2 precipitation R=0.02,P=0.88 R=0.07,P=0.66 R=0.002,P=0.99 R=0.09,P=0.55 R=0.31,P=0.01 R=0.77,P=2.51×10⁻¹¹ Autumn y=−1.233x+200.4 y=−1.308x+207.6 y=−1.523x+253.3 y=−1.641x+254.8 y=−1.056x+270.4 y=−1.564x+296.7 precipitation R=0.20,P=0.14 R=0.71,P=2.82×10⁻⁸
R=0.24,P=0.06 R=0.64,P=6.70×10⁻⁷
R=0.19,P=0.15 R=0.63,P=7.26×10−07 Winter y=0.183x+47.4 y=0.365x+40.3 y=0.303x+91.2 y=0.723x+80.5 y=0.583x+134.5 y=1.012x+113.7 precipitation R=0.11,P=0.45 R=0.70,P=5.20×10⁻⁸
R=0.12,P=0.38 R=0.68,P=4.36×10⁻⁸
NHESSD
2, 4031–4068, 2014Novel approaches for revealing hydro-meteorological
signals multi-scale characteristics
S. P. Yu et al.
Title Page
Abstract Introduction
Conclusions References
Tables Figures
◭ ◮
◭ ◮
Back Close
Full Screen / Esc
Printer-friendly Version
Interactive Discussion
Discussion
P
a
per
|
Discus
sion
P
a
per
|
Discussion
P
a
per
|
Discussion
P
a
per
|
Table 2.Annual and seasonal precipitation periods and their significances at different time scales based on the Morlet and Mexican Hat wavelet transforms at the Ganyu station.
Periodicity level Morlet wavelet Mexican Hat wavelet
a(years) T(years) Confidence level a(years) T(years) Confidence level Annual First 11 17 0.001 3 15 0.10
precipitation Second 18 21 0.01 – – – Third 4 5 0.25 – – – Spring First 5 6 0.05 2 8 0.15 precipitation Second 13 16 0.30 – – – Summer First 13 15 0.005 3 11 0.15 precipitation Second 18 21 0.10 – – –
Third 4 5 0.30 – – – Fourth 2 3 0.95 – – – Autumn First 10 12 0.05 3 12 0.05 precipitation Second 18 21 0.15 – – – Winter First 13 16 0.20 3 15 0.40 precipitation Second 8 11 0.40 – – –