www.atmos-chem-phys.net/17/1805/2017/ doi:10.5194/acp-17-1805-2017
© Author(s) 2017. CC Attribution 3.0 License.
Differences in BVOC oxidation and SOA formation above and below
the forest canopy
Benjamin C. Schulze1, Henry W. Wallace1, James H. Flynn2, Barry L. Lefer3, Matt H. Erickson2, B. Tom Jobson4, Sebastien Dusanter5,6,7, Stephen M. Griffith7,a, Robert F. Hansen8,b, Philip S. Stevens8, Timothy VanReken4,c, and Robert J. Griffin1
1Department of Civil and Environmental Engineering, Rice University, Houston, TX 77005, USA 2Department of Earth and Atmospheric Sciences, University of Houston, Houston, TX 77204, USA 3Airborne Sciences Program, NASA, Washington, DC 20546, USA
4Department of Civil and Environmental Engineering, Laboratory for Atmospheric Research,
Washington State University, Pullman, WA 99164, USA
5Mines Douai, SAGE, 59508 Douai, France
6Université de Lille, 59655 Villeneuve d’Ascq, France
7School of Public and Environmental Affairs, Indiana University, Bloomington, IN 47405, USA 8Department of Chemistry, Indiana University, Bloomington, IN 47405, USA
anow at: Department of Chemistry, The Hong Kong University of Science and Technology,
Kowloon, Hong Kong
bnow at: School of Chemistry, University of Leeds, Leeds, LS2 9JT, UK cnow at: National Science Foundation, Washington, DC 22230, USA Correspondence to:Robert J. Griffin ([email protected])
Received: 8 June 2016 – Discussion started: 14 June 2016
Revised: 18 November 2016 – Accepted: 22 December 2016 – Published: 7 February 2017
Abstract. Gas-phase biogenic volatile organic compounds (BVOCs) are oxidized in the troposphere to produce sec-ondary pollutants such as ozone (O3), organic nitrates
(RONO2), and secondary organic aerosol (SOA). Two
cou-pled zero-dimensional models have been used to investigate differences in oxidation and SOA production from isoprene and α-pinene, especially with respect to the nitrate radical (NO3), above and below a forest canopy in rural
Michi-gan. In both modeled environments (above and below the canopy), NO3mixing ratios are relatively small (< 0.5 pptv);
however, daytime (08:00–20:00 LT) mixing ratios below the canopy are 2 to 3 times larger than those above. As a re-sult of this difference, NO3 contributes 12 % of total
day-timeα-pinene oxidation below the canopy while only con-tributing 4 % above. Increasing background pollutant lev-els to simulate a more polluted suburban or peri-urban for-est environment increases the average contribution of NO3
to daytime below-canopyα-pinene oxidation to 32 %. Gas-phase RONO2produced through NO3 oxidation undergoes
net transport upward from the below-canopy environment during the day, and this transport contributes up to 30 % of to-tal NO3-derived RONO2production above the canopy in the
morning (∼07:00). Modeled SOA mass loadings above and below the canopy ultimately differ by less than 0.5 µg m−3,
and extremely low-volatility organic compounds dominate SOA composition. Lower temperatures below the canopy cause increased partitioning of semi-volatile gas-phase prod-ucts to the particle phase and up to 35 % larger SOA mass loadings of these products relative to above the canopy in the model. Including transport between above- and below-canopy environments increases above-below-canopy NO3-derived α-pinene RONO2SOA mass by as much as 45 %,
1 Introduction
Globally, organic compounds account for a substantial frac-tion of total atmospheric aerosol mass (Zhang et al., 2007; Jimenez et al., 2009) and therefore have significant impli-cations for health, visibility, and climate. Rather than being emitted directly, nearly 70 % of this material is thought to be secondary organic aerosol (SOA) formed from the oxi-dation of volatile organic compounds (VOCs) (Hallquist et al., 2009). Many of the relevant VOCs are biogenic in origin, causing naturally emitted compounds to contribute substan-tially to tropospheric aerosol burdens (Seinfeld and Pankow, 2003). Isoprene (C5H8)and monoterpenes (C10H16)are
im-portant biogenic VOCs (BVOCs) due to their significant rates of emission and reactivity. Studies suggest that together they comprise 55–65 % of non-methane VOC emissions globally (Guenther et al., 1995, 2012; Hallquist et al., 2009) with estimated yearly emissions of 535 and 157 Tg for isoprene and monoterpenes, respectively (Arneth et al., 2011; Guen-ther et al., 2012). Thus, characterizing the oxidation chem-istry and subsequent formation of SOA from BVOCs, espe-cially isoprene and monoterpenes, is critical. Despite con-tinual progress, many questions remain regarding the mech-anisms of SOA production, and current large-scale atmo-spheric models often underpredict organic aerosol (OA) mass loadings (Heald et al., 2005; Volkamer et al., 2006; Pye and Seinfeld, 2010).
Forests represent a major source of BVOC emissions and therefore heavily influence processes related to ozone (O3)
and SOA formation on a global scale. As a result, major ef-forts have recently been undertaken to better understand the dynamics of chemical processing in forest environments and the related exchange with the atmosphere (Pugh et al., 2010; Steiner et al., 2011; Wolfe et al., 2011; Bryan et al., 2012; Ashworth et al., 2015). These studies have improved un-derstanding of in-canopy gas-phase chemical processing, re-vealed current problems associated with BVOC degradation schemes, and highlighted the relevance of atmospheric tur-bulence within the canopy layer; however, aerosol formation processes within forests have thus far received less attention (Ashworth et al., 2015; VanReken et al., 2015). Observed differences in photolysis rates, temperature, and mixing ra-tios of BVOCs and other trace gases above and below the canopy, combined with measurements that indicate above-and below-canopy environments frequently experience at-mospherically decoupled conditions, suggest that chemical processes occurring above and below the forest canopy may be substantially different (Foken et al., 2012; Wallace, 2013), implying the potential for different SOA formation and loss processes.
While differences in major daytime oxidants O3and
hy-droxyl radical (OH) mixing ratios above and below the forest canopy have been better characterized, the effect of the forest canopy on the nitrate radical (NO3), a known
significant nighttime oxidant of BVOCs, has received less
study (Fuentes et al., 2007; Bryan et al., 2012; Ashworth et al., 2015). Ambient NO3concentrations depend strongly
on anthropogenic combustion processes, as the compound is formed from the reaction of O3and nitrogen dioxide (NO2)
and lost, either directly or indirectly, through reaction with nitric oxide (NO) and NO2. Daytime NO3concentrations are
generally assumed to be negligible, as rapid photolysis and reaction with NO result in midday lifetimes as low as 5 s (Monks, 2005). However, recent work has highlighted the potential for relevant daytime NO3concentrations (Geyer et
al., 2003a; Brown et al., 2005; Fuentes et al., 2007; Pratt et al., 2012). For example, the shade provided by a forest canopy and the corresponding reduction in photolysis rates may result in elevated concentrations near the ground rela-tive to the mixed boundary layer above (Brown et al., 2005; Fuentes et al., 2007).
Differences in oxidant mixing ratios above and below the canopy may lead to above-/below-canopy differences in the production pathway of organic nitrates (RONO2), which
form either through NO3oxidation of BVOCs or through OH
oxidation followed by reaction with NO. Organic nitrates, many of which have volatilities low enough to partition to the aerosol phase, depend on both BVOCs (biogenic) and NOx (primarily anthropogenic) for their formation, causing
these products to often be particularly important to aerosol production in regions subject to high biogenic and anthro-pogenic emissions (Hallquist et al., 1999; Fry et al., 2009, 2011, 2013, 2014; Rollins et al., 2013; Xu et al., 2014, 2015; B. H. Lee et al., 2016). As it has recently become apparent that RONO2 produced through NO3 oxidation of
monoter-penes are a particularly important source of SOA (e.g., Fry et al., 2009, 2013; Rollins et al., 2013; Ayres et al., 2015), underestimating formation through this pathway may par-tially contribute to the current underprediction of SOA in large-scale models. In addition, by serving as nitrogen ox-ide (NOx=NO+NO2) reservoirs, RONO2 species
influ-ence O3 production and the oxidative capacity of the
atmo-sphere (Wu et al., 2007; Farmer et al., 2011; Paulot et al., 2012). As a result, modifications to their production could have cascading effects on other aspects of atmospheric chem-istry. While gas-phase RONO2have been previously
mod-eled above a forest canopy layer (Giacopelli et al., 2005; Pratt et al., 2012), the effect of physical and chemical differences above and below the forest canopy on their formation and their contribution to SOA has yet to be specifically investi-gated.
In addition to RONO2 chemistry, recent work has
high-lighted pathways for SOA formation other than reversible partitioning of gas-phase oxidation products that may also be impacted by light and chemical gradients produced by forest canopies. For example, O3 oxidation of monoterpenes has
et al., 2015). In addition, reactive uptake of isoprene epoxy-diols, glyoxal, and methylglyoxal onto aerosol surfaces to produce non-volatile SOA has been shown to constitute a substantial fraction of total SOA mass loadings in isoprene-dominated environments (Li et al., 2015).
Numerous studies have utilized one-dimensional models to investigate BVOC and radical chemistry within and above forests (Fuentes et al., 2007; Wolfe et al., 2011; Pratt et al., 2012; Rinne et al., 2012; Mogensen et al., 2015); however, to our knowledge only one study has used such a model to investigate SOA production (Ashworth et al., 2015), and the influence of chemical and physical differences above and be-low the forest canopy was not explicitly investigated. In ad-dition, it was noted that SOA mass loadings were underpre-dicted within the canopy space. Furthermore, the majority of forest–atmosphere exchange models have considered rela-tively remote locations, encouraging an evaluation of the sen-sitivity of modeled results to elevated background pollutant concentrations that may exist in suburban (or even urban), forested locations.
Understanding differences in atmospheric chemistry above and below the forest canopy is important for two rea-sons. First, as people living within or nearby forested en-vironments breathe air under the canopy, substantial differ-ences in mass loadings above and below the forest may lead to incorrect conclusions in regional air quality mod-els on the outer edges of suburban metropolitan areas. Sec-ond, while vertical transport is suppressed within the forest layer relative to conditions without trees, exchange between the sub-canopy environment and the atmospheric boundary layer does occur, suggesting that products formed in the low-light conditions below the canopy affect above-canopy chem-ical processes and aerosol formation once transported, a phe-nomenon that may be particularly relevant for NO3-derived
RONO2. To investigate these possibilities, we applied two
coupled zero-dimensional (0-D) models describing BVOC– NO3–SOA chemistry with highly detailed chemical
mecha-nisms to observations made above and below a forest canopy in a rural, deciduous forest environment during the inten-sive Community Atmosphere-Biosphere Interactions Exper-iments (CABINEX) 2009 field campaign.
2 Methods
2.1 Description of the model
The modeling structure used in this study incorporates the coupling of two 0-D models designed to investigate detailed differences in chemical processing and SOA formation above and below the forest canopy layer. MATLAB computing soft-ware (v. R2014a) was used to perform a diel analysis of each environment (above and below the canopy) with output ev-ery second. The model uses a variable-order ordinary dif-ferential equation solver (MATLAB_ODE solver ode15s) to
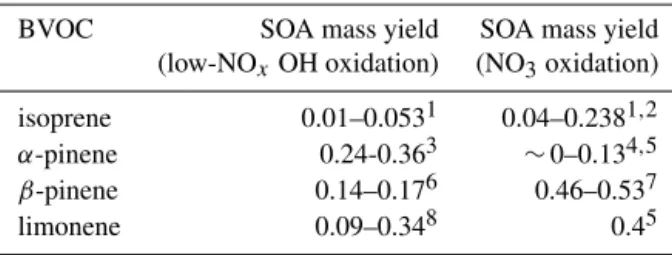
Table 1.Overview of SOA mass yields from previous chamber ex-periments on isoprene,α-pinene,β-pinene, and limonene.
BVOC SOA mass yield SOA mass yield
(low-NOxOH oxidation) (NO3oxidation) isoprene 0.01–0.0531 0.04–0.2381,2 α-pinene 0.24-0.363 ∼0–0.134,5
β-pinene 0.14–0.176 0.46–0.537
limonene 0.09–0.348 0.45
1Kroll et al. (2006).2Ng et al. (2008).3Eddingsaas et al. (2012).4Fry et
al. (2014).5Spittler et al. (2006).6Sarrafzadeh et al. (2016).7Fry et
al. (2009).8Griffin et al. (1999).
solve the underlying system of differential equations. One day of model spin-up was used for each analysis (Pratt et al., 2012). The oxidation mechanisms ofα-pinene and isoprene were obtained directly from the Master Chemical Mecha-nism (MCM v3.2, via the website: http://mcm.leeds.ac.uk/ MCM; Jenkin et al. (1997); Saunders et al., 2003), as well as the standard gas-phase inorganic reactions included in the MCM, resulting in a system of 2260 chemical reactions with 712 chemical species. These two BVOCs were chosen be-cause of their relatively high emission rates as well as dif-ferences in their reactivity and SOA formation potential. For instance, isoprene is known to react predominately with OH, whileα-pinene reacts substantially with all three major
ox-idants within forests (Fuentes et al., 2007). The SOA yields measured during low-NOxOH oxidation of isoprene are
gen-erally lower than those fromα-pinene; however, their SOA yields from NO3oxidation are similar (Table 1).
Chemical species within each 0-D box (above and below the canopy) react in the gas phase via mechanisms dictated by the MCM, partition between the gas and aerosol phases if of sufficiently low volatility, undergo dry deposition, and are transported between environments. While the gas-phase chemical mechanism has been briefly introduced above, the remaining model processes are described in the sections be-low.
2.2 Modeling of aerosol processes
2.2.1 Equilibrium gas-particle partitioning
The equilibrium gas-particle partitioning model developed by Colville and Griffin (2004) was used to quantify SOA production from individual isoprene andα-pinene oxidation products. Assuming that OA exists as a liquid, an equilibrium partitioning coefficient (Kom,i, m3µg−1)for each oxidation
product can be expressed as (Pankow, 1994a, b; Odum et al., 1996)
Kom,i=
Ai
GiMo
= RT
MWom106αipLo,i
where Ai is the mass concentrations of species i in the
aerosol phase (µg m−3), G
i is the mass concentration of
species i in the gas phase (µg m−3),M
o is the total mass
concentration of the absorbing phase (µg m−3), R is the
ideal gas constant (8.206×10⁻⁵m3atm mol−1K−1), T is the temperature (K), MWomis the average molecular weight
of the absorbing phase (g mol−1),α
iis the activity coefficient
of oxidation product i in the aerosol phase (here assumed ideal, αi=1), and poL,i is the temperature-dependent
cooled liquid vapor pressure of the species (atm). The sub-cooled liquid vapor pressure of each oxidation product was determined using the SIMPOL.1 group contribution method (Pankow and Asher, 2008).
Considering this definition in conjunction with the total species concentration (µg m−3),C
i (based on the chemical
mechanism described above), and a mass balance for the phase distribution,
XN
i=1
Kom,iCi
1+Kom,iMo
+POA
Mo
−1=0, (2)
where POA represents any initially present OA. Using Ci
values determined by the gas-phase mechanism, this equa-tion is solved for Moat every model time step, from which
the value ofAifor each of theN species can be determined.
It should be noted that this partitioning model fails to account for any effects related to the liquid water content (LWC) of SOA or any particle-phase reactions, which, in the case of non-oxidative accretion reactions, have the potential to sig-nificantly lower the volatility of the resulting SOA (Kroll and Seinfeld, 2008). As these particle-phase reactions can rapidly produce high MW, low-volatility compounds, often more aerosol mass is produced in the environment than equi-librium partitioning of the gas-phase species would predict (Johnson et al., 2005; Kroll and Seinfeld, 2008).
Furthermore, as increases in relative humidity (RH), and subsequent increases in the water content of SOA, are known to enhance the partitioning of organic species to the aerosol phase, the omission of this process also potentially leads to underestimation of the total amount of SOA formed (Hen-nigan et al., 2008). However, as water uptake is generally driven by inorganic aerosol components (Hennigan et al., 2008; Carlton and Turpin, 2013), which only comprised a small fraction of total aerosol mass during CABINEX, the overall effect of RH is predicted to be small for the condi-tions of this study (VanReken et al., 2015).
Therefore, the primary uncertainty in aerosol formation is related to the production of high MW compounds through particle-phase reactions, but these compounds are partially accounted for through the parameterization of extremely low-volatility organic compound (ELVOC) formation de-scribed below. Following Ashworth et al. (2015), our model utilizes a POA value of 0.5 µg m−3for calculation of SOA
partitioning.
2.2.2 Production of ELVOCs
Recent studies have indicated that ELVOCs contribute sub-stantially to monoterpene SOA mass loadings (Ehn et al., 2014; Jokinen et al., 2015). As a result, despite the MCM be-ing the most complete chemical mechanism available, sole modeling of the partitioning of MCM oxidation products may result in an underprediction of SOA formation. After initial oxidation by O3(or OH to a lesser extent),
monoter-pene peroxy radicals have the potential to undergo sequential H-shifts and O2additions that very rapidly produce ELVOCs
with multiple hydroperoxide moieties (Jokinen et al., 2015; Mentel et al., 2015). Isoprene is also known to produce ELVOCs; however, measured yields are much smaller than those of monoterpenes (Jokinen et al., 2015). In SOA for-mation experiments with low total aerosol mass loadings, a characteristic similar to the relatively pristine environment near the CABINEX site used in this study, irreversible con-densation of these ELVOCs represents a dominant fraction of total aerosol mass (Ehn et al., 2014).
A gas-phase ELVOC formation mechanism is included within the model based on observed molar ELVOC yields fromα-pinene+O3 (3.4 %), α-pinene+OH (0.44 %),
iso-prene+O3 (0.01 %), and isoprene+OH (0.04 %) (Jokinen et al., 2015). Laboratory experiments suggest that, in gen-eral, a distribution of monomer (C10) and dimer (C19–20)
ELVOC oxidation products contributes to SOA mass fromα
-pinene oxidation (Ehn et al., 2014), while isoprene is thought to form primarily monomer (C5) species (Jokinen et al.,
2015); however, as monomers are generally observed with a mass spectral signal an order of magnitude higher than those of dimers, and in order to ensure that uncertainty in the modeling parameters results in underprediction rather than overprediction of ELVOC mass loadings, all ELVOC products in the model presented here are assumed to be monomers. Specifically,α-pinene is assumed to produce the species C10H16O9, while isoprene is assumed to produce
C5H10O8. At a representative temperature of 20◦C, these
products have saturation vapor pressures of 1.03×10⁻¹⁴atm and 2.81×10⁻¹¹atm, respectively, according to the SIM-POL.1 method. These specific products were selected based on their intensity in observed ELVOC mass spectra and the fact that their elemental ratios are generally representative of the average ELVOC product distributions observed (Ehn et al., 2014; Jokinen et al., 2015).
2.2.3 Reactive uptake of isoprene epoxides, glyoxal, and methylglyoxal
irre-versibly incorporated into SOA with rates controlled by par-ticle acidity and the surface area of ambient OA. Isoprene epoxides (IEPOX) are formed through OH oxidation of iso-prene hydroxyhydroperoxides and constitute a major frac-tion of SOA from isoprene oxidafrac-tion in low-NOxconditions
(Paulot et al., 2009; Lin et al., 2012). Glyoxal (CHOCHO) and methylglyoxal (CH3C(O)CHO), the smallest dicarbonyl
compounds, are formed from the oxidation of a variety of VOCs, and while they are known to have short atmospheric lifetimes due to photolysis and OH oxidation, their high wa-ter solubility results in substantial uptake onto aqueous sur-faces (Fu et al., 2009). After being incorporated into the aerosol, aqueous-phase oxidation of these species results in the formation of non-volatile organic acids or oligomers, pre-venting partitioning back into the gas phase (Loeffler et al., 2006; Carlton et al., 2007; Lin et al., 2012). Previous mea-surements in Mexico City reported significantly lower con-centrations of glyoxal and methylglyoxal than gas-phase pro-cesses would predict, supporting the hypothesis of their re-active uptake into the particle phase (Volkamer et al., 2007). Isoprene epoxides have been identified in aerosol measure-ments at multiple locations (Chan et al., 2010; Froyd et al., 2010).
Following the method of Li et al. (2015), the surface-controlled uptake of these products can be expressed by
dMair
dt = −
1 4γiνiA
Gi, (3)
whereγi is the reactive uptake coefficient (not the activity
coefficient used in Eq. 1),νi is the thermal velocity of the
gas species (m s−1), Ais the ambient aerosol surface area
concentration (m2m−3), andG
i is the mass concentration
of the species in the gas phase (µg m−3)(the same quantity
as Gi in Eq. 1). As the model does not explicitly calculate
aerosol sizes, aerosol surface area concentrations were ob-tained from the study of VanReken et al. (2015) during CAB-INEX 2009. The reactive uptake coefficient represents the probability that any collision between a gas-phase molecule and the aerosol surface will result in irreversible uptake into the aerosol phase. Glyoxal and methylglyoxal were assigned a reactive uptake coefficient of 2.9×10⁻³, following the method of Fu et al. (2009). As this value is not adjusted for the LWC of aerosol measured at CABINEX, which is pre-dicted to be low, our model may overpredict uptake of gly-oxal and methylglygly-oxal to some extent; however, modeled mass loadings of both glyoxal and methylglyoxal SOA agree with simulations by Li et al. (2015) for northern Michigan. The reactive uptake coefficient of isoprene epoxides depends strongly on aerosol acidity, causing the value to vary substan-tially depending on the composition of the ambient aerosol (Wang et al., 2012). Using the Community Multi-Scale Air Quality (CMAQ) model, Li et al. (2015) calculated isoprene epoxide uptake coefficients based on particle acidity across the entire US and found a value of around 0.5×10⁻³
appro-priate for conditions in northern Michigan. We utilized this value for this study.
2.2.4 Heterogeneous hydrolysis of organic nitrates Organic nitrates have a large influence on atmospheric chem-istry through their impacts on NOx, O3, and OA. It has been
shown that RONO2 within the aerosol phase can be
effi-ciently hydrolyzed, leading to the production of HNO3 and
the removal of NOxfrom the atmosphere (Day et al., 2010;
Browne et al., 2013; Rindelaub et al., 2015; Bean and Hilde-brandt Ruiz, 2016). Both field studies and chamber exper-iments have observed decreases in the RONO2 content of
SOA under conditions of increased RH (Day et al., 2010; Bean and Hildebrandt Ruiz, 2016).
While many questions remain regarding the kinetics of the hydrolysis mechanism and the specific relationship with RH, chamber experiments have defined lifetimes of both isoprene andα-pinene nitrates within OA (Cole-Filipiak et al., 2010; Darer et al., 2011; Hu et al., 2011; Rindelaub et al., 2015; Bean and Hildebrandt Ruiz, 2016). For our study, both iso-prene andα-pinene nitrate oxidation products are assumed to undergo first-order loss within the aerosol phase. Isoprene ni-trate loss is parameterized using the average lifetimes found by Hu et al. (2011) for primary, secondary, and tertiary nitrate species. As primary and secondary nitrates only slowly hy-drolyze even under the most acidic conditions observed (with a lifetime of∼500 h at a pH of 0), which were not likely to occur during CABINEX, those products have an effective hydrolysis rate of zero within the model (Hu et al., 2011). However, tertiary nitrates, which are efficiently hydrolyzed even at neutral pH, have an effective lifetime of 0.67 h within the aerosol (Hu et al., 2011).
To our knowledge, only two chamber experiments have been performed regarding the hydrolysis of α-pinene ni-trate oxidation products within OA (Rindelaub et al., 2015; Bean and Hildebrandt Ruiz, 2016). Of these, only the study by Bean and Hildebrandt Ruiz (2016) quantified hydroly-sis rates. The overall hydrolyhydroly-sis rate was found to depend strongly on RH. For instance, experiments with an RH be-tween 20 and 60 % produced a hydrolysis rate of 2 day−1,
while those with RH above 70 % had rates around 7 day−1
(Bean and Hildebrandt Ruiz, 2016). As RH values measured during CABINEX were generally above 60 %, our model uses a rate of 7 day−1, corresponding to a lifetime of 3.4 h.
2.3 Deposition
leaf mesophyll, cuticular surfaces, and stomata. A thorough description of the particular equations used in this method can be found in Bryan et al. (2012). The specific parame-ter values used in the calculation of deposition velocities are listed in Table S1 in the Supplement. The above-canopy box height was assumed to vary diurnally based on the boundary layer values utilized in Giacopelli et al. (2005) for a previous model of the CABINEX location. As our model does not cal-culate aerosol sizes, size distribution data obtained from Van-Reken et al. (2015) were used to calculate a volume-weighted average settling velocity of aerosol particles.
In the below-canopy model, deposition was assumed to oc-cur to the ground and was modeled following the method of Gao et al. (1993). This method assumes that the deposition velocity is based on the combination of aerodynamic resis-tance near the ground and a species-specific resisresis-tance to de-position to the forest floor. The box height was set to 6 m (the assumed bottom of the canopy layer or top of the trunk space) for the entire diurnal period.
2.4 Vertical transport
Recent modeling studies have revealed that in-canopy verti-cal mixing substantially influences overall forest chemistry (Bryan et al., 2012). Mixing is often parameterized in one-dimensional (1-D) models using traditional K-theory, which quantifies the transport of chemical species by eddy diffu-sion at a rate corresponding to the heat exchange coeffi-cient (Wolfe et al., 2011; Bryan et al., 2012). While one of the most accurate turbulence parameterization methods avail-able, such a process is computationally sophisticated and is better suited to 1-D modeling of an environment. In or-der to simplify the quantification of mixing, we have im-plemented the concept of in-canopy residence lifetimes to determine mixing rates. Measured and modeled in-canopy residence times vary substantially depending on the forest environment studied. For instance, Fuentes et al. (2007) re-port average residence times of∼8 min for a parcel emitted near the ground, during the day, in a forest with a 26 m high canopy, while Farmer and Cohen (2008) calculate residence times of 1–7 min for a forest with a canopy height of only 5.7 m. Maximum residence times of up to 50 min have been reported in tall forests (Strong et al., 2004). Transport back into the canopy is an even more complicated process, as co-herent structures (i.e., sweeps of air downward), rather than simple turbulence, often produce the majority of scalar fluxes (Steiner et al., 2011).
For our model, a minimum residence time of 10 min in each location is assumed to apply midday, in agreement with previous measurements, and residence times vary diurnally based on the modeled turbulent heat exchange coefficient produced by the CACHE model (Bryan et al., 2012). In addi-tion, we have included a diurnal above-canopy vertical dilu-tion rate based on the average of methanol and acetaldehyde
above-canopy vertical loss calculated by the FORCAsT 1-D model for summertime conditions (Ashworth et al., 2016).
The inclusion of a mixing process, vertical dilution, and dry deposition results in relatively good agreement between measured and modeled concentrations of the sum of the iso-prene oxidation products methacrolein and methylvinyl ke-tone (MACR+MVK) (Supplement Fig. S1). These pho-tooxidation products of isoprene are often significantly overestimated in low NOx conditions modeled in forests
(Bryan et al., 2012; Ashworth et al., 2015). The validity of the mixing process specifically is supported by the agree-ment between the measured and modeled differences in MACR+MVK mixing ratios above and below the canopy (Fig. S1c), as this comparison removes the influence of errors in the chemical mechanism that may produce overpredic-tions or underpredicoverpredic-tions of the overall mixing ratios. While the comparison of differences in mixing ratios above and below the canopy indicates that we likely overpredict mix-ing in the early mornmix-ing and underpredict mixmix-ing in the late evening, this study is primarily focused on daytime condi-tions, during which the differences are within a few per-cent. Different minimum transport lifetimes above and be-low the canopy (from 10 to 30 min) were analyzed to deter-mine whether better agreement between measured and mod-eled MACR+MVK profiles could be attained; however, this ultimately produced little variation in the overall agreement, and the use of a 10 min lifetime in each location was found to produce minimum error between measured and modeled MACR+MVK mixing ratios (Fig. S1d).
2.5 Input data
The CABINEX campaign took place in northern Michigan near the University of Michigan Biological Station (UMBS) in August 2009 and utilized the Program on Oxidants: Pho-tochemistry, Emissions, and Transport (PROPHET) tower to perform gas-phase measurements throughout the canopy. A deciduous forest with a canopy height of around 22.5 m sur-rounds the PROPHET tower and consists of tree species that emit significant quantities of both isoprene (aspen and oak) and monoterpenes (pine and birch). Above-canopy measure-ments were made at a height of 34 m, while those below the canopy occurred at a height of 6 m (Fig. S2). More detailed descriptions of both the PROPHET tower and the surround-ing environment can be found in the literature (Carroll et al., 2001; Ortega et al., 2007; Griffith et al., 2013).
composi-tion vary widely based on ambient wind direccomposi-tion, but show a stronger anthropogenic influence when air masses come from populated areas to the east and south (VanReken et al., 2015). Accurate modeling of diel changes in SOA mass loadings us-ing a 1-D model has thus far proven difficult (Ashworth et al., 2015).
The model was constrained by diel median values of hy-drogen oxides (HOx=OH+hydroperoxy radical (HO2)),
NO, NO2O3,α-pinene (monoterpenes), isoprene,
formalde-hyde (HCHO), and the photolysis rate of NO2. Each of these
species was therefore assigned a median measured value at every hour, and values used for each model time step (e.g., 08:03) were determined by linear interpolation between hourly values. The Indiana University Fluorescence by Gas Expansion (IU-FAGE) instrument was used to measure OH and HO2(Griffith et al., 2013). Interferences involved in the
operation of the IU-FAGE instrument caused slight positive artifacts in the measurement of both OH and HO2
concen-trations. During below-canopy measurements, laser photol-ysis of O3 within the IU-FAGE sampling cell resulted in a
minor artificial increase in OH concentrations, while both above and below the canopy, a fraction of peroxy radicals (RO2) was converted into HO2 within the sampling cell,
as further explained in Sect. 2.7. The resulting influence of OH on BVOC chemistry below the canopy therefore repre-sents an upper limit. Nitrogen oxides were measured using a two-channel chemiluminescense instrument with a blue-light converter for NO2measurements (Air Quality Design, Inc.),
O3was measured using ultraviolet absorption (Thermo
En-vironmental Instruments Inc. 49c), and isoprene, monoter-penes, and formaldehyde were measured with a proton-transfer reaction mass spectrometer (PTR-MS) (IONICON, Inc.). As the PTR-MS did not distinguish between monoter-pene species, all monotermonoter-penes were assumed to beα-pinene for modeling purposes even though its RONO2 and SOA
yields are generally smaller than those of other monoterpene species (Fry et al., 2014; Zhao et al., 2015), likely result-ing in a low bias. This assumption is justified by notresult-ing that gas chromatography–mass spectrometry (GC–MS) measure-ments taken at a height of 6 m during CABINEX indicate
α-pinene accounted for an average of∼77 % of monoter-penes at the site (Wallace, 2013). The photolysis frequency of NO2was measured with a Scanning Actinic Flux
Spectro-radiometer (Flynn et al., 2010). Further information regard-ing the measurement techniques can be found in Griffith et al. (2013).
Above-canopy photolysis frequencies for isoprene andα -pinene oxidation products were obtained directly from the MCM, while photolysis frequencies for other species were taken from the National Center for Atmospheric Research (NCAR) Tropospheric Ultraviolet and Visible (TUV) Model (TUV Model 4.1, via the website: http://cprm.acom.ucar.edu/ Models/TUV/Interactive_TUV/). In order to correct for non-clear-sky conditions, above-canopy photolysis frequencies were scaled to represent differences between the measured
NO2 photolysis frequency and that predicted by the TUV
model. Below-canopy frequencies were then calculated by scaling by the ratio of the below-to-above-canopy NO2
pho-tolysis frequencies measured during CABINEX. This ratio is time-of-day dependent, with a maximum around noon, and varies over the range of 0.05 to 0.17 during daylight hours (Fig. S3d). Model input data are shown in the SI (Fig. S3).
At CABINEX, O3 levels were relatively consistent
throughout the day, reaching a maximum in the afternoon (Fig. S3). Median mixing ratios were consistently ∼5 to 10 ppbv larger above the canopy than below (∼30–35 ppbv above, ∼20–30 ppbv below). While NO2 concentrations peaked at night (∼1 ppbv), likely due to both O3 oxidation
of local NO and transport from non-local air masses, they were larger below the canopy in the early morning. Concen-trations of NO were below the detection limit of the instru-ment (6.7 pptv) for much of the night and were therefore held at 6.7 pptv for modeling purposes during these periods. Max-imum daytime NO mixing ratios reached∼0.2 ppbv in the early morning, largely the result of NO2photolysis (Seok et
al., 2013). Monoterpene (-pinene) concentrations were con-sistent at around 0.3 ppbv, although they exhibited slight diel variability with maxima occurring at night, whereas the iso-prene profile displayed strong emission dependence on sun-light and temperature and reached a maximum mixing ratio of∼1.6–1.7 ppbv mid-afternoon.
2.6 Modification of the gas-phase RONO2chemical
mechanism
Without any changes to the MCM, predicted gas-phase RONO2 concentrations (∼400 pptv) are much larger than
those modeled by Pratt et al. (2012) (∼20–70 pptv), imply-ing that gas-phase RONO2 is overpredicted by the MCM.
Dry deposition rates of both isoprene andα-pinene nitrates (∼1.5–2.5 cm s−1)are similar to the values used in Pratt et
al. (2012), and the vertical dilution rate used in our model is comparable to the value used by Giacopelli et al. (2005) for nitrates at UMBS, suggesting that physical processes are not the reason for the modeled difference.
The discrepancy in total RONO2 concentrations
there-fore likely stems from inappropriately large RONO2yields
or inappropriately small loss rates within the MCM. While monoterpene nitrate concentrations modeled in previous studies are generally less than 50 pptv (Pratt et al., 2012; Fisher et al., 2016), without applying any changes to the chemical mechanism obtained from the MCM, two first-generationα-pinene hydro-hydroxynitrates, produced from NO3oxidation followed by RO2+HO2reaction, have a
cu-mulative concentration of over 100 pptv for the majority of the day (Fig. S4a). Within the MCM, the first-generation RO2+HO2 reaction that forms these products has a 100 %
radicals are more likely to produce OH or alcohols upon reaction with HO2 (Jenkin et al., 2007; Dillon and
Crow-ley, 2008). Recent modeling by Fisher et al. (2016) using the GEOS-Chem model assumes that the first-generation monoterpene RO2from NO3oxidation has only a 10 %
prob-ability of nitrate retention upon reaction. In order to account for the laboratory findings and to align our chemical scheme with that of Fisher et al. (2016), we reduced the production rate of the two hydro-hydroxynitrate compounds by a fac-tor of 10. This results in an average nitrate retention proba-bility of 8.5 % above-canopy and 12.8 % below-canopy for
α-pinene RO2 from NO3 oxidation. The finalized
concen-trations, while still larger than those modeled by Pratt et al. (2012), show much better agreement with previous find-ings.
Second-generation isoprene nitrate concentrations (∼100 pptv) also appear to be overpredicted relative to previous observations, which report concentrations of 20–50 pptv (Pratt et al., 2012; Fisher et al., 2016). Similarly to the first-generation α-pinene nitrate concentrations, modeled second-generation isoprene nitrate mixing ratios are dominated by two species, methyl vinyl ketone nitrate (MVKN) and methacrolein nitrate (MACRN). The MCM does not assume these products react with NO3 or O3, as
has been recently suggested (Kerdouci et al., 2010), and the reaction rate of each species with OH is 5–10 times larger in the model used by Pratt et al. (2012) than in the MCM. Adding reactions with NO3 and O3 and modifying the
reaction rate with OH to match that used in Pratt et al. (2012) improves agreement (Fig. S4); however, the implications of the remaining differences are discussed in Sect. 3.3. Ultimately, as will be discussed, the RONO2 fraction of
SOA agrees well with previous measurements, indicating that the possible remaining errors in gas-phase RONO2
concentrations should not unduly influence the conclusions related to SOA mass loadings.
2.7 Model evaluation
Measured OH and HO2profiles above the canopy were
com-pared to those predicted by our model when leaving HOx
concentrations unconstrained, which gives an indication of the validity of both the modeled oxidation processes and photolysis frequencies, as both have a large effect on HOx
chemistry (Fig. S5). The model tends to underpredict night-time OH concentrations, similarly to previous model com-parisons (Carslaw et al., 2001; Ren et al., 2006; Pugh et al., 2010). On average, nighttime (22:00–06:00 local time) modeled OH concentrations are ∼2.5×10⁵mol cm−3 be-low those observed (∼60 % difference). As the model only incorporates α-pinene (for all monoterpenes) and isoprene, the absence of OH-producing ozonolysis reactions with other VOCs likely contributes to this nighttime discrepancy. These reactions have been shown to produce up to ∼64–72 % of nighttime OH in rural environments (Bey et al., 1997; Geyer
et al., 2003b). Daytime concentrations are also generally un-derpredicted, especially during the late morning, when the measured OH concentration peaks. Despite the observed dif-ference in the two profiles, only two measured points (11:00, 19:00) fail to capture modeled concentrations within their 68 % confidence intervals. A linear regression of measured versus modeled OH concentrations highlights the ability of the model to capture the diel trend of OH concentrations (r2∼0.82) (Fig. S6).
While modeling studies have generally found better per-formance for HO2than for OH, many models involving HOx
cycling in forested environments tend to underestimate HO2
levels (Lelieveld et al., 2008; Pugh et al., 2010; Stavrakou et al., 2010). Interferences involved in the operation of the IU-FAGE instrument can lead to conversion of isoprene-derived peroxy radicals into HO2, resulting in a positive artifact
(Fuchs et al., 2011). Tests indicate that∼90 % of isoprene-based hydroxyalkylperoxy radicals are converted into HO2
in the sampling cell through reaction with NO and subse-quent decomposition (Griffith et al., 2013). As a result, IU-FAGE measurements represent both ambient HO2and a
frac-tion of isoprene peroxy radicals chemically converted to HO2
within the instrument itself. Griffith et al. (2013) noted that HO2concentrations measured during CABINEX are similar
to previously reported concentrations of HO2+RO2(Mihele
and Hastie, 2003). To account for this, simulated isoprene-peroxy radical concentrations were added to simulated HO2
concentrations when performing a regression analysis, and the discussion of the agreement between measurements and model output focuses on simulated HO2+isoprene RO2
rather than simply HO2.
While the model results successfully represent the over-all diel HO2 profile and show good agreement at night,
modeled concentrations of HO2+isoprene RO2
overesti-mate measured concentrations midday by about 30 %, sug-gesting either a missing isoprene RO2 loss mechanism, a
HO2 loss mechanism, or a combination of both.
Neverthe-less, good agreement is observed between measured and modeled concentrations with and without the addition of isoprene RO2 (r2=0.94, slope=0.68 with RO2, r2=0.9,
slope=1.2 without). The observation that adding isoprene RO2improves the coefficient of determination supports the
notion of an isoprene-derived interference (Fig. S6). Ulti-mately, the agreement observed between measured and mod-eled HOx concentrations relative to previously published
atmospheric chemistry models supports the validity of the modeling process.
3 Results and discussion
3.1 Nitrate radical concentrations
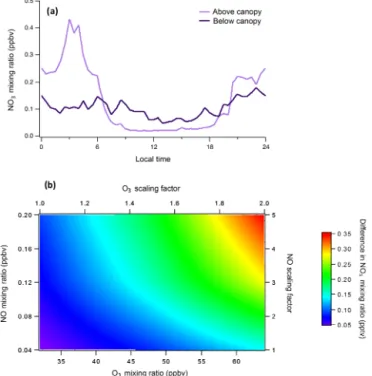
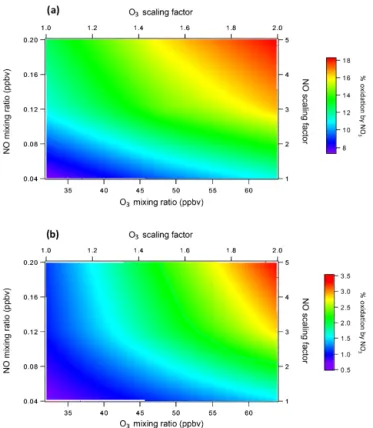
trans-Figure 1. (a)Modeled NO3mixing ratios (pptv) above and below the canopy.(b)Sensitivity of the above–below-canopy difference in midday (11:00–15:00) NO3mixing ratios to changes in O3and NO concentrations. Positive values indicate larger NO3 mixing ratios below the canopy. The term “scaling factor” specifies changes to the diurnal profiles of O3and NO, while “mixing ratios” refer to the resulting average mixing ratios of these species between 11:00 and 15:00.
port to be dominant influences on NOxmixing ratios (Seok
et al., 2013). This ultimately leads to low NO2 (< 1 ppbv)
(Fig. S3) and correspondingly low predicted NO3
concen-trations (< 1 pptv) (Fig. 1a), despite a relatively high ratio of NO2 to NO (median∼12.3). Mixing ratios under 1 pptv
agree well with previous results from Mogensen et al. (2015) in a boreal forest setting and Ayres et al. (2015) in rural Al-abama. While this concentration is much lower than previ-ous nighttime observations in polluted urban environments (Brown et al., 2011), model results have shown that NO3can
dominate the total nighttime oxidative strength (defined as reactivity multiplied by concentration) of a forest environ-ment, even at concentrations of less than 1 pptv (Mogensen et al., 2015).
The above-canopy ambient NO3 profile also agrees well
with modeled NO3concentrations at the same site for
con-ditions in 2008 (Pratt et al., 2012). The model of Pratt et al. (2012) includes more BVOCs but less detail in terms of subsequent oxidation chemistry, and the results do not ex-tend below the canopy, preventing a comparison. At night, NO3 concentrations are enhanced above the canopy
com-pared to below, largely due to larger NO2 concentrations
measured above the canopy during that period. During the day this trend reverses, and mixing ratios are on average 3
times as large below the canopy as above (0.07 pptv below and 0.023 pptv above). As NO2 concentrations were
rela-tively similar in both locations during the day and O3 was
elevated above the canopy, this observation points to a sub-stantial difference in NO3loss rates in the two locations. The
effect of NO3 photolysis specifically is highlighted by the
observation of a much stronger diel trend in concentrations above the canopy than below.
The rural nature of the UMBS site prevents large NO3
mixing ratios, so in order to test the response of this envi-ronment to increased background pollution, we performed a simple sensitivity analysis wherein the diurnal profiles of O3and NO were scaled from their original values up to
fac-tors of 2 and 5, respectively. In addition, the constraints on OH, HO2, and NO2were removed, in order to allow accurate
modeling of both HOx concentrations and the NO-to-NO2
ratio. The most polluted case studied, where O3mixing ratios
are doubled and NO mixing ratios are multiplied by a factor of 5, produces a maximum NOx mixing ratio of∼10 ppb
and is meant to represent a hypothetical suburban area ide-ally suited for NO3formation (Fig. S7). In this most extreme
case, NO3concentrations increase by factors of 10 to 12
rel-ative to the conditions observed during CABINEX, result-ing in a 0.4 pptv difference on average between the above-canopy and below-above-canopy environments from 11:00 to 15:00 (Fig. 1b). The implications of this increased difference are investigated subsequently.
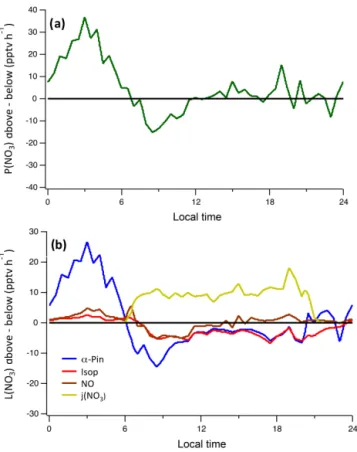
Production and loss rates of NO3were analyzed to
deter-mine the specific reason(s) for elevated below-canopy con-centrations during the day under the CABINEX conditions. From 06:00 to 12:00, the modeled enhancement of NO3
below the canopy is primarily the result of faster produc-tion (due to higher NO2mixing ratios below than above the
canopy), as loss rates are similar (Fig. 2). However, from 12:00 to 18:00, production rates are similar in both environ-ments, and loss rates from NO and VOCs are higher canopy than above-canopy, indicating that reduced below-canopy NO3photolysis is the primary contributor to the
ob-servation of elevated below-canopy NO3concentrations
dur-ing the afternoon. 3.2 BVOC oxidation
Numerous studies have investigated NO3 oxidation of
BVOCs and highlighted that such oxidation is especially im-portant at night (Golz et al., 2001; Brown et al., 2005, 2011; Stutz et al., 2010; Brown and Stutz, 2012). Certain classes of BVOCs also show appreciable daytime oxidation rates by NO3 (Geyer et al., 2003a; Brown et al., 2005). The
predic-tion of elevated daytime NO3concentrations below the forest
canopy implies an increased rate of BVOC oxidation in that environment. Oxidation rates (and fractional contributions of the total) by each oxidant are determined by
Figure 2. (a) Difference in the NO3 production rate (P(NO3)) above and below the forest canopy. (b) Difference in individual NO3loss rates (L(NO3)) from photolysis, reaction with NO, oxi-dation of isoprene, and oxioxi-dation ofα-pinene above and below the forest canopy.
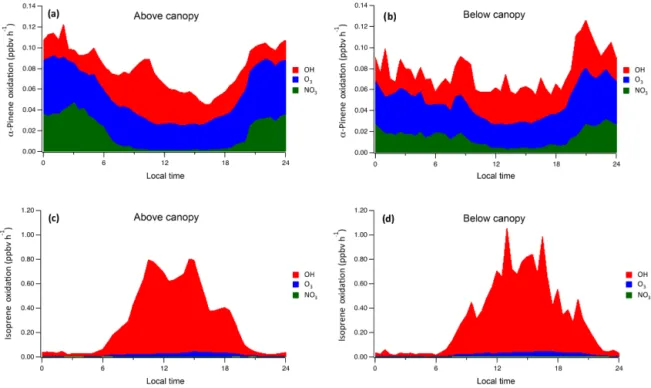
Ambient CABINEX results (Figs. 3 and 4) show that overall rates ofα-pinene oxidation above and below the canopy are similar (∼0.06–0.1 ppbv h−1), while the fractional plots
in-dicate that, in both cases, O3is the most consistent oxidant,
contributing over 40 % of total oxidation. Hydroxyl radical oxidation reaches maximum contributions of 67 % above the canopy and 62 % below the canopy near midday (Fig. 4). The NO3 oxidation rates largely reflect the NO3 concentration
profile, as α-pinene concentrations are relatively consistent throughout the 24 h period, with above-canopy rates display-ing more diel variation than those below, due to the substan-tial effect of NO3photolysis. Oxidation by NO3contributes
17 % of the total above the canopy on average and 18 % be-low. This similarity in averages is due to the fact that day-time NO3concentrations are elevated below the canopy
rela-tive to above, whereas at night the opposite occurs. The most substantial difference between the two environments occurs from around 08:00 to 20:00, as NO3contributes on average
only 4 % of totalα-pinene oxidation above the canopy, but as much as 12 % below.
Increasing the concentration of background pollutants to simulate a suburban environment raises the fractional amount of NO3oxidation to as high as 32 % during the day (08:00–
20:00) below the canopy, similar to the model results of Fuentes et al. (2007) for a forest with 40–60 ppbv of O3and
maximum NOxmixing ratios of 6–8 ppbv. Even during
mid-day when NO3concentrations are minimized, the
contribu-tion of NO3to totalα-pinene oxidation below the canopy is
∼18 % in this simulated polluted environment (Fig. 5). Isoprene oxidation is only briefly discussed, as the to-tal rates and fractional oxidant contributions are similar above and below the canopy (Figs. 3 and 4). In both lo-cations, OH dominates isoprene oxidation, especially dur-ing the day when oxidation rates are most substantial. Peak below-canopy oxidation rates are generally smaller than those above, as expected, largely due to increased photolytic activity and OH concentrations above the canopy. Even in the highly polluted conditions, NO3oxidation accounts for only
∼3 % of the total near midday (Fig. 5). 3.3 Gas-phase RONO2concentrations
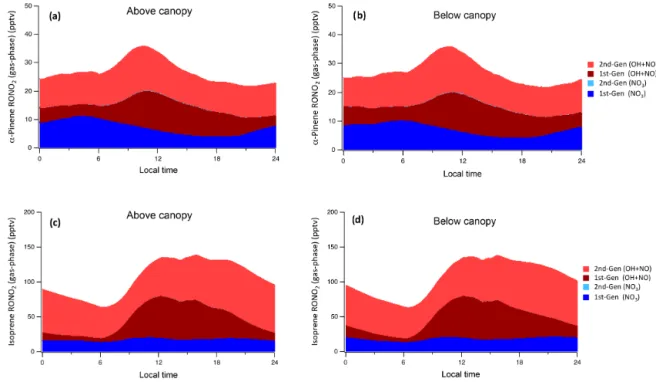
The diurnal profile of the sum of isoprene- andα -pinene-derived gas-phase RONO2is shown in Fig. 6 for both
above-and below-canopy environments. Isoprene is the major pre-cursor of total RONO2 (∼70–85 %), following from its
larger mixing ratios and much faster daytime oxidation rates than α-pinene. This is in agreement with other isoprene-dominated environments (Pratt et al., 2012; Fisher et al., 2016; Romer et al., 2016). First-generation nitrates pro-duced from NO3oxidation of both BVOCs have much larger
concentrations than the comparable second-generation prod-ucts, which have virtually negligible concentrations, imply-ing that further oxidation tends to remove the nitrate func-tional group, after which point further reaction with NO or NO3and regeneration of the nitrate group is unlikely, as
sug-gested by Lee et al. (2014) and Xiong et al. (2016). As a result, despite the fact that OH only contributes around 20 % of nighttimeα-pinene oxidation, RONO2 products formed
from OH oxidation ofα-pinene constitute over half of night-timeα-pinene RONO2concentrations.
The efficient mixing process parameterized within the model results in very similar overall concentrations above and below the canopy (within 9 %), despite the modeled dif-ferences in BVOC oxidation. While this appears to imply that the canopy exerts little influence on RONO2
produc-tion, midday (11:00–15:00) above-canopy mixing ratios of NO3-derived RONO2 products formed from α-pinene and
isoprene are 15.2 and 33.7 % larger on average than if the mixing process is turned off and the dilution rate is reduced by one-half (to partially account for the lack of oxidation product transport from below the canopy). Therefore, near midday, the below-canopy environment appears to act as a source of NO3-derived nitrates above the canopy, a finding
that is further explored subsequently. We use the term “NO3
Figure 3.Modeled diurnal oxidation rates of(a)α-pinene above canopy,(b)α-pinene below canopy,(c)isoprene above canopy, and(d) iso-prene below canopy by OH, O3, and NO3.
Figure 5.Sensitivity of average fractional oxidation of(a)α-pinene and (b)isoprene by NO3below the canopy from 11:00 to 15:00 to changes in O3 and NO concentrations. The term “scaling fac-tor” specifies changes to the diurnal profiles of O3and NO, while “mixing ratios” refer to the resulting average mixing ratios of these species between 11:00 and 15:00.
Overall RONO2 accounts for ∼7–12 % of total NOy in
both environments, which, while somewhat smaller than observations in the eastern US by Perring et al. (2009) (∼18 %), nevertheless suggests that RONO2 fate is highly
relevant to overall NOx cycling within this environment.
However, inconsistencies between studies of RONO2
chem-istry underscore the need for continued study of the oxidation pathways involved in RONO2production and agreement
be-tween published mechanisms and laboratory results. For in-stance, despite our changes to the chemical mechanism, our MCM-based model predicts over twice as much total gas-phase RONO2as the model of Pratt et al. (2012).
Further-more, second-generation products constitute 50–60 % of to-tal RONO2 (predominantly from the OH–NO pathway) in
our model, while models based on laboratory yields, such as that of Pratt et al. (2012), predict almost entirely first-generation products. Observations of isoprene nitrates sug-gest second-generation products comprise somewhere be-tween 20 and 50 % of the total (Fisher et al., 2016).
In a rural area where RONO2formation is limited,
mis-characterizing RONO2 composition may have a
negligi-ble effect on predicting subsequent aspects of atmospheric chemistry; however, in more polluted areas both local and
regional O3 and SOA formation rates may be significantly
affected by such an error, as NOxreservoirs such as RONO2
can limit O3 production, and first- and second-generation
RONO2products are thought to have different deposition
ve-locities, saturation vapor pressures, and tendencies to release NOxupon oxidation (Lee et al., 2014; Fisher et al., 2016).
3.4 RONO2production, loss, and net transport
While modeled RONO2 mixing ratios above and below
the canopy are similar due to efficient daytime mixing within the forest canopy, the physical and chemical differ-ences described previously suggest that production and loss rates differ between locations. The diurnal profiles of simu-lated RONO2production rates above and below the canopy
are shown in Fig. 7. The total midday production rate of RONO2 above the canopy (∼100 pptv) and the dominance
of isoprene-derived RONO2production agree with
summer-time results obtained for the southeastern US in another de-ciduous forest (Romer et al., 2016).
In both locations, a large increase in production rates oc-curs around 06:00, corresponding to the rapid increase in OH, NO, and isoprene concentrations. Production of RONO2
through NO3oxidation is faster below the canopy than above
during the day; however, the difference, factors of 2.75 for
α-pinene and 1.35 for isoprene, is slightly lower than the
difference in oxidation rates. Following initial oxidation by NO3, the produced RO2must react with HO2or RO2in
or-der to form a stable nitrate, both of which have higher con-centrations above the canopy than below (production through NO reaction after NO3oxidation is negligible). As a result,
while daytime oxidation by NO3is much more rapid below
the canopy, the differences in mixing ratios of species in-volved in secondary reactions slightly offset the difference in NO3concentrations. Overall, NO3accounts for∼10 % of
total RONO2production above the canopy and 17 % below
near midday (11:00–15:00).
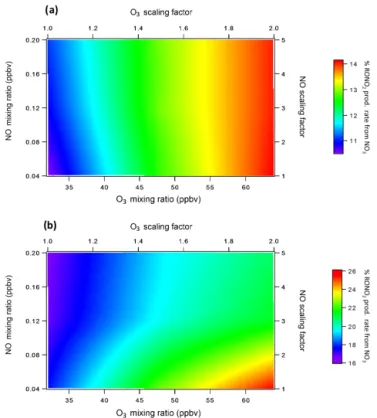
In the more polluted environment, the fraction of to-tal daytime RONO2 produced by NO3 oxidation increases
to 14 % above the canopy and 20–25 % below the canopy (Fig. 8). Therefore, while NO3chemistry becomes more
rel-evant during the day under more polluted conditions, the rela-tive difference between above- and below-canopy production through NO3oxidation (6–11 %) stays relatively constant.
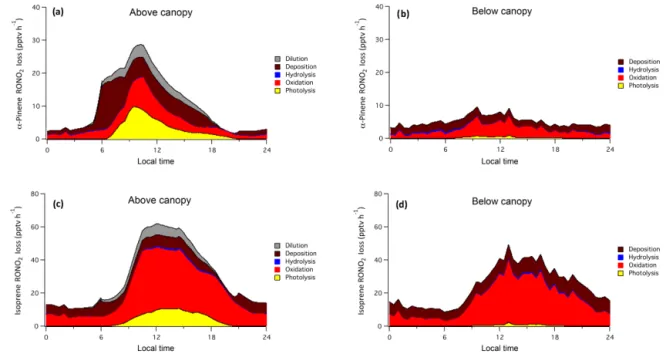
Loss rates of both α-pinene and isoprene RONO2 are
shown in Fig. 9. On average, photolysis and gas-phase oxida-tion, processes that tend to release NOx, account for
approx-imately half ofα-pinene RONO2loss both above and below
Figure 6. Modeled gas-phase RONO2 concentrations from(a)α-pinene above canopy,(b) α-pinene below canopy, (c)isoprene above canopy, and(d)isoprene below canopy. Species produced from NO3oxidation are blue, while those produced through OH+NO oxidation are red. Darker colors indicate first-generation products; lighter colors indicate second-generation products.
Figure 8.Percent of total daytime gas-phase RONO2 production due to NO3oxidation for varying levels of O3and NO(a)above the canopy and(b)below the canopy. Values represent averages from 11:00 to 15:00.
height) is offset by faster daytime mixing conditions (depo-sition velocities) above than below the canopy.
Modeled hydrolysis accounts for less than 5 % of to-tal RONO2 loss on average, a much smaller amount than
previous estimations (∼30–50 %) based on measurements (Romer et al., 2016) and model predictions (Fisher et al., 2016). However, a few important differences between our model and the assumptions of these previous studies con-tribute to this difference. The observational study by Romer et al. (2016) assumes no loss of RONO2to photolysis, which
the MCM predicts is a substantial loss process for both α -pinene and isoprene nitrates near midday, while the model-ing study of Fisher et al. (2016) assumes all isoprene organic nitrate species hydrolyze at the same rate as tertiary nitrates, likely leading to an overprediction of hydrolysis rates for a given fraction of RONO2 within the aerosol phase in their
model.
While the difference between our results and previous measurements of Romer et al. (2016) would be reduced somewhat if photolysis were included in their analysis, their measurements nevertheless suggest a large fraction of RONO2 is lost to hydrolysis even in low-light conditions
(06:00–07:00), implying an underprediction by our model of the fraction of RONO2 mass in the aerosol phase.
Pre-vious studies using the MCM to predict SOA composition have had to reduce gas-particle partitioning coefficients by
factors as high as 500 in order to reproduce observed mass loadings (Johnson et al., 2004, 2006a, b). Essentially this re-duction accounts for particle-phase reactions (not captured by modeling simple semi-volatile partitioning) and particle viscosity that decrease the probability of repartitioning into the gas phase. Decreasing the vapor pressures of all BVOC oxidation products by a factor of 100 increases hydrolysis rates substantially, causing hydrolysis to account for a mini-mum of 40–50 % ofα-pinene RONO2loss above-canopy and
60–70 % below-canopy (Fig. S8). The fraction of isoprene RONO2lost through this mechanism also increases, but only
to a maximum of 10–15 % at night, as only tertiary nitrates undergo hydrolysis. The uncertainty with respect to hydrol-ysis loss rates highlights the importance of more accurately characterizing gas-particle partitioning when quantifying the lifetime and fate of NOxwithin an environment.
As we are focused primarily on highlighting differences between the above- and below-canopy locations rather than precisely determining production and loss rates, this uncer-tainty does not affect our major conclusions regarding the increased relevance of NO3chemistry below the canopy. In
addition, we are primarily focused on daytime conditions, when higher temperatures shift partitioning to the gas phase and reduce overall hydrolysis rates. Nevertheless, future ver-sions of this model will look to improve the characterization of hydrolysis by more accurately describing both hydrolysis rates within the aerosol (when more precise data are avail-able) and more accurately partitioning the suite of BVOC ox-idation products between the gas and particle phases. In ad-dition, the choice ofα-pinene to represent all monoterpenes
can impact these findings due to changes in product distribu-tion that would occur if other monoterpenes were considered. When considering all relevant losses, midday RONO2loss
rates below the canopy are less than one-half of those above the canopy forα-pinene products and are around 66 % of those above the canopy for isoprene products. As daytime production rates of NO3-derived RONO2below the canopy
are larger than those above the canopy, our results suggest possible net transport of NO3-derived products upward from
the below-canopy environment. The net transport of both to-tal RONO2and NO3-derived RONO2is shown in Fig. 10.
While net transport of total RONO2is generally from the
above-canopy environment to the below-canopy environment (downward), in agreement with previous NOyflux
measure-ments at UMBS (Geddes and Murphy, 2014), the below-canopy environment acts as a substantial source of NO3
-derived RONO2above the canopy during the day (∼25 %).
The largest contribution from net transport (∼30 % of the total) occurs around 07:00. Recent modeling work indicates that the mass loading of particulate RONO2 is maximized
around this time in the southeastern US (Pye et al., 2015). As NO3-derived products are known to be major constituents of
Figure 9.Modeled RONO2loss from photolysis (gas phase), oxidation (gas phase), hydrolysis (particle phase), deposition (gas and particle phase), and dilution (gas and particle phase) for(a)α-pinene products above canopy,(b)α-pinene products below canopy,(c)isoprene products above canopy, and(d)isoprene products below canopy.
an underprediction of RONO2SOA mass above the canopy
during the day (Ayres et al., 2015; Xu et al., 2015).
While decreasing the vapor pressures of all oxidation products by a factor of 100 decreases the fraction of RONO2
loss caused by photolysis and OH oxidation, the total con-tribution of net transport to above-canopy NO3-derived
RONO2production is still 14.5 % on average from 06:00 to
18:00 (Fig. S9). Under more polluted conditions, the con-tribution of transport to total production remains substantial (between 7 and 25 % from 11:00 to 15:00), but is highly dependent on the ratio of O3 to NO (Fig. S10). Our
as-sumption of no depositional losses during transport likely leads to an overprediction of the total amount of net trans-port that occurs; however, our model underpredicts concen-trations of MACR+MVK above and below the canopy dur-ing the morndur-ing when mixdur-ing is beginndur-ing (Fig. S1), sug-gesting that losses during transport may be captured in the parameterization of deposition. Such underprediction could also be the result of errors in the chemical mechanism.
Precise determination of the influence of transport on above-canopy NO3-derived RONO2 production requires
more accurate characterization of both hydrolysis losses and deposition during transport than our model can currently achieve. However, our results suggest that NO3-derived
prod-ucts and total RONO2may undergo net transport in opposite
directions. Because of the known relevance of NO3-derived
products to SOA production, this possibility should be the focus of further investigation.
3.5 Secondary organic aerosol production
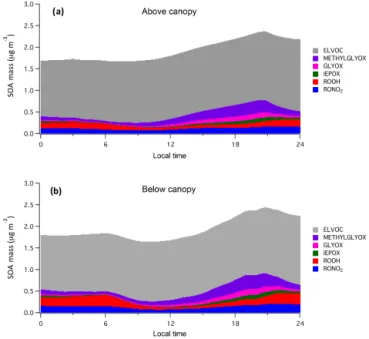
Figure 11 displays the simulated diurnal SOA mass loadings modeled above and below the canopy at UMBS. As with gas-phase RONO2, efficient daytime mixing results in a
rel-atively small difference in total SOA mass loading between locations, with an average difference of 6 % at night (21:00– 06:00) (higher mass loadings below-canopy) and 7 % near midday (11:00–15:00) (higher mass loadings above-canopy). The similarity above and below the canopy agrees with the results of the 1-D FORCAsT model (Ashworth et al., 2015), which predicts little change in aerosol mass loadings within 100 m from the ground.
To our knowledge, the composition of ambient aerosol at UMBS has only been characterized once before. Aerosol mass spectrometer measurements from 2001 indicate that OA mass loadings varied from∼0.5 to 2 µg m−3, with val-ues reaching 3 µg m−3 during peak pollution events (Delia,
2004), in relatively good qualitative agreement with our re-sults. However, more recent data from CABINEX 2009 in-dicate that water-soluble organic mass loadings were around 4 µg m−3 on average (VanReken et al., 2015). As a result,
while our model predicts more aerosol mass than recent re-sults from the FORCAsT model (Ashworth et al., 2015), total SOA mass loadings may still be somewhat underpredicted.
In terms of SOA composition, ELVOCs comprise a con-sistent majority of total SOA in the model (∼77 % above-canopy and∼72 % below-canopy), which follows from the nearly constant rate of O3oxidation ofα-pinene. The
Figure 10. (a)Net transport of total gas-phase RONO2above the canopy. Positive indicates transport from the below-canopy envi-ronment; negative indicates transport to the below-canopy environ-ment.(b)Same as(a), but for RONO2produced solely from NO3 oxidation of BVOCs.(c)Percent of total production of NO3-derived RONO2species above the canopy resulting from net transport from the below-canopy environment. This figure implies downward net transport of OH-derived RONO2species and upward net transport of NO3-derived RONO2species.
find that SOA composition is almost entirely composed of ELVOC species at low total SOA mass loadings (Ehn et al., 2014). However, as the molar yield of ELVOCs varies substantially based on monoterpene studied (Jokinen et al., 2015), and as ELVOCs are not included in major chemical mechanisms such as the MCM, the modeled relevance of this type of oxidation product to SOA mass loadings
sug-Figure 11.Total modeled SOA(a)above-canopy and(b) below-canopy characterized by fractional contributions from semi-volatile organic nitrates (RONO2) and peroxides (ROOH), isoprene epox-ides (IEPOX), glyoxal (GLYOX), methylglyoxal (METHYL-GLYOX), and ELVOCs.
gests future studies should look to improve characterization of ELVOC formation processes and update published mech-anisms.
Similar amounts of SOA are produced by reactive sur-face uptake of isoprene products (IEPOX, GLYOX, and METHYLGLYOX) and semi-volatile oxidation product par-titioning (ROOH and RONO2). The average mass loadings of
isoprene epoxydiols (∼0 µg m−3), glyoxal (0–0.1 µg m−3),
and methylglyoxal (0.1–0.25 µg m−3) are comparable to
modeled mass loadings of these products in northern Michi-gan by Li et al. (2015). The composition of semi-volatile SOA is split between hydroperoxides (ROOH), predomi-nately formed by OH oxidation followed by reaction with HO2, and RONO2. Organic nitrates constitute 6 % of total
SOA above the canopy and 7 % below the canopy, in good agreement with results in both the southeastern US (3–8 %) (B. H. Lee et al., 2016) and a Colorado front-range forest (6– 20 %) (Fry et al., 2013). Other oxidation products (alcohols, peroxyacetyl nitrates, etc.) contribute a negligible amount of aerosol.
Ultimately, SOA mass loadings above and below the canopy are within 0.5 µg m−3of each other, and this
simi-larity is caused by efficient mixing and different influences on aerosol production partially offsetting each other. For in-stance, lower temperatures below the canopy cause increased partitioning of semi-volatile oxidation products (ROOH and RONO2)to the particle phase relative to above the canopy,
below the canopy than above (when temperature differences are maximized). However, as the majority of semi-volatile products with volatilities low enough to partition apprecia-bly to the aerosol phase contain peroxide functional groups, even in the case of RONO2, lower HOxconcentrations below
the canopy partially offset the effect of temperature. This is highlighted by the fact that if temperatures above and below the canopy are assumed to be the same, more SOA mass is produced above the canopy than below (Fig. S11).
In addition, ELVOC products have vapor pressures low enough that virtually all of their mass exists within the par-ticle phase, causing temperature to have little to no effect on their partitioning between gas and aerosol. Therefore, higher rates of O3oxidation ofα-pinene above the canopy further
offset the effect of increased partitioning of semi-volatile products below the canopy. Isoprene epoxide, glyoxal, and methylglyoxal mass loadings are only slightly larger below the canopy than above for the majority of the day (within 5–10 % of each other) because of lower rates of aerosol de-position and similar gas-phase concentrations in each loca-tion (due to mixing), despite the fact that gas-phase epoxide production is more rapid above the canopy.
Overall, NO3-derived products contribute little to total
RONO2SOA mass, causing production of RONO2SOA to
be driven primarily by the OH+NO pathway, even at night (Fig. S12). The small mass loading of NO3-derived products
is primarily the result of our assumption that all monoter-penes areα-pinene. As NO3oxidation ofα-pinene produces
first-generation nitrates, which have relatively high volatili-ties, almost exclusively (Berkemeier et al., 2016), the SOA mass yield of NO3 oxidation is relatively small (Table 1).
However, previous modeling with a variety of monoterpenes suggests as much as 0.2–0.4 µg m−3 of SOA is produced
from monoterpene nitrates in northern Michigan (Pye et al., 2015), in agreement with the much higher mass yields of other monoterpenes such asβ-pinene and limonene. Adding this mass to the total amount of SOA would suggest RONO2
contribute 16–24 % of total SOA mass, on the upper end of estimates from previous measurements (Fry et al., 2013; B. H. Lee et al., 2016).
Assuming that this amount of monoterpene nitrate SOA mass is present, and assuming that the fraction of RONO2
mass derived from NO3 oxidation is the same as we have
modeled forα-pinene (∼45–80 %) (Fig. S13), NO3
oxida-tion could be expected to contribute around 4–12 % of total SOA mass in this environment. This contribution is reason-able, as A. K. Y. Lee et al. (2016) recently found that RONO2
produced from NO3oxidation contribute around 22–33 % of
biogenic SOA in a remote coniferous forest in Canada. The sensitivity of RONO2SOA and SOA from NO3-derived
ox-idation products to background pollutant levels is shown in Fig. S14. Both total RONO2SOA and NO3-derived SOA
in-crease by a factor of 3–4 under inin-creased pollutant loadings. Interestingly, increases in NO3-derived RONO2SOA mass
are almost solely dependent upon increased O3mixing ratios,
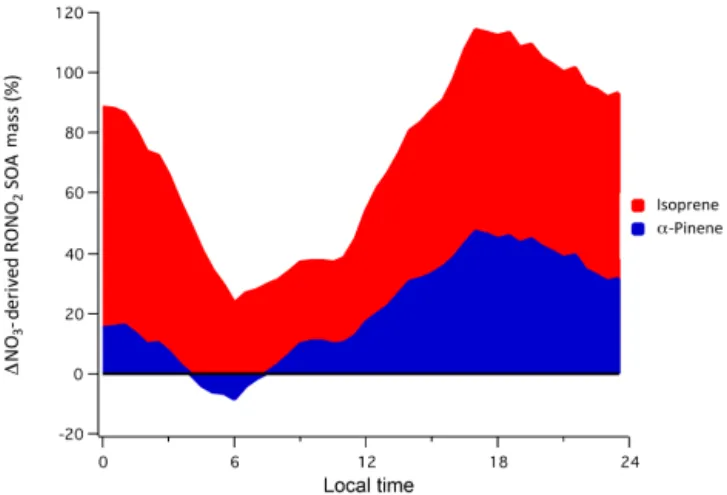
Figure 12. Diurnal profile of the net change in NO3-derived RONO2SOA above the canopy as a result of including transport between the above- and below-canopy environments.
implying that NO3SOA production is essentially O3-limited
for the conditions modeled in the sensitivity analysis. The preceding analysis serves as an indicator of the po-tential relevance of NO3 to total aerosol mass in this
loca-tion; however, our model results also suggest the possibil-ity of net transport of NO3-derived RONO2from the
below-canopy environment through the below-canopy, potentially result-ing in more NO3-derived RONO2 SOA mass than would
be assumed if transport were neglected. Indeed, similarly to gas-phase RONO2concentrations, including in-canopy
mix-ing results in a substantial increase in both isoprene andα -pinene NO3-derived OA above the canopy. This is shown in
Fig. 12, where positive values indicate increased amounts of SOA mass above the canopy when mixing is included within the model. Ultimately our results suggest a 20–50 % increase in NO3-derivedα-pinene RONO2mass in the
after-noon, which can be thought of as a surrogate for monoter-pene nitrate mass, and an even larger increase from isoprene products. While we assume no loss of products during trans-port, which would reduce this effect, these results highlight the potential relevance of the below-canopy environment to above-canopy SOA mass. Because the contribution of NO3
-derived RONO2to total SOA is predicted to be high in areas
such as the southeastern US (Ayres et al., 2015), the poten-tial influence of net transport of NO3-derived products and
the associated effect on SOA mass warrants further study.
4 Conclusions
A detailed 0-D model was used to investigateα-pinene and isoprene oxidation chemistry and SOA production above and below a forest canopy. Specific focus was placed on the con-tribution of NO3to BVOC processes, as shade provided by
the canopy was assumed to reduce NO3 photolysis rates.