ACPD
13, 4601–4635, 2013Uncertainties in modelling Mt. Pinatubo eruption
F. Arfeuille et al.
Title Page
Abstract Introduction
Conclusions References
Tables Figures
◭ ◮
◭ ◮
Back Close
Full Screen / Esc
Printer-friendly Version Interactive Discussion
Discussion
P
a
per
|
Dis
cussion
P
a
per
|
Discussion
P
a
per
|
Discussio
n
P
a
per
|
Atmos. Chem. Phys. Discuss., 13, 4601–4635, 2013 www.atmos-chem-phys-discuss.net/13/4601/2013/ doi:10.5194/acpd-13-4601-2013
© Author(s) 2013. CC Attribution 3.0 License.
Atmospheric Chemistry and Physics
Open Access
Discussions
Geoscientiic Geoscientiic
Geoscientiic Geoscientiic
This discussion paper is/has been under review for the journal Atmospheric Chemistry and Physics (ACP). Please refer to the corresponding final paper in ACP if available.
Uncertainties in modelling the
stratospheric warming following Mt.
Pinatubo eruption
F. Arfeuille1,2, B. P. Luo1, P. Heckendorn1, D. Weisenstein3, J. X. Sheng1, E. Rozanov1,4, M. Schraner5, S. Br ¨onnimann2, L. W. Thomason6, and T. Peter1
1
Institute for Atmospheric and Climate Science ETH Zurich, Zurich, Switzerland
2
Oeschger Center for Climate Change Research and Institute of Geography, University of Bern, Bern, Switzerland
3
School of Engineering and Applied Science, Harvard University, Cambridge, MA, USA
4
Physical-Meteorological Observatory/World Radiation Center, Davos, Switzerland
5
Federal office of Meteorology and Climatology, Meteoswiss, Z ¨urich, Switzerland
6
NASA Langley Research Center, Hampton, Virginia, USA
Received: 10 December 2012 – Accepted: 1 February 2013 – Published: 18 February 2013
Correspondence to: F. Arfeuille ([email protected])
ACPD
13, 4601–4635, 2013Uncertainties in modelling Mt. Pinatubo eruption
F. Arfeuille et al.
Title Page
Abstract Introduction
Conclusions References
Tables Figures
◭ ◮
◭ ◮
Back Close
Full Screen / Esc
Printer-friendly Version Interactive Discussion
Discussion
P
a
per
|
Dis
cussion
P
a
per
|
Discussion
P
a
per
|
Discussio
n
P
a
per
|
Abstract
In terms of atmospheric impact, the volcanic eruption of Mt. Pinatubo (1991) is the best characterized large eruption on record. We investigate here the stratospheric warming following the Pinatubo eruption derived from SAGE II extinction data includ-ing most recent improvements in the processinclud-ing algorithm and a data fillinclud-ing procedure 5
in the opacity-induced “gap” regions. From these data, which cover wavelengths of 1.024 micrometer and shorter, we derived aerosol size distributions which properly
re-produce extinction coefficients at much longer wavelength. This provides a good basis
for calculating the absorption of terrestrial infrared radiation and the resulting strato-spheric heating. However, we also show that the use of this dataset in the global 10
chemistry-climate model (CCM) SOCOL leads to exaggerated aerosol-induced strato-spheric heating compared to observations, even partly larger than the already too high values found by many models in recent general circulation model (GCM) and CCM intercomparisons. This suggests that the overestimation of the stratospheric warm-ing after the Pinatubo eruption arises from deficiencies in the model radiation codes 15
rather than an insufficient observational data basis. Conversely, our approach reduces
the infrared absorption in the tropical tropopause region, in better agreement with the post-volcanic temperature record at these altitudes.
1 Introduction
The most recent large tropical volcanic eruption was that of Mt. Pinatubo in June 1991 20
in the Philippines (15◦N). Unlike earlier major volcanic eruptions of the 20th century,
Mt. Pinatubo has been relatively well characterised by observations. Several satellite, balloon-borne and ground-based measurements are available during this period (Bluth et al., 1992; Labitzke and McCormick, 1992; McCormick, 1992; Stowe et al., 1992; Thomason, 1992; Minnis et al., 1993; Antu ˜na et al., 2002). However, the peak of the 25
ACPD
13, 4601–4635, 2013Uncertainties in modelling Mt. Pinatubo eruption
F. Arfeuille et al.
Title Page
Abstract Introduction
Conclusions References
Tables Figures
◭ ◮
◭ ◮
Back Close
Full Screen / Esc
Printer-friendly Version Interactive Discussion
Discussion
P
a
per
|
Dis
cussion
P
a
per
|
Discussion
P
a
per
|
Discussio
n
P
a
per
|
best established in the Northern Hemisphere and less dense in the tropics and
South-ern Hemisphere, where a large part of the emitted SO2and resulting sulfate aerosols
was transported. An additional problem was that for some instruments measuring in the shortwave, the lower stratosphere became opaque. For instance during the first year after the Pinatubo eruption SAGE II measured only above about 23 km altitude 5
at wavelengths of 1.024 µm and shorter. To cope with the regions of missing data, SPARC (2006) provides a “gap-filled” data set spanning the period 1979–2004 us-ing SAGE data amended by measurements from lidar ground stations. This SAGE II gap-filled dataset provides the most complete and accurate (uncertainty around 10 % outside the gap) global optical characterization of the eruption, even if the quality of 10
this dataset in the most perturbed periods is limited, in particular in the tropics with
uncertainties in the order of 50 % in the extinction coefficients in the gap region.
There have been several earlier attempts to create a consistent global stratospheric aerosol dataset of the Pinatubo eruption (e.g. Sato et al., 1993; Stenchikov et al., 1998) for climate models. The dataset of Stenchikov et al. (1998) provides spectral extinction 15
coefficients and directly calculated heating rates for modeling studies, while the Sato
et al. (1993) “GISS” dataset consists of optical depth data for 0.5 µm wavelength and
effective radii in four different altitude ranges and 24 latitude bands derived from SAGE
II data. However, these two datasets use outdated versions of the SAGE retrieval al-gorithm and a very coarse gap-filling procedure (assuming a constant extinction co-20
efficient below 24 km altitude). Furthermore, no systematic comparison with extinction
coefficients from HALOE at 3.46 µm and 5.26 µm (Russell et al., 1993; Hervig et al.,
1995) or ISAMS at 12.1 µm (Lambert et al., 1997) was performed to verify the
applica-bility for extinction coefficients in the terrestrial IR, which is a requirement for climate
simulations. Extinction coefficients of HALOE at 3.46 µm and 5.26 µm are of good
qual-25
ity during the period affected by the Pinatubo eruption (Thomason et al., 2012). ISAMS
extinction coefficient uncertainties at 12.1 µm for the equator are in the order of 50 % at
70 hPa and less than 20 % at 45 hPa and above, while for 40◦N, uncertainties are less
ACPD
13, 4601–4635, 2013Uncertainties in modelling Mt. Pinatubo eruption
F. Arfeuille et al.
Title Page
Abstract Introduction
Conclusions References
Tables Figures
◭ ◮
◭ ◮
Back Close
Full Screen / Esc
Printer-friendly Version Interactive Discussion
Discussion
P
a
per
|
Dis
cussion
P
a
per
|
Discussion
P
a
per
|
Discussio
n
P
a
per
|
The accuracy of the solar and infrared extinction coefficients in stratospheric aerosol
datasets is an important point because large stratospheric volcanic eruptions in the tropics represent major external forcings to the climate system, and many uncertain-ties remain in their modeling by CCMs/GCMs. Simulations exhibit a large range of responses due to model deficiencies and/or uncertainties in the volcanic forcing. Many 5
GCMs/CCMs overestimate the stratospheric warming after volcanic eruptions and an
attribution of this artifact remains difficult because of the large range of optical forcings
obtained with different approaches and datasets (SPARC-CCMVal, 2010; Gettelman
et al., 2010; Lanzante and Free, 2007).
As noted by Morgenstern (2010), different approaches have been followed among
10
the CCMval-2 (SPARC-CCMVal, 2010) models to represent the volcanic forcing. Some models (CAM3.5, GEOSCOM, LMDZrepro, UMSLIMCAT and UMUKCA-UCAM) do not
at all model the heating by the aerosol, while ULAQ REF-B1 uses direct SO2injections.
A third group derives heating rates consistent with prescribed SAD (Surface Area Den-sity) data (CMAM and WACCM) or use the GISS (Sato et al., 1993) data (AMTRAC3, 15
CCSRNIES, MRI, UMETRAC, UMUKCA-METO). These two methods require assump-tions on the size distribution, notably through a fixed distribution width. Some models also use directly the precalculated heating rates from Stenchikov et al. (1998) which are based partly on the Sato et al. (1993) extinction data (E39CA and EMAC). Finally the SOCOL used in CCMval-2 a SAGE II and GISS derived dataset. All these methods 20
produce large differences in the volcanic aerosol optical properties, making it difficult
to compare these models against each other.
2 Methods
The most elaborated gap-filled SAGE II 1.024 µm extinction coefficient record is
de-scribed by SPARC (2006) (hereafter called SAGE ASAP). The gaps in the SAGE II 25
ACPD
13, 4601–4635, 2013Uncertainties in modelling Mt. Pinatubo eruption
F. Arfeuille et al.
Title Page
Abstract Introduction
Conclusions References
Tables Figures
◭ ◮
◭ ◮
Back Close
Full Screen / Esc
Printer-friendly Version Interactive Discussion
Discussion
P
a
per
|
Dis
cussion
P
a
per
|
Discussion
P
a
per
|
Discussio
n
P
a
per
|
in Cuba, at Hampton, Virginia (USA) and with backscatter sonde measurements from Lauder, New Zealand. The lidar measurements have been converted to 1.024 µm (SAGE II wavelength) (Antu ˜na et al., 2003). The main aerosol cloud was frequently
over Mauna Loa (19.54◦N) and Camag ¨uey (21.4◦N) and these values are taken for the
tropical region. However, due to the fact that the main aerosol cloud was not always 5
located above the two lidar stations, an erroneous seasonality of the aerosol amount
might be present in the compiled dataset (SPARC, 2006). The differences between the
SAGE V6.0 version used by SPARC (2006) and earlier versions as used by Stenchikov et al. (1998) and Sato et al. (1993) are described in Sect. 3.
To retrieve extinction coefficients (subsequently referred to as “extinctions”) in the
10
whole spectral range and subsequently model the stratospheric warming response, the particle size distribution has to be known. During quiescent times the size distribution of stratospheric aerosol is relatively well captured by a simple unimodal lognormal distribution (Wurl et al., 2010). However, after volcanic eruptions a second (and often third) mode are observed, consequently a bimodal (or trimodal) lognormal distribution 15
fits the data better (Deshler et al., 1992). For simplicity and because of patchiness of the data many studies nevertheless use unimodal lognormal distributions (e.g. Kinnison et al., 1994; Russell et al., 1996; Stenchikov et al., 1998; SPARC, 2006). This might be legitimate if one of these modes dominates in terms of surface area density and radiative properties.
20
In this study we compare four methods to retrieve spectrally resolved optical
proper-ties: first, a method with varying effective radii, distribution widths and number densities
(called SAGE 4λhereafter) to find the best fit to the four wavelengths of SAGE ASAP
extinction measurements; second, the method by Stenchikov et al. (1998, called ST98 hereafter) using an older version of the SAGE II data set (from the V5 series); third, 25
a method using an aerosol model (AER-2D, Weisenstein et al. (1997)), where the aerosol size distributions depend directly on microphysical processes and boundary
conditions such as SO2 injection mass and location of injection (7 MT of sulfur
ACPD
13, 4601–4635, 2013Uncertainties in modelling Mt. Pinatubo eruption
F. Arfeuille et al.
Title Page
Abstract Introduction
Conclusions References
Tables Figures
◭ ◮
◭ ◮
Back Close
Full Screen / Esc
Printer-friendly Version Interactive Discussion
Discussion
P
a
per
|
Dis
cussion
P
a
per
|
Discussion
P
a
per
|
Discussio
n
P
a
per
|
described by Schraner et al. (2008), using SAGE ASAP and deriving the surface area
densities and effective radii based on a Principal Component Analysis using four
wave-lengths of SAGE II (Thomason et al., 1997b) and assuming a fixed distribution width.
Schraner et al. (2008) prescribed the distribution widthσ to 1.8 (named SAGE 1.8
be-low), which is a mean typical value for the last few decades. However, after volcanic 5
eruptionsσ can differ substantially from this value. In this study we repeated the
cal-culation forσ equal to 1.2 (SAGE 1.2), which is close to the value for the large particle
mode after volcanic eruptions (Deshler et al., 2003) and close to the assumption made by ST98.
Measurements for the sulfur amount injected into the stratosphere are subject to un-10
certainties. Total uncertainty in the amounts range from 7 to up to 13 Mt S (Lambert et al., 1993; Guo et al., 2004; SPARC, 2006), hence a sensitivity run was performed
with AER-2D injecting 9 MT of SO2 (AER 9). The simulation made for the SPARC
ASAP report with 10 MT of SO2 injected in a broader altitude range (16–29 km),
ab-sence of tropospheric washout of aerosols above 10 km (instead of 16 km), and clima-15
tological wind fields is also shown (AER 10 ASAP).
Finally, the results from SAGE 4λ and AER 7 are used as input for the CCM
SO-COL.v2 (Schraner et al., 2008) to test the radiative response to these optical forcings.
The three different SAGE based approaches used to retrieve size distributions are
de-scribed subsequently. These 3 methods assume unimodal lognormal distributions. 20
2.1 1st method: SAGE 4λ
The SAGE 4λ method computes single lognormal size distributions, which are
de-scribed by the total number of particles (N0), the width of the distribution (standard
deviationσ) and the mode radius (rm):
dN(r)
dr =N0
e−
1 2
ln2(r/rm) ln2σ
√
2πrln2σ (1)
ACPD
13, 4601–4635, 2013Uncertainties in modelling Mt. Pinatubo eruption
F. Arfeuille et al.
Title Page
Abstract Introduction
Conclusions References
Tables Figures
◭ ◮
◭ ◮
Back Close
Full Screen / Esc
Printer-friendly Version Interactive Discussion
Discussion
P
a
per
|
Dis
cussion
P
a
per
|
Discussion
P
a
per
|
Discussio
n
P
a
per
|
where dN(r) is the number concentration of particles in the interval with radius ∈ [r,
r+dr]. From the size distribution and H2SO4wt% (calculated using 1991 annual mean
ERA-interim relative humidity), the spectrally resolved optical properties can be calcu-lated by means of Mie theory (Mie, 1908).
In this approach, the four wavelengths (385, 452, 525 and 1024 nm) of the SAGE 5
II data are used when available. A similar approach as SAGE 4λwas used in Bingen
et al. (2003) showing good results. In a first step, the mode radiusrm, distribution width
σand the number densityN0are left practically unconstrained for each latitude/altitude
point in time (σ ∈[1.2, 2.6],rm ∈[0.015 µm, 0.5 µm], andN0∈[0.5 cm−
3
, 1000 cm−3]).
For each individual location and time the best set of parameters, minimizing the dif-10
ference to the SAGE II extinctions at its 4 wavelengths, is obtained. The extinction at each SAGE wavelength is weighted by its standard deviation when available from the SAGE ASAP dataset, giving more weight to more precise measurements. As the 4 wavelengths of SAGE do not represent entirely independent pieces of information, multiple solutions are possible for the 3 parameters. Thus, a second step is needed 15
in order to avoid unphysical abrupt changes in the aerosol radii in space and time.
Therefore, the effective radius reff is calculated out of the previously fitted rm and σ
parameters:
reff=rme52ln 2σ
(2)
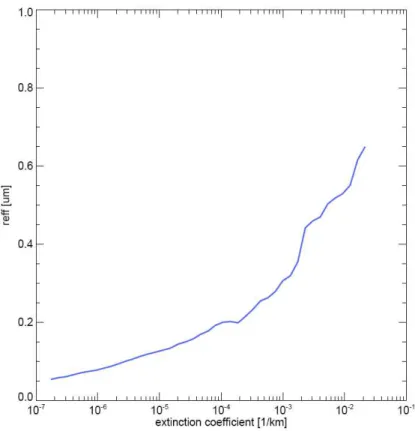
The scatterplot ofreff as function of the extinction coefficient at 1.024 µm is then
com-20
puted and the median values of the scatteredreff are taken for each extinction value
(see Fig. 1). The calculated median values are then used in the fitting process and the
σand number density are fitted again to minimize the differences to the SAGE
obser-vations. Thereff instead of the mode radius is used for the correlation to the extinction
at 1.024 µm because it includes informations about the distribution widthσ. The
corre-25
lation of the extinction at 1.024 µm withreff is hence more robust as it contains more
ACPD
13, 4601–4635, 2013Uncertainties in modelling Mt. Pinatubo eruption
F. Arfeuille et al.
Title Page
Abstract Introduction
Conclusions References
Tables Figures
◭ ◮
◭ ◮
Back Close
Full Screen / Esc
Printer-friendly Version Interactive Discussion
Discussion
P
a
per
|
Dis
cussion
P
a
per
|
Discussion
P
a
per
|
Discussio
n
P
a
per
|
number density and the widthσare fitted so that the SAGE II extinctions are matched.
The fitting of the number density and σ thus allows to reach good agreement with
the extinctions at all SAGE wavelengths. Furthermore, the calculated extinctions show good agreement with ISAMS and HALOE data (extinctions at longer wavelengths, see Sect. 4). The resulting size distribution and SAD are then consistent with observations 5
from SAGE to ISAMS wavelengths. This procedure eliminates the unphysical ambigui-ties mentioned above.
One exception to this second step was made to describe the tropical lower strato-sphere in the first months after the eruption. Indeed in the lower stratostrato-sphere the
coag-ulation rate is low due to a small diffusion coefficient of aerosol particles (high pressure,
10
low temperature). Hence, in the volcanic aerosol nucleation plume, the new volcanic aerosols formed after the eruption do not coagulate quickly and the relationship
be-tween extinctions and effective radii breaks down. For that reason, until September
1991 the aerosol radius in the tropical lower stratosphere can freely adjust so that available SAGE wavelenghts are matched. This leads to smaller (but more numerous) 15
aerosols (see Figs. 3a and 4b and description in Sect. 4 below) and hence reduces the aerosol absorption in this region.
In the gap-filled region, only the extinction at 1.024 µm is available and there is not
enough information to fit the size distribution parameters. Therefore, σ is fixed to 1.2
(close to the value for the large mode after volcanic eruptions). Thereffis then obtained
20
through its correlation with the extinction, i.e. the same relationship as in the gap-free regions, and finally the number density is fitted to match the 1.024 µm extinction.
2.2 2nd method: ST98
ST98 used effective radii retrieved from CLAES and ISAMS extinction measurements
proposed by Grainger et al. (1995) and Lambert et al. (1997). In general there is a good 25
correspondence to effective radii retrieved from SAGE II. They assumed a fixed
distri-bution width of σ=1.25. In a first step ST98 calculated the extinction for a number
ACPD
13, 4601–4635, 2013Uncertainties in modelling Mt. Pinatubo eruption
F. Arfeuille et al.
Title Page
Abstract Introduction
Conclusions References
Tables Figures
◭ ◮
◭ ◮
Back Close
Full Screen / Esc
Printer-friendly Version Interactive Discussion
Discussion
P
a
per
|
Dis
cussion
P
a
per
|
Discussion
P
a
per
|
Discussio
n
P
a
per
|
fit the extinction at 1.024 µm with SAGE II measurements. ST98 use an old SAGE II data set (Russell et al., 1996) with an older satellite retrieval procedure (SAGEv5.9 or similar) and a very simplified gap-filling approach (the last measured SAGE II value
in vicinity is taken to fill the gap). ST98 usedσ=1.25 because this distribution width
matched best with CLAES optical depth at 2.6 µm. The optical properties are then cal-5
culated with Mie theorie assuming H2SO4solution droplets of 70 %. It should be noted
that the retrieval of SAGE version V5.9 is significantly different from SAGE V6.0 and
higher, and should no longer be used. Conversely, differences in the aerosols from
SAGE V6.0 to V7 (recently published) are minor. See Sect. 3 below for details.
2.3 3rd method: SAGE 1.8 and SAGE 1.2
10
Based on a principal component analysis using four wavelength of SAGE II Thomason et al. (1997b) found the following relationship between the extinctions at 1.024 µm and the surface area density. SAD:
SAD=
425×k0.68 fork <4×10⁻³
1223×k0.875 for 4×10⁻³< k <2×10⁻²
2000×k for 2×10⁻²< k
(3)
wherekis the extinction coefficient at 1.024 µm in km−1and SAD is in µm2cm−3. This
15
relationship is based on the assumption that the wavelength dependence of the
ex-tinction is stable for different aerosol extinctions. This assumption is justified for most
cases. For SAD around 0.1 µm2cm−3 the uncertainty ranges within ±30 %, for SAD
greater than 10 µm2cm−3 within ±15 % (Thomason et al., 1997b). However, after the
Mt. Pinatubo eruption this relationship differs significantly in the tropical lower
strato-20
sphere from the real SAD. This deviation is caused by conjunction of small aerosol size and large extinction after the injection of large amounts of small aerosol following
the eruption (SPARC, 2006, Chapter 4, pp. 138ff). Unfortunately there are no aerosol
ACPD
13, 4601–4635, 2013Uncertainties in modelling Mt. Pinatubo eruption
F. Arfeuille et al.
Title Page
Abstract Introduction
Conclusions References
Tables Figures
◭ ◮
◭ ◮
Back Close
Full Screen / Esc
Printer-friendly Version Interactive Discussion
Discussion
P
a
per
|
Dis
cussion
P
a
per
|
Discussion
P
a
per
|
Discussio
n
P
a
per
|
OPC (Optical Particle Counter), but it is conceivable that due to changes in the size distribution in post-volcanic times this relationship can lead to significant errors.
Similarly to the SAD the effective radius reff can be retrieved from the extinction at
1.024 µm as following:
reff=
0.0303×[ln(k)+11.515]+0.16 for 1×10⁻⁵< k <3.0×10⁻⁴
0.15×exp(0.04916×[ln(k)+11.513]2) for 3.0×10⁻⁴< k <1.8×10⁻³
0.55 for 1.8×10⁻³< k
(4) 5
Schraner et al. (2008) assumed σ=1.8 (SAGE 1.8), which is a mean value for the
last few decades. However, after volcanic eruptions σ can differ substantially from
this value. Following Stenchikov et al. (1998) we repeated the calculation forσ=1.2
(SAGE 1.2). The extinction is very sensitive toσ. For the same aerosol mass, ifσ is
large, there are fewer but bigger particles. This affects the radiative properties of the
10
aerosol layer: for the same total mass, smaller particles scatter shortwave radiation
more efficiently, but absorb longwave radiation almost to the same degree as larger
particles. The number densityN0is finally calculated from the SAD,σ, andreff.
The main difference between the SAGE 1.8, SAGE 1.2, SAGE 4λ and ST98
ap-proaches is the estimation of the particle size distribution. SAGE 1.8 and SAGE 1.2 fol-15
low the approach of SAD conservation from a Principal Component Analysis
(Thoma-son et al., 1997a), whereas SAGE 4λand ST98 derive size distributions such that the
extinctions at the SAGE wavelength(s) match the observations best.
3 Differences between pre and post version 6 SAGE II aerosol products
SAGE II began operations in 1984 when aerosol loading was still enhanced above 20
ACPD
13, 4601–4635, 2013Uncertainties in modelling Mt. Pinatubo eruption
F. Arfeuille et al.
Title Page
Abstract Introduction
Conclusions References
Tables Figures
◭ ◮
◭ ◮
Back Close
Full Screen / Esc
Printer-friendly Version Interactive Discussion
Discussion
P
a
per
|
Dis
cussion
P
a
per
|
Discussion
P
a
per
|
Discussio
n
P
a
per
|
measurement line-of-sight (LOS) geometry remained well below the level at which transmission drops below measureable levels (about an optical depth of 7 along the path between the spacecraft and the Sun) and extinction profiles were made into the upper troposphere throughout this period. After the eruption of Pinatubo in 1991, the LOS optical depth was significantly above 7 and remained so well into 1993 particu-5
larly in the tropics. As a result most profiles were terminated in the lower stratosphere even as high as 25 km in the first few months after the eruption. Nominally, both the version 5 series of SAGE II products and version 6 series reflect these facts. However, it became apparent to the SAGE II algorithm team that the version 5 series had serious deficiencies which required the algorithm developments that eventually produced V6.0. 10
The most important of the deficiencies was associated with normalization (producing transmission) and altitude registration. SAGE II observes the Sun through the limb of the atmosphere, scanning across the solar disk normal to the surface of the Earth using a mirror, and uses observations made above the atmosphere to convert observations
to transmission and eventually profiles of ozone, NO2, water vapor and aerosol
extinc-15
tion coefficient at 4 wavelengths. Under most conditions, SAGE II uses observations of
the upper and lower edges of the Sun to locate the position of measurements on the Sun and the location of the tangent point in the atmosphere. The location on the Sun is important to converting observations to transmission while locating events in the atmo-sphere is crucial to accurate altitude registration of the data. The rate of motion of the 20
scan mirror across the Sun is estimated from the times the edges of the Sun are ob-served. In cases where optically dense layers are observed, the lower edge of the Sun becomes unobservable and both the Sun position and the position are inferred using only the upper edge of the Sun and a prediction of the rate of motion of the scan mirror. The SAGE II algorithm team observed that the algorithms used prior to V6.0 did a poor 25
job of estimating this scan rate and as a result the position of points in which the lower of edge of the Sun was obscured had significant errors in both location on the Sun
and in the atmosphere. The effect was generally a smearing of the thick parts of the
ACPD
13, 4601–4635, 2013Uncertainties in modelling Mt. Pinatubo eruption
F. Arfeuille et al.
Title Page
Abstract Introduction
Conclusions References
Tables Figures
◭ ◮
◭ ◮
Back Close
Full Screen / Esc
Printer-friendly Version Interactive Discussion
Discussion
P
a
per
|
Dis
cussion
P
a
per
|
Discussion
P
a
per
|
Discussio
n
P
a
per
|
which profiles should have terminated. This was true for clouds as well as the Pinatubo aerosol layer. Versions 6.0 and later employ a substantially improved single Sun-edge algorithm and, as such, exhibit a far superior performance around optically thick layers. For instance, in V5.93 clouds were frequently observed above the tropopause but in V6.0 and later, with the exception of polar stratospheric clouds, cloud frequency above 5
the tropopause is effectively zero. For Pinatubo, the observed top of the aerosol layer
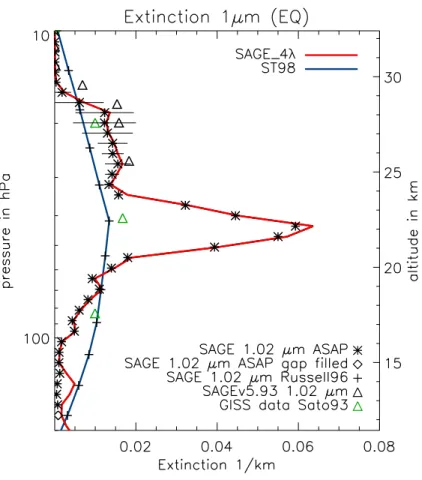
is much sharper and is no longer smeared over multiple kilometers. As a result, with the release of V6.0 in 2000, the SAGE II algorithm team considered versions prior to V6.0 to be so deficient that these versions were withdrawn from circulation and they strongly recommended that they no longer be employed for any application. Figure 2 10
demonstrates the differences in these profiles showing a comparison of V5.93 and
V6.0 zonally-averaged aerosol extinction in the tropics in August 1991. We can see the much higher termination of the SAGE II V5.93 extinctions compared to V6.0. The Russell et al. (1996) and Sato et al. (1993) extinction data sets (subsequently used by Stenchikov et al., 1998) are built using V5.93 (or similar version) with all its clear de-15
fects. However, the data quality issues are exacerbated from this point by the method in which events which terminate above the tropopause (so called saturated events) are extended to the tropopause. In this data set, the last observation (which is significantly compromised) is used at all altitudes down to the tropopause and not otherwise con-strained by any observation. The ASAP data set is a significant improvement over that 20
available in 1998. Foremost, it is based on V6.2, a far superior version than anything prior to V6.0, and it also uses a collection of corroborative data, primarily ground- and aircraft-based lidar observations, to fill the observations lost to the extreme opacity of the stratosphere in 1991 through 1993 (SPARC, 2006). While these observations are converted to 1020 nm extinction using an uncertain extinction-to-backscatter ratio, con-25
ACPD
13, 4601–4635, 2013Uncertainties in modelling Mt. Pinatubo eruption
F. Arfeuille et al.
Title Page
Abstract Introduction
Conclusions References
Tables Figures
◭ ◮
◭ ◮
Back Close
Full Screen / Esc
Printer-friendly Version Interactive Discussion
Discussion
P
a
per
|
Dis
cussion
P
a
per
|
Discussion
P
a
per
|
Discussio
n
P
a
per
|
The ST98 extinctions are based on 5 km resolution optical depths values from Sato et al. (1993), as seen in Fig. 2. SAGE V5.93 shows larger values (maybe due to changes in altitude resolution from extinctions computed by Sato et al., 1993; Rus-sell et al., 1996) but shows clearly the high altitude of termination from where data was filled by downward extrapolation. This leads the pre-SAGE 6.0 datasets to miss the 5
extinction peak around 40 hPa and to overestimate the extinction below 70 hPa due to lack of satellite data.
4 Results
The extinction, single scattering albedo and asymmetry factor at wavelengths cover-ing the whole spectral range are the key parameters to model the radiative impact of 10
stratospheric aerosols. These quantities are calculated by means of Mie theory (Mie, 1908) for spherical dielectric aerosol particles, using refractive indices measured by
Luo et al. (1996) and Biermann et al. (2000), temperature and H2SO4wt% (calculated
based on 1991 annual mean ERA-interim relative humidities), applied to the retrieved size distributions.
15
4.1 Size distributions
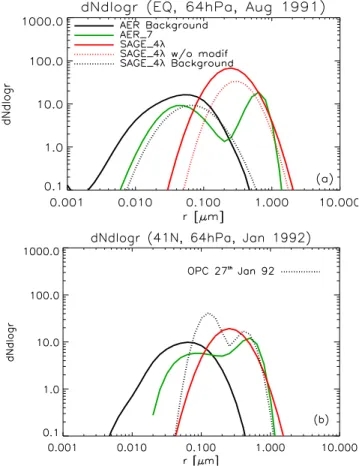
Figure 3 shows size distributions derived from SAGE 4λand from the AER-2D model
runs for a 7 MT eruption (AER 7) and volcanically quiescent conditions (Background). Furthermore, it shows a comparison with optical particle counter (OPC) measurements from Laramie, Wyoming (Rosen, 1964; Deshler et al., 1992). The AER-derived size dis-20
tributions at the equator in August 1991 (Fig. 3a) show the development of the volcanic
mode and a shift of the background mode to larger radii. The SAGE 4λbackground
size distribution (taken from January 1991) shows less small aerosols compared to the
AER background simulation. In August 1991 at 64 hPa, the SAGE 4λapproach
ACPD
13, 4601–4635, 2013Uncertainties in modelling Mt. Pinatubo eruption
F. Arfeuille et al.
Title Page
Abstract Introduction
Conclusions References
Tables Figures
◭ ◮
◭ ◮
Back Close
Full Screen / Esc
Printer-friendly Version Interactive Discussion
Discussion
P
a
per
|
Dis
cussion
P
a
per
|
Discussion
P
a
per
|
Discussio
n
P
a
per
|
a wide unimodal distribution with a large number of small aerosols, while this is not
the case for the SAGE 4λdistribution not incorporating this special modification. The
modification allows the SAGE 4λmethod to capture the high 0.525 µm to 1.024 µm
ex-tinction ratio below 60 hPa right after the eruption (Fig. 4b). This high ratio is the result of high particle number densities as a consequence of slow coagulation due to a lim-5
ited diffusion coefficient of aerosol particles (high pressure, low temperature). Figure 3b
shows a comparison with OPC measurements from Laramie (41◦N) at 64 hPa for
Jan-uary 1992. The SAGE 4λapproach covers the two modes of the observed distribution,
but exhibits fewer aerosols below 0.35 µm. This deficiency does not significantly affect
the later retrievals of longwave extinction and heating rates, because the SAGE 4λ
re-10
sult provides a good approximation for the large particles and hence for aerosol volume density. The AER 7 simulation captures well the high end of the distribution but under-estimates the radius of the aerosols in the background mode, possibly due to a too rapid latitudinal distribution in the 2-D model.
From these size distributions, extinctions are computed for short and long wave-15
lengths and compared to measurements from SAGE II at 1.024 µm, HALOE at 3.46 µm and 5.26 µm, and ISAMS at 12.1 µm.
4.2 Shortwave extinctions
SAGE 4λshows perfect agreement with SAGE ASAP at 1.024 µm as shown in Figs. 5a
and 6a at the equator. This illustrates the accuracy of SAGE 4λin matching the various
20
wavelengths of SAGE ASAP by adjusting the number density and distribution width of the aerosols. ST98, with retrieval based on old data (Russell et al., 1996), is less than half of SAGE ASAP 1.024 µm measurements at 40 hPa in 1991 (Fig. 5a). Above 20 hPa and below 60 hPa at the equator, ST98 overestimates SAGE ASAP data (Fig. 6a). Ac-cordingly, heating rate calculations in GCMs and CCMs based on ST98 use a data set 25
ACPD
13, 4601–4635, 2013Uncertainties in modelling Mt. Pinatubo eruption
F. Arfeuille et al.
Title Page
Abstract Introduction
Conclusions References
Tables Figures
◭ ◮
◭ ◮
Back Close
Full Screen / Esc
Printer-friendly Version Interactive Discussion
Discussion
P
a
per
|
Dis
cussion
P
a
per
|
Discussion
P
a
per
|
Discussio
n
P
a
per
|
The AER simulations significantly overestimate the extinction at the equator when compared to SAGE ASAP. However, in the extra-tropics, AER 7 results are generally
in very good agreement with the observations (Fig. 7a, b). At this latitudes, SAGE 4λ
and ST98 show similar values, in agreement with SAGE ASAP data.
The profiles of Fig. 6a show that SAGE 1.8 and especially SAGE 1.2 overestimate 5
the extinctions at 1.024 µm at all altitudes.
4.3 Longwave extinctions
All the SAGE derived methods are based on extinctions at short wavelengths (λ≤
1.024 µm). The longwave radiations peak are mainly responsible for the in-situ heating. Whether the retrieved aerosol size distribution can represent the extinctions at these 10
long wavelengths is a critical question. In the following section, we compare the calcu-lated results with satellite measurements at infrared wavelengths.
The extinctions at 3.46 µm, 5.26 µm and 12.1 µm provide information on the aerosol absorption in the terrestrial IR which is mostly responsible for the stratospheric
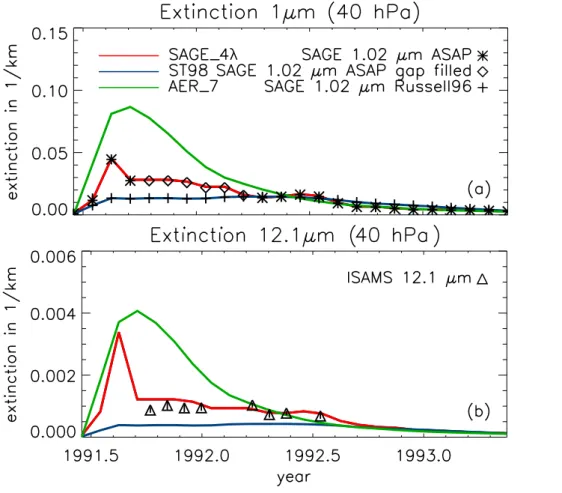
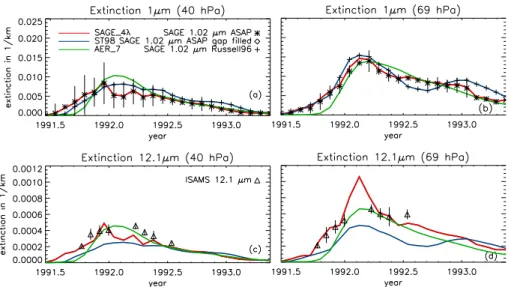
warm-ing after an eruption. At 40 hPa (Fig. 5b) SAGE 4λis in good agreement with
avail-15
able measurements at the equator, while ST98 exhibits too low values and AER 7 overestimates the extinction until spring 1992. However, at mid-latitudes results from AER 7 at 12.1 µm agree better with observations, while ST98 underestimates the ex-tinctions at 12.1 µm compared to ISAMS observations (Fig. 7c, d) despite showing accurate extinctions at 1.024 µm (Fig. 7a, b). This indicates a too high 1.024 µm to 20
12.1 µm extinction ratio in ST98. In December 1991 at 40 hPa, large extinctions are displayed in SAGE 1.8 and SAGE 1.2 which are significantly larger than the ISAMS
values (Fig. 6b). Conversely, at 30 hPa, SAGE 1.8, SAGE 1.2 and SAGE 4λ slightly
underestimate the extinctions.
The SAGE 4λcalculation shows a reasonable agreement with the data, especially in
25
ACPD
13, 4601–4635, 2013Uncertainties in modelling Mt. Pinatubo eruption
F. Arfeuille et al.
Title Page
Abstract Introduction
Conclusions References
Tables Figures
◭ ◮
◭ ◮
Back Close
Full Screen / Esc
Printer-friendly Version Interactive Discussion
Discussion
P
a
per
|
Dis
cussion
P
a
per
|
Discussion
P
a
per
|
Discussio
n
P
a
per
|
retrieval algorithm and gap-filling and from a too high 1.024 µm to IR extinction ratio compared with observation (see Fig. 4c, d).
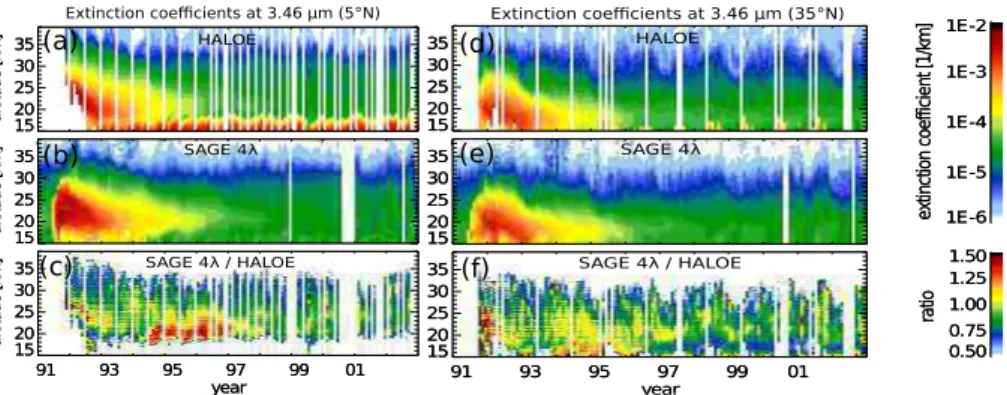
Compared to HALOE data, SAGE 4λalso show good agreement after the eruption,
with differences to the HALOE extinctions at 3.46 µm mostly below 25% right after the
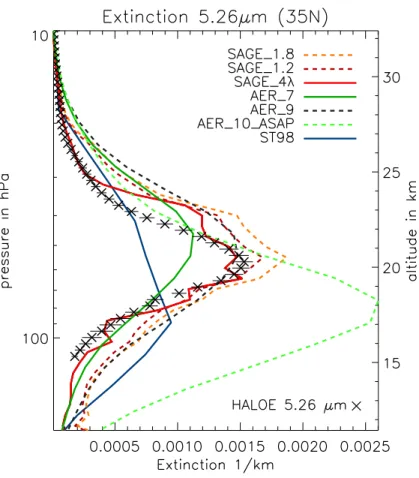
eruption at the equator and mid-latitudes (Fig. 8). The 30–40◦N extinctions at 5.26 µm
5
6 months after the eruption are also comparable to HALOE observation for SAGE 4λ,
despite an overestimation around 40 hPa (Fig. 10). This overestimation at 40 hPa is also seen when compared to ISAMS measurements (Fig. 6b). SAGE 1.2 and espe-cially SAGE 1.8 show mostly too large extinctions. The ST98 extinctions at 5.26 µm show a similar too low altitudinal distribution compared to observations as its 12.1 µm 10
wavelength did. HALOE values are larger than ST98 between 70 hPa and 40 hPa (twice larger at 60 hPa), and much lower below.
The measurements at far-infrared (HALOE and ISAMS) were not used in the
re-trieval procedure of the SAGE 4λ size distributions. The good agreement between
ISAMS/HALOE and SAGE 4λsuggests that:
15
1. The assumed unimode lognormal size distribution is capable to describe both
ex-tinction coefficients in the short wavelength range but also in the long wavelength
range, despite it may deviate from the actual size distribution.
2. The derived lognormal size distributions based on data only at SAGE wavelengths are reasonable and allow us to calculate radiative properties at far-infrared. 20
The sensitivity simulations performed with the AER model show the influence of the injection mass on the extinction values. Clearly, the AER 9 and AER 10 ASAP simula-tions yield too high extincsimula-tions. The 7 Mt simulation (AER 7) performs the best but still overestimates extinctions at the equator. Figure 6a, b shows that 6 months after the eruption, AER simulations generally show too large values for extinctions at 1.024 µm 25
ACPD
13, 4601–4635, 2013Uncertainties in modelling Mt. Pinatubo eruption
F. Arfeuille et al.
Title Page
Abstract Introduction
Conclusions References
Tables Figures
◭ ◮
◭ ◮
Back Close
Full Screen / Esc
Printer-friendly Version Interactive Discussion
Discussion
P
a
per
|
Dis
cussion
P
a
per
|
Discussion
P
a
per
|
Discussio
n
P
a
per
|
above 10 km in this simulation. At mid-latitudes, AER 7 and AER 9 values are close to observations, AER 10 ASAP still being an outlier (Fig. 9). At 5.26 µm, the AER simula-tion AER 10 ASAP is again an outlier compared to HALOE data, while AER 9 extinc-tions are reasonable but showing a too broad altitude distribution (Fig. 10).
4.4 Stratospheric temperatures
5
Simulations with the CCM SOCOL.v2 (Schraner et al., 2008) were carried out to test
the stratospheric response to the SAGE 4λ and AER 7 scenarios. The GCM part of
SOCOL is based on ECHAM-4 using the ECHAM-4 radiation code. For the radiative transfer calculations spectral extinctions, single scattering albedos, asymmetry factors (as well as the surface area densities for heterogeneous chemistry calculations) directly 10
derived from the described methods were provided as boundary conditions to SOCOL. In Fig. 11, these SOCOL results are compared to the ERA-40 reanalysis and to values
from different general circulation models (GCM) as shown in Lanzante and Free (2007)
and from chemistry climate models (CCM) as shown in Eyring et al. (2006); SPARC-CCMVal (2010).
15
The stratospheric warming after the eruption is in general overestimated. SAGE 4λ
shows a bias between 1 K in fall 1991 to 3 K in spring 1992 in the tropics at 50 hPa compared to ERA40 data (Fig. 11a). Compared to GCM studies using the Sato et al.
(1993) or Ammann et al. (2003) datasets (Lanzante and Free, 2007), the SAGE 4λ
is in the high range of the tropical warming overestimation, while AER 7 exhibits even 20
larger values. In the same way, the global average temperature increase at 50 hPa from
the SAGE 4λexperiment is too high by 1.5 K in spring 1992 (Fig. 11b). The AER
re-sults are higher than the SAGE 4λcalculations for the end of 1991. The global average
temperature increase at 70 hPa shows similar characteristics (Fig. 11d). Compared to CCM studies using heating rates from Stenchikov et al. (1998) or derived from SPARC 25
(2006) surface area density data or Sato et al. (1993) extinction, SAGE 4λlies in the
high range of their estimations at 50 hPa and 70 hPa. In the tropical tropopause
ACPD
13, 4601–4635, 2013Uncertainties in modelling Mt. Pinatubo eruption
F. Arfeuille et al.
Title Page
Abstract Introduction
Conclusions References
Tables Figures
◭ ◮
◭ ◮
Back Close
Full Screen / Esc
Printer-friendly Version Interactive Discussion
Discussion
P
a
per
|
Dis
cussion
P
a
per
|
Discussion
P
a
per
|
Discussio
n
P
a
per
|
100 hPa, the SAGE 4λapproach leads to a clear improvement compared to the GCM
studies, while AER 7 is inside the range of their results.
5 Conclusions
The volcanic eruption of Mt. Pinatubo in June 1991 is the best documented large erup-tion on record, however lack of measurements in the tropics in the first months after the 5
eruption due to optical saturation limits the quality of the data. GCMs and CCMs show important variations in lower stratospheric temperatures following the Pinatubo erup-tion with a tendency to overestimate the warming (SPARC-CCMVal, 2010; Gettelman et al., 2010; Lanzante and Free, 2007). CCMs which implement the aerosol heating us-ing Stenchikov et al. (1998) precalculated heatus-ing rates overestimate the stratospheric 10
warming only slightly, but this apparent agreement is fortuitous, because the ST98 dataset present too low IR extinctions compared to measurements. This underestima-tion of the infrared extincunderestima-tions is due to the use of an outdated version of the SAGE retrieval algorithm and gap-filling (and also further due to a too high 1 µm to IR extinc-tion ratio). GCMs, which in the past have used the Sato et al. (1993) GISS dataset (also 15
based on an outdated version of SAGE II) and a fixed distribution width tend to over-estimate the warming, as do CCMs using heating rates derived from SPARC (2006) surface area density data (Morgenstern, 2010; Lanzante and Free, 2007). The results from these approaches will depend on the choice of the aerosol distribution width, al-though using a fixed width of either 1.8 or 1.2 together with SPARC (2006) SAD and 20
effective radii did not lead to satisfactory IR extinctions in our study.
An erroneous prescription of the volcanic aerosol forcing can lead to a false error attribution to the radiation scheme of a specific model or hide a bias by compensating errors in the external forcing and the radiation scheme. Therefore, extinctions or heating rates derived from the Stenchikov et al. (1998) or Sato et al. (1993) datasets should 25
ACPD
13, 4601–4635, 2013Uncertainties in modelling Mt. Pinatubo eruption
F. Arfeuille et al.
Title Page
Abstract Introduction
Conclusions References
Tables Figures
◭ ◮
◭ ◮
Back Close
Full Screen / Esc
Printer-friendly Version Interactive Discussion
Discussion
P
a
per
|
Dis
cussion
P
a
per
|
Discussion
P
a
per
|
Discussio
n
P
a
per
|
2006) on the stratospheric warming after the Pinatubo eruption. Using the
state-of-the-art SAGE II retrieval algorithm, we derived aerosol size distributions with different
methods to calculate spectrally resolved optical properties for the Pinatubo eruption and tested the accuracy of the infrared extinctions compared to ISAMS measurements.
The dataset produced using a fit to the four wavelengths of SAGE II (SAGE 4λ) shows
5
a good agreement with extinction profiles and evolutions of both SAGE II visible/near infrared wavelengths and IR measurements from HALOE at 3.46 µm and 5.26 µm and ISAMS at 12.1 µm while the dataset from Stenchikov et al. (1998) displays too low extinctions above 20 km. The use of SPARC (2006) surface area density data and a fixed distribution width (SAGE 1.8, SAGE 1.2) to infer the optical parameters leads 10
to somewhat too large extinctions in the infrared compared to measurements. Results using the microphysical aerosol model AER to generate the aerosol size distributions reveal a clear overestimation of the extinctions at the equator (even though the AER model was found to be one of the most successful aerosol models in SPARC, 2006) but a general good agreement in the extra-tropics.
15
Using the SAGE 4λdata to simulate the Pinatubo eruption in the CCM SOCOL leads
to a significant overestimation of the tropical stratospheric temperatures, by up to 3 K at 50 hPa, but a generally good agreement at 100 hPa.
For GCM and CCM simulations using volcanic forcings with longwave extinctions for the Pinatubo eruption lower than found in this study for the aerosol peak around 20
40–50 hPa, we argue that the stratospheric temperature increase overestimation often present in these models is unlikely due to an error in the volcanic aerosol forcing data, and could even be amplified by using a dataset closer to the SAGE ASAP, HALOE and ISAMS observations. Rather, the cause of this problem is likely due to constraints in the radiation codes of the respective models. Conversely, the warming at the tropical 25
tropopause could be reduced by using the new SAGE ASAP data and an appropriate size distribution retrieval. Finally, our study shows that the use of the surface area
ACPD
13, 4601–4635, 2013Uncertainties in modelling Mt. Pinatubo eruption
F. Arfeuille et al.
Title Page
Abstract Introduction
Conclusions References
Tables Figures
◭ ◮
◭ ◮
Back Close
Full Screen / Esc
Printer-friendly Version Interactive Discussion
Discussion
P
a
per
|
Dis
cussion
P
a
per
|
Discussion
P
a
per
|
Discussio
n
P
a
per
|
in SPARC, 2006) combined with a fixed distribution width of either 1.8 or even 1.2 leads to an overestimation of the infrared extinctions and therefore should be avoided.
Acknowledgements. We would like to acknowledge funding from the Cogito foundation and
from the Department of Environmental Science of ETH Zurich. Discussions with S. Fueglistaler in the early phase of this work are gratefully acknowledged.
5
References
Ammann, C. M., Meehl, G. A., Washington, W. M., and Zender, C. S.: A monthly and latitudinally varying volcanic forcing dataset in simulations of 20th century climate, Geophys. Res. Lett., 30, 1657, doi:10.1029/2003GL016875, 2003. 4617
Antu ˜na, J. C., Robock, A., Stenchikov, G. L., Thomason, L. W., and Barnes, J. E.: Lidar valida-10
tion of SAGE II aerosol measurements after the 1991 Mount Pinatubo eruption, J. Geophys. Res. Atm., 107, 4194, doi:10.1029/2001JD001441, 2002. 4602
Antu ˜na, J. C., Robock, A., Stenchikov, G., Zhou, J., David, C., Barnes, J., and Thomason, L.: Spatial and temporal variability of the stratospheric aerosol cloud produced by the 1991 Mount Pinatubo eruption, J. Geophys. Res. Atm, 108, 4624, doi:10.1029/2003JD003722, 15
2003. 4605
Biermann, U. M., Luo, B. P., and Peter, T.: Absorption spectra and optical constants of binary and ternary solutions of H2SO4, HNO3, and H2O in the mid infrared at atmospheric temper-atures, J. Phys. Chem. A, 104, 783–793, 2000. 4613
Bingen, C., Vanhellemont, F., and Fussen, D.: A new regularized inversion method for the re-20
trieval of stratospheric aerosol size distributions applied to 16 years of SAGE II data (1984– 2000): method, results and validation, Ann. Geophys., 21, 797–804, doi:10.5194/angeo-21-797-2003, 2003. 4607
Bluth, G. J. S., Doiron, S. D., Schnetzler, C. C., Krueger, A. J., and Walter, L. S.: Global tracking of the SO2clouds from the June, 1991 Mount-Pinatubo eruptions, Geophys. Res. Lett., 19, 25
151–154, 1992. 4602
ACPD
13, 4601–4635, 2013Uncertainties in modelling Mt. Pinatubo eruption
F. Arfeuille et al.
Title Page
Abstract Introduction
Conclusions References
Tables Figures
◭ ◮
◭ ◮
Back Close
Full Screen / Esc
Printer-friendly Version Interactive Discussion
Discussion
P
a
per
|
Dis
cussion
P
a
per
|
Discussion
P
a
per
|
Discussio
n
P
a
per
|
Deshler, T., Hervig, M. E., Hofmann, D. J., Rosen, J. M., and Liley, J. B.: Thirty years of in situ stratospheric aerosol size distribution measurements from Laramie, Wyoming (41 N), using balloon-borne instruments, J. Geophys. Res., 108, 4167, doi:10.1029/2002JD002514, 2003. 4606
Eyring, V., Butchart, N., Waugh, D. W., Akiyoshi, H., Austin, J., Bekki, S., Bodeker, G. E., Boville, 5
B. A., Br ¨uhl, C., Chipperfield, M. P., Cordero, E., Dameris, M., Deushi, M., Fioletov, V. E., Frith, S. M., Garcia, R. R., Gettelman, A., Giorgetta, M. A., Grewe, V., Jourdain, L., Kinnison, E., Mancini, E., Manzini, E., Marchand, M., Marsh, D. R., Nagashima, T., Newman, P. A., Nielsen, J. E., Pawson, S., Pitari, G., Plummer, D. A., Rozanov, E., Schraner, M., Shepherd, T. G., Shibata, K., Stolarski, R. S., Struthers, H., Tian, W., and Yoshiki, M.: Assessment of 10
temperature, trace species, and ozone in chemistry-climate model simulations of the recent past, J. Geophys. Res., 111, D22308, doi:10.1029/2006JD007327, 2006. 4617, 4635 Gettelman, A., Hegglin, M. I., Son, S. W., Kim, J. H., Fujiwara, M., Birner, T., Kremser, S.,
Rex, M., Anel, J. A., Akiyoshi, H., Austin, J., Bekki, S., Braesike, P., Br ¨uhl, C., Butchart, N., Chipperfield, M., Dameris, M., Dhomse, S., Garny, H., Hardiman, S. C., J ¨ockel, P., Kinnison, 15
D. E., Lamarque, J. F., Mancini, E., Marchand, M., Michou, M., Morgenstern, O., Pawson, S., Pitari, G., Plummer, D., Pyle, J. A., Rozanov, E., Scinocca, J., Shepherd, T. G., Shi-bata, K., Smale, D., Teyss `edre, H., and Tian, W.: Multimodel assessment of the upper tropo-sphere and lower stratotropo-sphere: tropics and global trends, J. Geophys. Res, 115, D00M08, doi:10.1029/2009JD013638, 2010. 4604, 4618
20
Grainger, R. G., Lambert, A., Rodgers, C. D., Taylor, F. W., and Deshler, T.: Stratospheric aerosol effective radius, surface-area and volume estimated from infrared measurements, J. Geophys. Res. Atmos., 100, 16507–16518, 1995. 4608
Guo, S., Bluth, G. J. S., Rose, W. I., Watson, I. M., and Prata, A. J.: Re-evaluation of SO2 release of the 15 June 1991 Pinatubo eruption using ultraviolet and infrared satellite sensors, 25
Geochem. Geophy. Geosy., 5, Q04001, doi:10.1029/2003GC000654, 2004. 4606
Hervig, M. E., Russell, J. M., Gordley, L. L., Daniels, J., Drayson, S. R., and Park, J. H.: Aerosol effects and corrections in the Halogen Occultation Experiment, J. Geophys. Res., 100, 1067– 1079, 1995. 4603
Kinnison, D. E., Grant, K. E., Connell, P. S., Rotman, D. A., and Wuebbles, D. J.: The chemical 30
ACPD
13, 4601–4635, 2013Uncertainties in modelling Mt. Pinatubo eruption
F. Arfeuille et al.
Title Page
Abstract Introduction
Conclusions References
Tables Figures
◭ ◮
◭ ◮
Back Close
Full Screen / Esc
Printer-friendly Version Interactive Discussion
Discussion
P
a
per
|
Dis
cussion
P
a
per
|
Discussion
P
a
per
|
Discussio
n
P
a
per
|
Labitzke, K. and McCormick, M. P.: Stratospheric temperature increases due to Pinatubo Aerosols, Geophys. Res. Lett., 19, 207–210, 1992. 4602
Lambert, A., Grainger, R. G., Remedios, J. J., Rodgers, C. D., Corney, M., and Taylor, F. W.: Measurements of the evolution of the Mt-Pinatubo aerosol cloud by ISAMS, Geophys. Res. Lett., 20, 1287–1290, 1993. 4606
5
Lambert, A., Grainger, R. G., Remedios, J. J., Reburn, W. J., Rodgers, C. D., Taylor, F. W., Roche, A. E., Kumer, J. B., Massie, S. T., and Deshler, T.: Validation of aerosol mea-surements from the improved stratospheric and mesospheric sounder, J. Geophys. Res., 101(D6), 9811–9830, doi:10.1029/95JD01702, 1996. 4603
Lambert, A., Grainger, R. G., Rodgers, C. D., Taylor, F. W., Mergenthaler, J. L., Kumer, J. B., 10
and Massie, S. T.: Global evolution of the Mt. Pinatubo volcanic aerosols observed by the infrared limb-sounding instruments CLAES and ISAMS on the Upper Atmosphere Research Satellite, J. Geophys. Res. Atm., 102, 1495–1512, 1997. 4603, 4608
Lanzante, J. R. and Free, M.: Comparison of radiosonde and GCM vertical temperature trend profiles: effects of dataset choice and data homogenization, J. Climate, 21, p. 5417, 2007. 15
4604, 4617, 4618, 4635
Luo, B., Krieger, U. K., and Peter, T.: Densities and refractive indices of H2SO4/HNO3/H2O solutions to stratospheric temperatures, Geophys. Res. Lett., 23, 3707–3710, doi:10.1029/96GL03581, 1996. 4613
McCormick, M. P.: Initial assessment of the stratospheric and climatic impact of the 1991 Mount-20
Pinatubo eruption – prologue, Geophys. Res. Lett., 19, 149–149, 1992. 4602
Mie, G.: Articles on the optical characteristics of turbid tubes, especially colloidal metal solu-tions, Ann. Phys., 25, 377–445, 1908. 4607, 4613
Minnis, P., Harrison, E. F., Stowe, L. L., Gibson, G. G., Denn, F. M., Doelling, D. R., and Smith, W. L.: Radiative climate forcing by the Mount-Pinatubo eruption, Science, 259, 1411– 25
1415, 1993. 4602
Morgenstern, O., Giorgetta, M. A., Shibata K., Eyring, V., Waugh, D. W., Shepherd, T. G., Akiyoshi, H., Austin, J., Baumgaertner, A. J. G., Bekki, S., Braesicke, P., Br ¨uhl, C., Chip-perfield, M. P., Cugnet, D., Dameris, M., Dhomse, S., Frith, S. M., Garny, H., Gettelman, A., Hardiman, S. C., Hegglin, M. I., Kinnison, D. E., Lamarque, J. F., Mancini, E., Manzini, E., 30
associ-ACPD
13, 4601–4635, 2013Uncertainties in modelling Mt. Pinatubo eruption
F. Arfeuille et al.
Title Page
Abstract Introduction
Conclusions References
Tables Figures
◭ ◮
◭ ◮
Back Close
Full Screen / Esc
Printer-friendly Version Interactive Discussion
Discussion
P
a
per
|
Dis
cussion
P
a
per
|
Discussion
P
a
per
|
Discussio
n
P
a
per
|
ated external forcings, J. Geophys. Res., 115, D00M02, doi:10.1029/2009JD013728, 2010. 4604, 4618
Rosen, J. M.: The vertical distribution of dust to 30 km, J. Geophys. Res., 69, 4673–4676, 1964. 4613
Russell, J. M., Gordley, L. L., Park, J. H., Drayson, S. R., Hesketh, W. D., Cicerone, R. J., 5
Tuck, A. F., Frederick, J. E., Harries, J. E., and Crutzen, P. J.: The halogen occultation exper-iment, J. Geophys. Res., 98, 10777–10797, doi:10.1029/93JD00799, 1993. 4603
Russell, P. B., Livingston, J. M., Pueschel, R. F., Bauman, J. J., Pollack, J. B., Brooks, S. L., Hamill, P., Thomason, L. W., Stowe, L. L., Deshler, T., Dutton, E. G., and Bergstrom, R. W.: Global to microscale evolution of the Pinatubo volcanic aerosol derived from diverse mea-10
surements and analyses, J. Geophys. Res. Atm., 101, 18745–18763, 1996. 4605, 4609, 4612, 4613, 4614
Sato, M., Hansen, J. E., McCormick, M. P., and Pollack, J. B.: Stratospheric aerosol optical depths, 1850–1990, J. Geophys. Res. Atm., 98, 22987–22994, 1993. 4603, 4604, 4605, 4612, 4613, 4617, 4618
15
Schraner, M., Rozanov, E., Schnadt Poberaj, C., Kenzelmann, P., Fischer, A. M., Zubov, V., Luo, B. P., Hoyle, C. R., Egorova, T., Fueglistaler, S., Br ¨onnimann, S., Schmutz, W., and Pe-ter, T.: Technical Note: Chemistry-climate model SOCOL: version 2.0 with improved transport and chemistry/microphysics schemes, Atmos. Chem. Phys., 8, 5957–5974, doi:10.5194/acp-8-5957-2008, 2008. 4606, 4610, 4617
20
SPARC: Assessment of Stratospheric Aerosol Properties (ASAP), SPARC Report No. 4, edited by: Thomason, L. and Peter, T., World Climate Research Programme WCRP-124, WMO/TD No. 1295, 2006. 4603, 4604, 4605, 4606, 4609, 4612, 4617, 4618, 4619, 4620, 4628
SPARC-CCMVal, 2010: SPARC Report on the Evaluation of Chemistry-Climate Models, edited 25
by: Eyring, V., Shepherd, T. G., and Waugh, D., Tech. rep., SPARC Report No. 5, WCRP-132, WMO/TD-No. 1526, WCRP-132, WMO/TD-No. 1526, 2010. 4604, 4617, 4618, 4635 Stenchikov, G. L., Kirchner, I., Robock, A., Graf, H. F., Antuna, J. C., Grainger, R. G.,
Lam-bert, A., and Thomason, L.: Radiative forcing from the 1991 Mount Pinatubo volcanic erup-tion, J. Geophys. Res. Atm, 103, 13837–13857, 1998. 4603, 4604, 4605, 4610, 4612, 4617, 30
4618, 4619
ACPD
13, 4601–4635, 2013Uncertainties in modelling Mt. Pinatubo eruption
F. Arfeuille et al.
Title Page
Abstract Introduction
Conclusions References
Tables Figures
◭ ◮
◭ ◮
Back Close
Full Screen / Esc
Printer-friendly Version Interactive Discussion
Discussion
P
a
per
|
Dis
cussion
P
a
per
|
Discussion
P
a
per
|
Discussio
n
P
a
per
|
Thomason, L. W.: Observations of a new SAGE-II aerosol extinction mode following the erup-tion of Mt-Pinatubo, Geophys. Res. Lett., 19, 2179–2182, 1992. 4602
Thomason, L. W., Kent, G. S., Trepte, C. R., and Poole, L. R.: A comparison of the stratospheric aerosol background periods of 1979 and 1989–1991, J. Geophys. Res. Atm., 102, 3611– 3616, 1997a. 4610
5
Thomason, L. W., Poole, L. R., and Deshler, T.: A global climatology of stratospheric aerosol surface area density deduced from Stratospheric Aerosol and Gas Experiment II measure-ments: 1984–1994, J. Geophys. Res. Atm, 102, 8967–8976, 1997b. 4606, 4609
Thomason, L. W.: Toward a combined SAGE II-HALOE aerosol climatology: an evaluation of HALOE version 19 stratospheric aerosol extinction coefficient observations, Atmos. Chem. 10
Phys., 12, 8177–8188, doi:10.5194/acp-12-8177-2012, 2012. 4603
Weisenstein, D. K., Yue, G. K., Ko, M. K. W., Sze, N. D., Rodriguez, J. M., and Scott, C. J.: A two-dimensional model of sulfur species and aerosols, J. Geophys. Res. Atmos., 102, 13019–13035, 1997. 4605
Wurl, D., Grainger, R. G., McDonald, A. J., and Deshler, T.: Optimal estimation retrieval of 15
ACPD
13, 4601–4635, 2013Uncertainties in modelling Mt. Pinatubo eruption
F. Arfeuille et al.
Title Page
Abstract Introduction
Conclusions References
Tables Figures
◭ ◮
◭ ◮
Back Close
Full Screen / Esc
Printer-friendly Version Interactive Discussion
Discussion
P
a
per
|
Dis
cussion
P
a
per
|
Discussion
P
a
per
|
Discussio
n
P
a
per
|
Fig. 3.Differential number density dN/d logr as a function of aerosol radius at 64 hPa for(a) the equator (5◦S–5◦N) in August 1991, and(b)northern mid-latitudes (40◦N) in January 1992.
ACPD
13, 4601–4635, 2013Uncertainties in modelling Mt. Pinatubo eruption
F. Arfeuille et al.
Title Page
Abstract Introduction
Conclusions References
Tables Figures
◭ ◮
◭ ◮
Back Close
Full Screen / Esc
Printer-friendly Version Interactive Discussion
Discussion
P
a
per
|
Dis
cussion
P
a
per
|
Discussion
P
a
per
|
Discussio
n
P
a
per
|
ACPD
13, 4601–4635, 2013Uncertainties in modelling Mt. Pinatubo eruption
F. Arfeuille et al.
Title Page Abstract Introduction Conclusions References Tables Figures ◭ ◮ ◭ ◮ Back Close
Full Screen / Esc
Printer-friendly Version Interactive Discussion Discussion P a per | Dis cussion P a per | Discussion P a per | Discussio n P a per |
91 93 95 97 99 01 15 20 25 30 35 a lti tu d e [k m ]
91 93 95 97 99 01 15 20 25 30 35 a lti tu d e [k m ] 120 15 20 25 30 35 a lti tu d e [k m ] 120 15 20 25 30 35 a lti tu d e [k m ]
91 93 95 97 99 01 year 15 20 25 30 35 a lti tu d e [k m ]
91 93 95 97 99 01 year 15 20 25 30 35 a lti tu d e [k m ] (a) (b) (c)
Extinction coefficients at 3.46 µm (5°N)
HALOE
SAGE 4λ
SAGE 4λ / HALOE
91 93 95 97 99 01 15
20 25 30 35
91 93 95 97 99 01 15 20 25 30 35 120 15 20 25 30 35 120 15 20 25 30 35 1E-6 1E-5 1E-4 1E-3 1E-2 ex tin ct io n co ef fic ie nt [1 /k m ] 1E-6 1E-5 1E-4 1E-3 1E-2 ex tin ct io n co ef fic ie nt [1 /k m ]
91 93 95 97 99 01 year 15 20 25 30 35
91 93 95 97 99 01 year 15 20 25 30 35 0.50 0.75 1.00 1.25 1.50 ra tio 0.50 0.75 1.00 1.25 1.50 ra tio
Extinction coefficients at 3.46 µm (35°N)
HALOE
SAGE 4λ
SAGE 4λ / HALOE (d)
(e)
(f)
ACPD
13, 4601–4635, 2013Uncertainties in modelling Mt. Pinatubo eruption
F. Arfeuille et al.
Title Page
Abstract Introduction
Conclusions References
Tables Figures
◭ ◮
◭ ◮
Back Close
Full Screen / Esc
Printer-friendly Version Interactive Discussion
Discussion
P
a
per
|
Dis
cussion
P
a
per
|
Discussion
P
a
per
|
Discussio
n
P
a
per
|
Fig. 9.Zonal mean extinction for December 1991 at 1.024 µm and 12.1 µm at 30–40◦N.