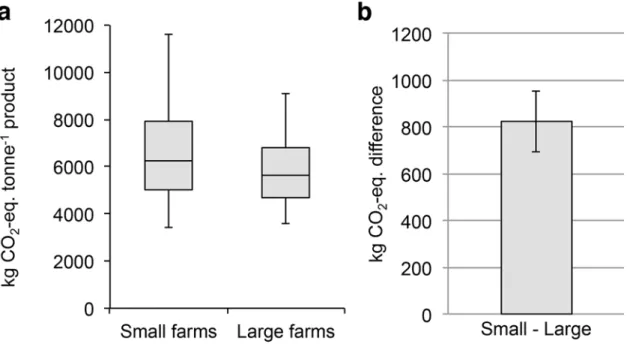
Product carbon footprints and their uncertainties in comparative decision contexts.
Texto
Imagem


Documentos relacionados
O mapa da urbanização atual do leste do estado de São Paulo (figura 3) mostra alguns eixos que podem ser correlacionados diretamente com as unidades morfoesculturais do
However, we found that across the monetary and the physical condition subjects showed the same level of trust and reciprocity. Moreover, subjects’ behavior across
The purpose of this study is to compare the evaluation of uncertainty obtained by the instructions of GUM with that obtained by Monte Carlo simulations, in the
Nas respostas dadas pelos bibliotecários era referido que os estudantes são difíceis de motivar no que toca a atividades para lá dos trabalhos académicos; ao mesmo
Em geral, as práticas cocriativas nas comunidades implicam o valor social mútuo atribuído ao Projeto Rondon. A gera- ção de valor pode ser compreendida por meio das oficinas
Eu amo os trabalhos artísticos que ainda me lembram suas origens entre as pesso- as comuns, meus ouvidos apenas ficam confortáveis quando o cantor canta como se um mero
O orbital LUMO, por sua vez, apresenta uma redução na sua distribuição sobre o grupo ácido enquanto este orbital “cobre” o átomo de carbono carboxílico no salicilato, no
Therefore, one of the goals of this work is to analyse the data included in the comparative table that gathers information about the WaRe project case studies – Bratislava,
