American Journal of Engineering Research (AJER)
e-ISSN : 2320-0847 p-ISSN : 2320-0936
Volume-02, Issue-08, pp-24-31
www.ajer.org
Research Paper Open Access
Comparative Analysis of Empirical Path Loss Model for Cellular
Transmission in Rivers State
B.O.H Akinwole, Biebuma J.J
Department of Electrical/Electronic Engineering, University of Port Harcourt Port Harcourt, Nigeria,
Abstract:- This paper presents a comparative analysis of three empirical path loss models with measured data for urban, suburban, and rural areas in Rivers State. The three models investigated were COST 231 Hata, SUI, ECC-33models. A downlink data was collected at operating frequency of 2100MHz using drive test procedure consisting of test mobile phones to determine the received signal power (RSCP) at specified receiver distances on a Globacom Node Bs located in some locations in the State. This test was carried out for investigating the effectiveness of the commonly used existing models for Cellular transmission. The results analysed were based on Mean Square Error (MSE) and Standard Deviation (SD) and were simulated on MATLAB (7.5.0). The results show that COST 231 Hata model gives better predictions and therefore recommended for path loss predictions in River State.
Keywords: - Cellular transmission, RSCP, path loss prediction empirical path loss model, Mean Square Error, Standard Deviation,
I. INTRODUCTION
One of the basic requirements for reliable and efficient transmissions of a Cellular system is the knowledge of the received signal and its variability at all distance points surrounding the base station. Propagation of radio frequency (RF) signals between a transmitting and receiving antenna is achieved by means of electromagnetic waves [1]. The signals, as they propagate through the free space, are subject to different propagation mechanisms and are heavily influenced by the environment resulting in a received power being significantly less than the original transmitted power. This phenomenon in Cellular systems is referred to as propagation loss (path loss). Path loss prediction plays an important role in estimation of received signal strength, interference optimization and analysis, link budget design and analysis, and cell size estimation. Path loss models are classified as deterministic, empirical, and semi-empirical [2].Deterministic models make use of the physical laws governing radio wave propagation mechanisms to predict transmission loss at a particular location. The models involve detailed and accurate description of all the objects in the propagating channel.
Empirical model is based on statistical characterisation of the received signal extensive measurements conducted with respect to several different parameters. It requires less computation effort unlike deterministic model that is site specific. A semi-empirical or semi-deterministic model combines the analytical formulation of physical phenomena with statistical fitting of variables by adjustment using experimental measurements. This paper presents a comparison between three empirical path loss models and the measured path loss for cellular transmission at WCDMA frequency of 2100MHz.
II. EXISTING PATH LOSS MODEL
2.1 LOG-NORMAL SHADOWING PATH LOSS MODEL
This model describes the random shadowing effects that occur over a large number of measurement locations with the equal separation distance between the transmitter and the receiver. The path loss model is
given as [3], L(dB)=L(d)+
L(dB) is random and log-normally distributed about the distance. where, is a zero mean Gaussian distributed random variable (in dB).
2.2 COST 231 Hata Model
COST 231 Hata model is an empirical model used for calculating path loss in cellular mobile system. This model is an extension of the Okumura-Hata model designed to cover frequency ranges from 1700Mz to 2300MHz with receiving antenna heights up to 10m and transmitting antenna heights of 30m-200m.COST 231 Hata model contains correction factors for urban, suburban, and rural areas. The equation for COST 231 Hata path loss model is expressed as [4]:
LCOST231Hata = 46.3+ 33.9 -13.82 -a + [44.9- 6.55 + (2)
where, d is the link distance in Kilometres, fc is the frequency in MHz, ht is the effective height of the
transmitting antenna in meters, hr is the effective height of the receiving antenna in meters, Cm is the correction
factor and is defined 0dB for rural or suburban and 3dB for urban area.
For rural or suburban area,
Correction factor for receiver antenna height,
a(hm) = (1.11log10 fc-0.7) – (1.5log10 fc - 0.8) (3) For Urban,
a(hm) = 3.2 (log 10(11.75hm))2 -4.79 (4)
2.3 STANFORD UNIVERSITY INTERIM (SUI) Model
The Stanford University Interim was developed by the working group of Institute of Electrical Electronic Engineers (IEEE 802.16) for path loss prediction in all three macro-cellular environments. The model is formulated to operate based on an operating frequency above 1900MHz and a cell radius of 0.1km to 8km, base station antenna height 10m to 80m, and receiver antenna height of 1m to 10m. This model is divided into three categories of terrains namely A, B, C. The terrain category A is associated with maximum path loss, and densely populated region. Moderate path loss is captured in terrain category B. The terrain category C is associated with minimum path loss and flat terrain with light tree densities (Afric et al, 2006).
The basic path loss formula for SUI model is expressed as [4],
LSUI =A+10 log 10 (d/do) +Xf+ X h+S (5)
For d do, and do=0.1Km
The parameter for free space attenuation, A is expressed as,
A=20 (6)
r is the path loss exponent, ht is the effective base station height, the constants used for a, b, and c are given in Table 1
Table1: Numerical values for the SUI Model Parameters
Model parameter
Terrai n A
Terrain B Terrain C
A 4.6 4.0 3.6
b (m-1) 0.0075 0.0065 0.005 c (m) 12.6 17.1 20
Xf is the frequency correction factor
= 6.0 (7)
Xh is the correction factor for receiving antenna height is defined as,
Xh= (8)
S is the correction for shadow fading factor, and is defined between 8.2dB and10.6dB. where fc is the operating frequency in MHz, and hr is the receiver antenna height in meters.
2.4 ECC-33 Model
The Electronic Communication Committee 33 model was developed by Electronic Communication Committee. This model is designed to predict path loss at higher frequency greater than 3GHz. In this model, path loss is given by [5],
LECC-33= Afs + Abm -Gt-Gr ( 10)
where, Afs is the free space attenuation (dB), Abm is the basic median path loss (dB), Gt is the transmitter
antenna height gain factor, Gr is the receiver antenna height gain factor.
where: the free space attenuation,
Afs=92.4+20 log10(d)+20log10(fc) (11)
Basic median path loss,
Abm=20.41+9.83 log10(d)+7.894log10(fc)+9.56[log10(fc)]2 (12)
Transmitter antenna height gain factor,
Gt= log10(ht/200){13.958+5.8[log10(hr)]}2 (13) For medium cities, the receiver antenna height gain factor Gr is expressed as,
Gr = [42.57+13.7log10 fc)][log10(hr)-0.585] (14)
III. DATA COLLECTION METHOD AND PROCEDURE
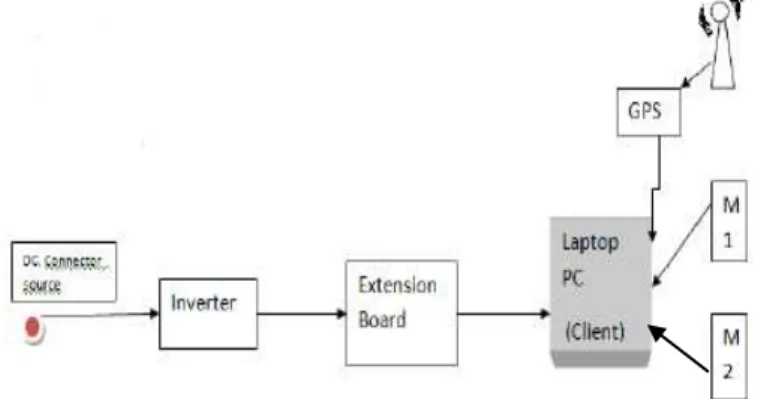
To predict path loss model for cellular transmission, practical data from the field measurement are required. Downlink data were collected at various distances on live radio Globacomm WCDMA Node Bs at transmits frequency of 2100MHz. A drive test tools used for collecting data include a laptop equipped with drive test Ericsson software, Map info software (professional version 8.0), a communication Network Analyser software (ACTIX analyser 4.05), Garmin GPS 12XL receiver, Two C702 Sony Ericsson TEMS phone for idle and dedicated mode, an inverter and extension board. The test was carried out at three different locations in Rivers State:
Rumukoro, with co-ordinate (4o48 ˝N 7o12'6E˝) is selected as urban area, Finima, Bonny Island with co-ordinate (4o26'12.8˝N 7o10'25.5˝E) selected as sub-urban area, and Borokiri (Creek road) coordinates (4045'50.5˝N 7o1 '26.4˝E) selected as rural area.
The two Sony Ericsson UEs, GPS receiver and the Dongle probe were coupled to a laptop placed in a car. The laptop was powered on in order to launch TEMS investigation software. All the equipment were connected and detected on TEMS interface. The routes and the Node Bs were identified before setting out for the drive test. The car was driven around through a predefined route in the direction of the Active Sector (AS) of the directional antenna away from the site until it got to the coverage border. The car was driven at an average speed of 30Km/h. Two modes of configurations for the handsets were used for the monitored software during this drive–test. These were the idle and dedicated modes. M1 was set at idle mode and M2 was set at
dedicated mode. M2 was preset automatically to make a continuous call to a fixed destination number. The
received signal power is measured using Ericsson handset and transferred to the TEMS log file in the laptop. The GPS receiver gave the location and distance from the Node B synchronously with the received power level reading and was recorded on the laptop. The experimental data were taken at distances ranging from 100meters to 1kilometer. Measurements were carried out between and October and November, 2012.The set up for the drive test measurement procedure is shown in
Fig 1: Drive-test system set up
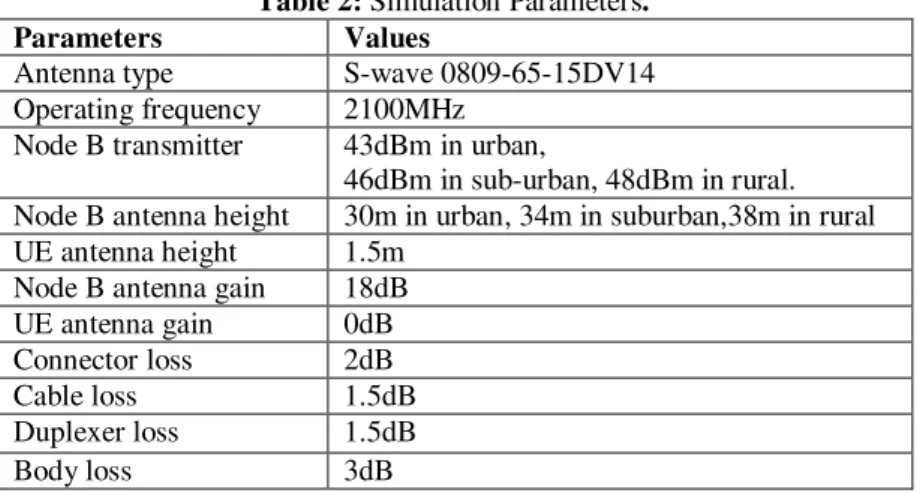
Table 2: Simulation Parameters.
Parameters Values
Antenna type S-wave 0809-65-15DV14 Operating frequency 2100MHz
Node B transmitter 43dBm in urban,
46dBm in sub-urban, 48dBm in rural. Node B antenna height 30m in urban, 34m in suburban,38m in rural UE antenna height 1.5m
Node B antenna gain 18dB UE antenna gain 0dB Connector loss 2dB Cable loss 1.5dB Duplexer loss 1.5dB Body loss 3dB
The shadow fading factor of 8dB, 6dB, and 5dB for Urban , suburban and Rural areas respectively were assumed through out the research work.
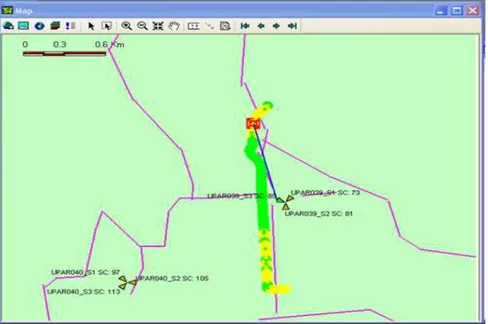
Figs (2) to (4) show the log files obtained for the field measured data obtained during the drive test for urban, suburban and rural areas respectively.
Fig 2 Log file showing the received signal level distribution for Urban area (Rumokoro)
Fig4: Log file showing the received signal level distribution for rural area (Borokiri)
3.1 Field Measured Path loss. These tables below show the data obtained from the investigated areas.
Table 3: Measured Path Loss for Urban area.
Distance between the Node B and the UE, d (Km)
Mean received level (dBm)
Measured Path Loss, (dB)
0.10 -69 115
0.20 -74 120
0.30 -79 125
0.40 -80 126
0.50 -82 128
0.60 -85 131
0.70 -89 135
0.80 -93 139
0.90 -97 143
1.00 -99 145
Table 4: Measured Path Loss for Suburban area.
Distance between the Node B and the UE, d (Km)
Mean Received Level (dBm)
Measured Path Loss, (dB)
0.10 -62 110
0.20 -68 116
0.30 -71 119
0.40 -75 123
0.50 -77 125
0.60 -81 129
0.70 -83 131
0.80 -85 133
0.90 -87 135
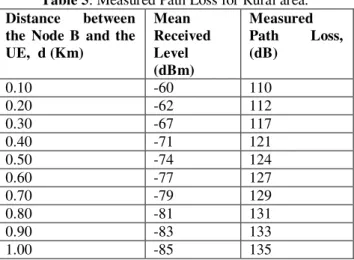
Table 5: Measured Path Loss for Rural area.
Distance between the Node B and the UE, d (Km)
Mean Received Level (dBm)
Measured Path Loss, (dB)
0.10 -60 110
0.20 -62 112
0.30 -67 117
0.40 -71 121
0.50 -74 124
0.60 -77 127
0.70 -79 129
0.80 -81 131
0.90 -83 133
1.00 -85 135
3.2 STATISTICAL MODELLING OF FIELD MEASURED PATH LOSS.
The values of the path loss exponent, r and the reference path loss L(d), for each of the environments are obtained from the measured data by linear regression algorithm . Considering other losses stated in Table 2, the resultant Path loss model for field measurement is expressed as,
Lestimated(dB)=L(d)+10*r*log10( )+ ( + )- + ) (15)
Referring to equation (15), the path loss exponent, r and the reference path loss L(d) are calculated for each environment using EXCEL worksheets.
IV. COMPARISON OF MEASURED PATH LOSS WITH EXISTING PATH LOSS MODEL
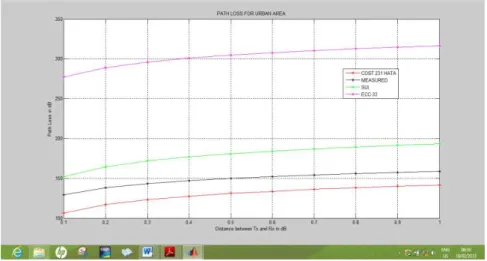
The path loss values for the three existing models investigated are estimated using equations (2), (5), and(10).The results were compared with the resultant path loss from the field measurements for the three locations using equation(15) and the results are shown in Figs (5) to (7) .
V. RESULTS AND DISCUSSION
The relationship between the predictions from the three path loss models considered and the measured path loss are simulated on MATLAB software and are showed on the path loss distributed graph in Figs (5) to (7).
The comparison between measured path loss and the predicted path loss models are also done based on MSE and SD as give in equations (16) [6] and (17) respectively. The results of the comparison are given in Table (6). From the results obtained, it shows that ECC-33 model overestimates the measured path loss and has the highest predictions for the three environments, followed by SUI model. COST 231 Hata model under estimates measured path loss with high prediction values when compared with the minimum acceptable limit for good signal propagation.
(16)
(17)
Where, Pm Where, Pm = the measured path loss (dB), Pr is the predicted path loss (dB), and n is the number of
measured data points. The results are tabulated in Table (6).
Table (6): Statistical evaluation of MSE and SD for COST 231 Hata , SUI, ECC-33 models Verification
items
COST 231 Hata model
SUI model ECC-33 model
The acceptable limit for good signal propagation is 6dB [7]. COST 231 Hata model has the least MSE and SD for the three environments. COST 231 Hata model is selected as the best path loss model for effective predictions for Cellular transmission in Rivers state.
Figure 5: Comparison of path loss models with the measurement from urban area.
Figure 6: Comparison of path loss models with measurement from suburban area
VI. CONCLUSIONS
A comparative analysis of three path loss prediction model for urban, suburban, and rural area in Rivers State is presented in this paper. The measured path loss for each location is extracted from the field data and compared with corresponding results obtained from the three models. COST 231 Hata model showed a better performance for path loss predictions in Rivers state. From the results obtained, it is recommended that for accurate prediction of radio signal characteristics for cellular transmission, COST 231 Hata model needs to be adjusted .
REFRENCES
[1] Harri H, Antti T,”WCDMA for UMTS Radio The measured path loss Access for Third Generation Mobile Communications
[2] Andrea Goldsmith Wireless Communications Stanford University, 2005, pp 27
[3] Rappaport, T.S “ Wireless Communications, Second Edition, Pearson Publication, India, , pp 1392005, [4] Rakesh N. , Srivasta S. K. “An Investigation on Propagation Path Loss in Urban Environments for
Various Models at Transmitter Antenna Height of 5om and Receiver Antenna heights of 10m, 15m and
20m ” International journal of research and reviews in Computer science, Vol. 3 ,no 4 , 2012, pp 1761-1767, .
[5] Bruno S.L Marcio R, Gervasio P, “Comparision Between Known Propagation Models Using Least
Squares Tuning Algorithm on 5.8 GHz in Amazon Region Cities” Journal of Microwaves,
Optoelectronics and Electromagnetic Applications, Vol.10, No,1, 2011,pp 106-113
[6] Nwaogazie I. L. “Probability Statistics for Science and Engineering Parctice 2006, pp 114-120.
[7] Nadir Z, Muhammed I. A “Pathloss Determination using Okumura –Hata Model And Cubic regression