AMTD
3, 3877–3906, 2010Retrieval of macrophysical cloud
parameters from MIPAS
J. Hurley et al.
Title Page Abstract Introduction Conclusions References Tables Figures
◭ ◮
◭ ◮
Back Close Full Screen / Esc
Printer-friendly Version Interactive Discussion
Discussion
P
a
per
|
Dis
cussion
P
a
per
|
Discussion
P
a
per
|
Discussio
n
P
a
per
|
Atmos. Meas. Tech. Discuss., 3, 3877–3906, 2010 www.atmos-meas-tech-discuss.net/3/3877/2010/ doi:10.5194/amtd-3-3877-2010
© Author(s) 2010. CC Attribution 3.0 License.
Atmospheric Measurement Techniques Discussions
This discussion paper is/has been under review for the journal Atmospheric Measure-ment Techniques (AMT). Please refer to the corresponding final paper in AMT
if available.
Retrieval of macrophysical cloud
parameters from MIPAS: algorithm
description and preliminary validation
J. Hurley, A. Dudhia, and R. G. Grainger
Atmospheric, Oceanic and Planetary Physics, Clarendon Laboratory, Department of Physics, Parks Road, Oxford
Received: 16 August 2010 – Accepted: 17 August 2010 – Published: 26 August 2010 Correspondence to: J. Hurley ([email protected])
AMTD
3, 3877–3906, 2010Retrieval of macrophysical cloud
parameters from MIPAS
J. Hurley et al.
Title Page Abstract Introduction Conclusions References Tables Figures
◭ ◮
◭ ◮
Back Close Full Screen / Esc
Printer-friendly Version Interactive Discussion
Discussion
P
a
per
|
Dis
cussion
P
a
per
|
Discussion
P
a
per
|
Discussio
n
P
a
per
|
Abstract
The Michelson Interferometer for Passive Atmospheric Sounding (MIPAS) onboard EN-VISAT has the potential to be particularly useful for studying high, thin clouds, which have been difficult to observe in the past. This paper details the development, imple-mentation and testing of an optimal-estimation-type retrieval for three macrophysical
5
cloud parameters (cloud top height, cloud top temperature and cloud extinction co-efficient) from infrared spectra measured by MIPAS, employing additional information derived to improve the choice of a priori. The retrieval is applied and initially validated on MIPAS data. From application to MIPAS data, the retrieved cloud top heights are assessed to be accurate to within 50 m, the cloud top temperatures to within 0.5 K
10
and extinction coefficients to within a factor of 15%. This algorithm has been adopted by the European Space Agency’s “MIPclouds” project, which itself recognises the po-tential of MIPAS beyond monitoring atmospheric chemistry and seeks to study clouds themselves rigorously using MIPAS.
1 Introduction
15
Although much of atmospheric infrared remote sensing is based upon analysis of data to estimate constituent concentrations – where the presence of cloud particles in the measurements is treated as a source of error – it is possible to isolate measurements of cloud in order to determine the properties of clouds themselves. Arguably clouds (especially high cloud such as cirrus) represent one of the largest uncertainties in
cli-20
mate studies (Intergovernmental Panel on Climate Change, 2008) – and in order to have reliable estimates of radiative forcing and climatic impact, accurate distributions of cloud frequencies and properties must be available. Satellite instruments provide an opportunity to study the properties of clouds on a global scale.
AMTD
3, 3877–3906, 2010Retrieval of macrophysical cloud
parameters from MIPAS
J. Hurley et al.
Title Page Abstract Introduction Conclusions References Tables Figures
◭ ◮
◭ ◮
Back Close Full Screen / Esc
Printer-friendly Version Interactive Discussion
Discussion
P
a
per
|
Dis
cussion
P
a
per
|
Discussion
P
a
per
|
Discussio
n
P
a
per
|
1.1 Overview of MIPAS-ENVISAT
The Michelson Interferometer for Passive Atmospheric Sounding (MIPAS) is an infrared limb-viewing instrument and was launched in March 2002 on the European Space Agency’s Environmental Satellite (ENVISAT) which, with large inclination on a polar orbit in conjunction with azimuth scanning, enables global coverage pole-to-pole
(Eu-5
ropean Space Agency, 2005).
MIPAS was designed to measure limb-emission spectra (primarily for trace gases such as CO2(used to retrieve pressure and temperature), O3, H2O, HNO3, CH4, N2O
and NO2) at a high spectral resolution in the near- to mid-infrared from 685 cm−1
to 2410 cm−1
. In its initial phase, MIPAS operated at a spectral sampling of 0.025 cm−1
,
10
measuring spectra nominally every 3 km vertically in the troposphere – however fol-lowing persistent slide malfunctions in early 2004, the sampling was decreased to 0.0625 cm−1
but the measurement frequency increased to nominally every 1.5 km in the troposphere (Mantovani, 2005).
1.2 Overview of clouds from satellites
15
Cloud properties fall loosely into two categories: macrophysical and microphysical. Macrophysical properties are those which could be observed by the naked eye, such as the altitude of a cloud, the physical depth and extent of a cloud, or are basic ther-modynamic quantities, such as the temperature at the cloud top or the temperature structure within the cloud body. Microphysical parameters are, by opposition, those
20
which are too small to easily observe – such as the size and shape of cloud particles, and their distribution (which is often described in terms of water content), thus includ-ing properties such as number density, and influencinclud-ing cloud optical depth, albedo, emissivity and transmissivity.
Whilst most of our knowledge of the microphysical properties of clouds come from
25
AMTD
3, 3877–3906, 2010Retrieval of macrophysical cloud
parameters from MIPAS
J. Hurley et al.
Title Page Abstract Introduction Conclusions References Tables Figures
◭ ◮
◭ ◮
Back Close Full Screen / Esc
Printer-friendly Version Interactive Discussion
Discussion
P
a
per
|
Dis
cussion
P
a
per
|
Discussion
P
a
per
|
Discussio
n
P
a
per
|
1992, SUCCESS over Oklahoma and Kansas, 1996, CEPEX, 1997, EUCREX over the Atlantic Ocean and mid-latitudes in Europe, 2000, and CRYSTAL-FACE over Florida, 2002), satellite instruments are particularly well-suited to observing macrophysical parameters, not least because of the large-scale geographical regions they survey. As a general rule, limb-viewing instruments are competent at retrieving
vertically-5
dependent parameters (such as cloud top height/pressure or cloud depth) with great accuracy, although have poorer horizontal-resolving potential – but are able to detect even the thinnest of clouds due to the inherently long limb pathlength. On the contrary, nadir-viewing instruments suffer from poor vertical resolution when retrieving atmo-spheric temperature and composition from which cloud top temperatures (and hence
10
cloud top heights/pressures) are derived, are limited to thicker clouds, but have very good horizontal resolution. Different spectral ranges are sensitive to different cloud properties: for instance, microwave instruments often are not sensitive to ice cloud particles, whereas visible and infrared instruments are often limited to the first layer of cloud encountered and unable to measure below. It is thus important to choose to
15
retrieve cloud properties appropriate to the satellite instrument’s capabilities.
There have been many studies on clouds over the years producing climatologies: by Barton (1983), Warren et al. (1985), Woodbury and McCormick (1983), Prabhakara et al. (1988), Wylie and Menzel (1989), Wylie et al. (1994) – but these were all limited by a lack of global coverage. Currently, the Stratospheric Aerosol and Gas
Experi-20
ment (SAGE) (e.g., SAGE-III-ATBD-Team, 2002), the High Resolution Infrared Radi-ation Sounder (HIRS) instrument (e.g., Wylie et al., 2005), the InternRadi-ational Satellite Cloud Climatology Project (ISCCP) (e.g., ISCCP, 2008) and the GRAPE project (e.g., Thomas et al., 2010) are actively compiling cloud climatologies. However, past and cur-rent cloud detection algorithms often miss much thin cloud in satellite measurements
25
– and hence conventional cloud climatologies and inventories are in no way complete with respect to high thin cloud such as cirrus (Wylie et al., 2005). In fact, with the ex-ception of SAGE, limb-viewing has not been used for cloud measurements since such instruments tend to target atmospheric composition for which cloud detection is the
AMTD
3, 3877–3906, 2010Retrieval of macrophysical cloud
parameters from MIPAS
J. Hurley et al.
Title Page Abstract Introduction Conclusions References Tables Figures
◭ ◮
◭ ◮
Back Close Full Screen / Esc
Printer-friendly Version Interactive Discussion
Discussion
P
a
per
|
Dis
cussion
P
a
per
|
Discussion
P
a
per
|
Discussio
n
P
a
per
|
only requirement, and limb-viewing cloud campaigns tend to be experimental rather than operational, hence yielding only short-time-series over a limited geographical re-gion. Given that MIPAS should be quite sensitive to high, thin cloud if an appropriate detection mechanism is employed, it is a natural candidate to contribute climatological information about these clouds.
5
Retrieval of cloud parameters from instruments such as MIPAS, although highly instrument-specific, are dependent upon cloud-detection algorithms as estimators of cloud location (cloud top height/pressure/depth), and as selectors of data upon which retrieval schemes are run. Generally, cloud detection methods for limb-viewing and solar occultation IR instruments (such as MIPAS) are based upon a
10
– threshold on: radiance (such as the Cryogenic Limb Array Etalon Spectrometer CLAES experiment CLAES, 2007, and High Resolution Dynamics Limb Sounder HIRDLS, Lambert et al. 1999), transmission (Atmospheric Trace Molecule Spec-troscopy ATMOS experiment, Kahn et al., 2002), extinction (Improved Strato-spheric and MesoStrato-spheric Sounder ISAMS, Global Change Master Directory,
15
2007, the Halogen Occultation Experiment HALOE, Hervig and Deshler, 2002, and the Atmospheric Chemistry Experiment ACE, Bernath, 2002) or volume mix-ing ratio (the Limb Infrared Monitor of the Stratosphere LIMS, NASA, 2007), which exploit the fact that clouds introduce increased radiance and extinction, but de-creased transmission and a decrease in certain specific constituent volume
mix-20
ing ratios, such as ozone;
– discontinuity in: vertical gradients of extinction (the HALOE, or of trace gas con-centrations such as ozone (the LIMS), which are introduced by large gradients at the cloud top; and
– contrast in spectral structure: (the Cryogenic Infrared Spectrometers and
Tele-25
AMTD
3, 3877–3906, 2010Retrieval of macrophysical cloud
parameters from MIPAS
J. Hurley et al.
Title Page Abstract Introduction Conclusions References Tables Figures
◭ ◮
◭ ◮
Back Close Full Screen / Esc
Printer-friendly Version Interactive Discussion
Discussion
P
a
per
|
Dis
cussion
P
a
per
|
Discussion
P
a
per
|
Discussio
n
P
a
per
|
al., 2009), which rely upon spectral differences introduced by cloud as opposed to those present in cloud-free spectra.
The act of detection yields cursory information on cloud frequency of occurrence and a preliminary measure of cloud top height. In terms of other retrieved cloud parameters, it should be noted that of the instruments discussed ACE, ATMOS, CLAES, HALOE,
5
HIRDLS, and ISAMS operationally retrieve(d) extinction.
1.3 Cloud information from MIPAS
There have been several attempts to retrieve cloud parameters from MIPAS spectra. Firstly, the Monte Carlo Cloud Scattering Forward Model (McCloudsFM) is a multi-scattering model developed by Ewen (2005) to accurately model IR limb emission
10
measurements of cirrus clouds, parameterised by effective radius, number density, cloud top height and cloud depth; however, the computational time associated with the retrieval was prohibitively large, and could not be justified given assumptions made in scattering properties and a priori biases. Secondly, the Earth Observation Sci-ence Group at the University of Leicester produces near-real-time cloud top heights
15
from MIPAS spectra from May 2008 onwards (Moore, 2008). The cloud top heights are retrieved using the operational cloud detection method called the Colour Index (CI) Method (Spang, 2004) such that the amount of cloud occuring in a given FOV is roughly anti-correlated with the value of CI. Leicester simply reports the tangent altitude at which cloud is first encountered in the MIPAS scan pattern as the cloud
20
top height. Finally, the Karlsruhe Optimised and Precise Radiative transfer Algorithm (KOPRA) provides accurate simulations of single-scattering clouds in a horizontally symmetric atmosphere, specific to MIPAS. KOPRA has been used to simulate diff er-ent cloud types, such as cirrus, liquid water clouds, and various types of PSCs – and thus can be used to retrieve the modelled microphysical properties (IMK, 2008) under
25
certain circumstances.
AMTD
3, 3877–3906, 2010Retrieval of macrophysical cloud
parameters from MIPAS
J. Hurley et al.
Title Page Abstract Introduction Conclusions References Tables Figures
◭ ◮
◭ ◮
Back Close Full Screen / Esc
Printer-friendly Version Interactive Discussion
Discussion
P
a
per
|
Dis
cussion
P
a
per
|
Discussion
P
a
per
|
Discussio
n
P
a
per
|
To this end a more comprehensive and operational cloud parameter retrieval algo-rithm specific to MIPAS has been developed – and has been adopted as the macro-physical cloud parameter retrieval of the “MIPclouds” project (e.g., Spang et al., 2008). In this work, a non-scattering forward model of the radiation emitted by a cloud in the MIPAS FOV is described, in terms of three macrophysical parameters: cloud top height,
5
top temperature and extinction coefficient. The inverse problem is addressed using an adaptation of standard retrieval theory: a sequential retrieval in which the first guess and a priori are chosen using an estimate of cloud amount.
2 Algorithm description
The retrieval of macrophysical parameters from a set of MIPAS spectra constituting
10
a single limb-scan is a three-stage process applied independently in different spectral intervals (“microwindows”). These stages are:
1. Isolating the continuum radiance from each spectrum;
2. Retrieving the Cloud Effective Fraction to locate the spectrum containing the cloud-top; and
15
3. Retrieving the macrophysical parameters from this and vertically adjacent spectra within the limb scan pattern.
The results from each microwindow are combined to produce a best estimate of the parameters, and an associated error covariance.
2.1 Microwindows
20
AMTD
3, 3877–3906, 2010Retrieval of macrophysical cloud
parameters from MIPAS
J. Hurley et al.
Title Page Abstract Introduction Conclusions References Tables Figures
◭ ◮
◭ ◮
Back Close Full Screen / Esc
Printer-friendly Version Interactive Discussion
Discussion
P
a
per
|
Dis
cussion
P
a
per
|
Discussion
P
a
per
|
Discussio
n
P
a
per
|
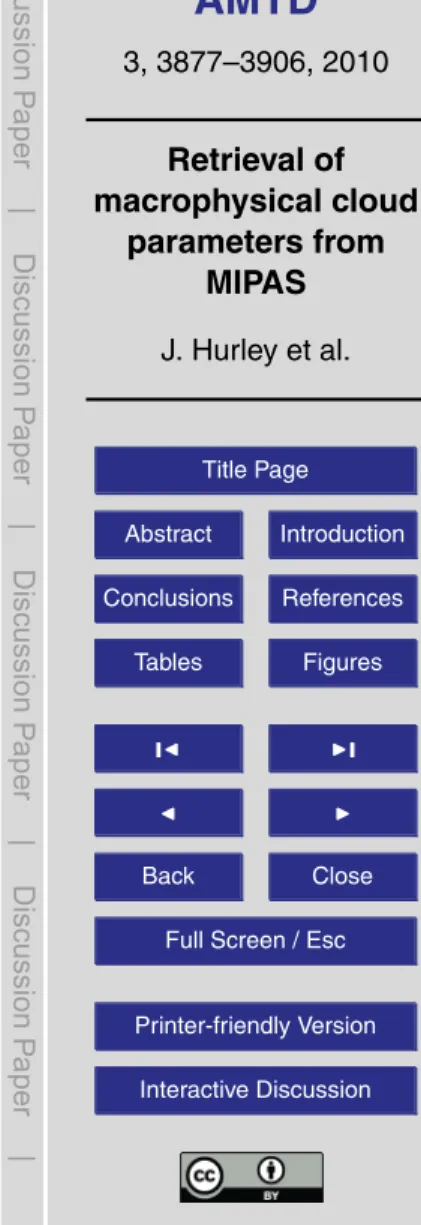
et al., 2002) optimised for a joint retrieval of continuum and temperature. Figure 1 shows the positions of these microwindows relative to molecular emission features. Note that each microwindow contains CO2 lines (for the temperature retrieval,
dis-cussed further in Sect. 2.3) whilst avoiding significant contributions from more variable gases such as H2O.
5
2.2 Continuum radiance
Using pre-computed molecular transmittance spectra,τν, for each altitude (based on climatological concentrations, and calculated using the radiative transfer model, the Reference Forward Model (RFM), Dudhia, 2005) it is possible to identify spectral points where molecular contributions are expected to be negligible (e.g. where τν>0.95). It
10
should be noted that at these wavenumbers molecular scattering is also negligible. The continuum radiance,R, and associated error, can then be established by a sim-ple mean and standard error (i.e. using standard deviation D such that the standard error is defined asD/p(n−1), wherenis the number of points averaged). By assigning
an error value based on the actualDrather than the instrument noise, some allowance
15
is made for any residual molecular contributions.
2.3 Cloud effective fraction
The next step is to identify the spectrum containing the cloud-top. One approach could be to use a simple threshold value on the continuum radiance, but since the continuum radiance is a strong function of atmospheric temperature as well as cloudiness, finding
20
a suitable threshold value is difficult. The standard MIPAS Cloud Index (CI) method (Spang et al., 2004) attempts to overcome this temperature dependence by taking the ratio of radiance in two spectral regions (792–796 cm−1
and 832–834 cm−1
) which react differently to cloud presence. The physical basis of the CI method is that as the field-of-view (FOV) reaches the limit of being geometrically-fully-filled with opaque cloud,
25
the CI→1 (as the cloud continuum radiance overwhelms the gaseous contribution to
AMTD
3, 3877–3906, 2010Retrieval of macrophysical cloud
parameters from MIPAS
J. Hurley et al.
Title Page Abstract Introduction Conclusions References Tables Figures
◭ ◮
◭ ◮
Back Close Full Screen / Esc
Printer-friendly Version Interactive Discussion
Discussion
P
a
per
|
Dis
cussion
P
a
per
|
Discussion
P
a
per
|
Discussio
n
P
a
per
|
the spectral signature) whereas in the cloud-free limit, CI is large. Here, instead, it is preferable to have a scheme dependent upon the continuum radiance within each MW independently, as well as one having a more physical basis. This is done via retrieval of a “Cloud Effective Fraction” (CEF).
The CEF is defined as the fraction of the FOV covered by an optically thick,
isother-5
mal cloud with a horizontal cloud-top that would give the same continuum radiance as the observed cloud, assuming both have the same Cloud Top Temperature (CTT). Thus a single parameterα (the CEF), can be used to describe the infinite range possible of cloud extinctions and spatial distributions within the actual FOV (although the concept of a single well-defined CTT in all such cases is questionable). Thusα varies from 0
10
(cloud-free) to 1 (thick cloud completely filling the FOV) with intermediate values which may be correspond either to thick cloud filling a small part of the FOV or thin cloud filling a larger fraction.
Mathematically, the CEF,α, is defined as
α=Rc Bc
(1)
15
where Rc is the continuum radiance Bc is the (spectrally averaged) Planck function
corresponding to the CTT.
To retrieve the CEF from a single microwindow spectrum, it is assumed that the ob-served radiance can be represented as originating from a homogeneous path with the lower fractionαcorresponding to an optically thick cloud whilst the upper fraction (1−α) 20
originates from molecular emission features above the cloud but at the same local tem-perature as the cloud-top. Thus, the spectrally varying radiance Rν, is approximated
as
Rν=αBc+(1−α)Bc(1−τν) (2)
where τν the same pre-computed (climatological) molecular transmittance used in
25
AMTD
3, 3877–3906, 2010Retrieval of macrophysical cloud
parameters from MIPAS
J. Hurley et al.
Title Page Abstract Introduction Conclusions References Tables Figures
◭ ◮
◭ ◮
Back Close Full Screen / Esc
Printer-friendly Version Interactive Discussion
Discussion
P
a
per
|
Dis
cussion
P
a
per
|
Discussion
P
a
per
|
Discussio
n
P
a
per
|
Although clearly a gross simplification, it can be made more realistic by
(a) using microwindows containing only CO2 lines rather than more variable
ab-sorbers, in which case the climatologicalτv is likely to be reasonably accurate;
(b) limiting the fit to spectral points with relatively high transmittance (e.g.τν>0.75), in which case the assumption of molecular emission originating near the cloud top
5
is more likely to be valid.
In practice, this works better ifBcis constrained by a priori information – for instance,
by using a temperature climatology. A simple, iterative optimal estimation scheme (similar to Eq. 3) is run to solve Eq. (2) forα.
The cloud-top is identified as lying in the highest altitude spectrum whereα>0.1.
10
The retrieved value ofα is also used as a “measurement” in the macrophysical pa-rameter retrieval itself (Sect. 2.4). In principle, Eq. (2) also yields an “improved” esti-mate ofBcbut, given the crudeness of this approximation, it is preferred to re-use the
original climatological temperature profile.
2.4 Macrophysical parameter retrieval
15
The macrophysical parameters are retrieved using an iterative optimal estimation scheme (Rodgers, 2000):
xi+1=xi+
KTiS−1
y Ki+S
−1
a −1
(KTiS−1
y (y−fi)−S
−1
a (xi−a)) (3)
where subscript i denotes the iteration number, x contains the parameters to be
re-20
trieved,ycontains the measurements,fis the forward model (Sect. 2.5) applied to the current iteration ofx,Kis the Jacobian matrix containing elements∂f/∂x,Sy is the er-ror covariance matrix ofy,ais the a priori estimate ofxandSais the error covariance ofa. These components are described in the following sections.
AMTD
3, 3877–3906, 2010Retrieval of macrophysical cloud
parameters from MIPAS
J. Hurley et al.
Title Page Abstract Introduction Conclusions References Tables Figures
◭ ◮
◭ ◮
Back Close Full Screen / Esc
Printer-friendly Version Interactive Discussion
Discussion
P
a
per
|
Dis
cussion
P
a
per
|
Discussion
P
a
per
|
Discussio
n
P
a
per
|
2.4.1 State vector
The state vectorxcontains the parameters to be retrieved, and in this case is defined as
x≡
zc
Bc
µc
(4)
wherezcis the cloud-top height (CTH),Bcis the Planck function evaluated at the
cloud-5
top temperatureTc(CTT) at the mid-point of the microwindow, andµc=log10kc, where
kc is the extinction coefficient (in km
−1
), which is a measure of the cloud extinction (CEX).
2.4.2 Measurement vector
The vectory, containing the measurements used for the retrieval, is defined as
10
y≡
Ru Rc
Rl
α
(5)
whereRcis the continuum radiance (Sect. 2.2) from the FOV containing the cloud-top,
having the retrieved cloud effective fraction α, whileRu and Rl are the continuum
ra-diances from the FOVs immediately above and below. The measurement covariance matrixSy is diagonal, with variances given by the errors from the continuum radiance
15
and CEF retrieval. Although Rc and α are derived from the same spectrum, the
ar-gument is that α depends on the spectral structure whereas Rc is derived from the
spectrally flat regions – and hence the two may be regarded as independent.
The radianceRu from the FOV above the cloud-top is expected to have a value∼0
(since the CEF for this FOV will have been retrieved with a value <0.1, Sect. 2.3)
AMTD
3, 3877–3906, 2010Retrieval of macrophysical cloud
parameters from MIPAS
J. Hurley et al.
Title Page Abstract Introduction Conclusions References Tables Figures
◭ ◮
◭ ◮
Back Close Full Screen / Esc
Printer-friendly Version Interactive Discussion
Discussion
P
a
per
|
Dis
cussion
P
a
per
|
Discussion
P
a
per
|
Discussio
n
P
a
per
|
and serves simply to constrain the retrieval from placing the cloud-top too high. The inclusion of the CEF in the measurement vector is discussed in the next section.
2.4.3 A priori information
This scheme essentially attempts to retrieve three macrophysical parameters from two non-zero continuum measurements,RcandRl. The usual method for dealing with such
5
under-determined problems is to supply independent a priori information. Due to the spatial inhomogeneity of cloud structures, obtaining useful direct a priori information on any of the three retrieved parameters is impractical – however, there are indirect a priori constraints on therelationshipsbetween the retrieved parameters.
The first a priori constraint is represented by the CEF and is more conveniently
in-10
troduced into the measurement vector itself (αin Eq. 5) rather than in the conventional a priori state vector a. This acts as a constraint on the CTH and CEX values, as described in Sect. 2.3.
A second source of a priori information is the background temperature profile (ob-tained, for example, from climatology or meteorological analysis fields). Assuming this
15
is not significantly perturbed in the presence of clouds, this acts as a constraint on the CTH and CTT, since the cloud-top temperature would be expected to correspond to a point on this profile.
Having identified the spectrum containing the cloud-top, the a priori estimate for the cloud-top height is set as the nominal tangent height for that measurementzt, and its
20
corresponding uncertaintyσza set to±1 km (cf. effective FOV width∼±1.5 km).
For this altitude, the background temperature profile provides an equivalent radiance
Bt, and uncertainty σBt which is typically equivalent to a temperature uncertainty of ±10 K. However, uncertainty with whichz
t represents the actual cloud-top height, and
the variation of radiance with altitudeb=d B/d z(see Eq. 8) also have to be taken into
25
account when calculating the a priori covariance matrix elements.
There is no reasonable a priori estimate for optical thickness so it is just set at a typ-ical mid-range value (e.g.µa=−2.5) with a large uncertainty σµa=±0.5, to capture the
AMTD
3, 3877–3906, 2010Retrieval of macrophysical cloud
parameters from MIPAS
J. Hurley et al.
Title Page Abstract Introduction Conclusions References Tables Figures
◭ ◮
◭ ◮
Back Close Full Screen / Esc
Printer-friendly Version Interactive Discussion
Discussion
P
a
per
|
Dis
cussion
P
a
per
|
Discussion
P
a
per
|
Discussio
n
P
a
per
|
range of extinction for which the cloud forward model (Sect. 2.5) is applicable. Thus the a priori vector is given by
a=
zt
Bt
µa
(6)
Assuming that the Planck function varies linearly with altitude (Eq. 8), the covariance is given by
5
Sa=
σz2a b2σz2a 0
b2σz2a σB2
t+b
2
σz2a 0
0 0 σµ2a
(7)
2.5 Cloud forward model
The essential assumption within the macrophysical retrieval scheme is that a cloud can be represented as a homogeneous “grey” absorber characterised by just three retrieved parameters (the cloud top height zc, the cloud-top temperature Tc and the
10
cloud extinctionkc).
In addition, it is assumed that the Planck function (evaluated at the spectral mid-point of the microwindow in question) varies linearly with altitude within the cloud with a known gradient, such that
B(z)=Bc+b(z−zc) (8)
15
whereBc≡B(Tc) is the Planck function for the cloud top temperature, andb=d B/d zis
the vertical gradient (b<0 in the troposphere, b>0 in the stratosphere), derived from an external (e.g. climatological) estimate of the background atmospheric temperature profile.
The cloud forward modelfcalculates the continuum radiance originating from a cloud
20
described byzc,Tcandkc, and assumes that there is no spectral variation in absorption
AMTD
3, 3877–3906, 2010Retrieval of macrophysical cloud
parameters from MIPAS
J. Hurley et al.
Title Page Abstract Introduction Conclusions References Tables Figures
◭ ◮
◭ ◮
Back Close Full Screen / Esc
Printer-friendly Version Interactive Discussion
Discussion
P
a
per
|
Dis
cussion
P
a
per
|
Discussion
P
a
per
|
Discussio
n
P
a
per
|
2.5.1 Pencil-beams
The continuum radianceLt of a pencil-beam (i.e. infinitesimal solid-angle) viewing at
tangent heightzt within the cloud (i.e.zt<zc) is given by the standard radiative transfer
equation for local thermodynamic equilibrium, assuming no molecular contributions from the atmosphere itself, and no scattering:
5
Lt=
Z
s
B(s)d τ
d sd s (9)
whereB(s) is the Planck function (evaluated at the spectral mid-point of the microwin-dow) along the paths, andτ(s) is the transmittance along the paths, given by
τ=exp(−k
cs). (10)
Using simple circular geometry (ignoring refraction and assuming the Earth’s radius,
10
re≫z), the path distance and altitude relative to the tangent point values are related by
(s−st)2≃2re(z−zt). (11)
Equation (9) can then be solved to give
Lt= Bc+
b rekc2
!
(1−τ)−
bs
2rekc
(1+τ). (12)
The appearance of the retrieved parameterkc in the denominator makes this
poten-15
tially numerically unstable in the optically-thin limit, so a more computationally robust approximation is preferred, such that
Lt≃
Bc+
2
3b(zt−zc)τ
(1−τ), (13)
which agrees with the exact solution in the asymptotic limits of transmittance. In the op-tically thick limit (τ=0) cloud effectively just emits from its upper surface andLt →Bc,
20
AMTD
3, 3877–3906, 2010Retrieval of macrophysical cloud
parameters from MIPAS
J. Hurley et al.
Title Page Abstract Introduction Conclusions References Tables Figures
◭ ◮
◭ ◮
Back Close Full Screen / Esc
Printer-friendly Version Interactive Discussion
Discussion
P
a
per
|
Dis
cussion
P
a
per
|
Discussion
P
a
per
|
Discussio
n
P
a
per
|
as expected, while in the optically thin limit (τ → 1) the emission effectively comes
from the point one third of the vertical distance from the tangent point to the cloud-top,
Lt → (13Bc+23Bt)(1−τ), whereBt≡B(zt) from Eq. (8).
2.5.2 FOV convolution
The MIPAS FOV response function is represented by a vertical trapezium with a 4 km
5
base and a 2.8 km top when projected onto the atmospheric limb. With tangent heights spaced at 3 km intervals for the original full-resolution measurements, this gives a small overlap between adjacent measurements, but a much larger overlap for the 1.5 km spacing used in the “optimised-resolution” measurements employed since 2005.
This FOV function φ is sampled at N points (in practice, N=9), which determine
10
the altitudeszj for which the pencil-beam calculations are performed. The measured continuum radiance is then represented by a numerical convolution of the pencil-beam radiances at these altitudes (Ltj), such that
R=
N X
j=1
ajLtj (14)
where the coefficients aj are determined according to the assumption that the FOV 15
response function and the cloud radiance vary linearly between calculated points, but that the radiance varies as a step function in the interval containing the cloud-top.
2.5.3 Cloud effective fraction
As mentioned in Sect. 2.4.2, the CEF defined in Eq. (1) is included in the measurement vector, therefore has to be evaluated by the forward model. Using Eq. (14)
20
α=
PN j=1ajLtj
Bc
AMTD
3, 3877–3906, 2010Retrieval of macrophysical cloud
parameters from MIPAS
J. Hurley et al.
Title Page Abstract Introduction Conclusions References Tables Figures
◭ ◮
◭ ◮
Back Close Full Screen / Esc
Printer-friendly Version Interactive Discussion
Discussion
P
a
per
|
Dis
cussion
P
a
per
|
Discussion
P
a
per
|
Discussio
n
P
a
per
|
Noting that, for optically thick cloud, Lt∼Bc (Eq. 13) for pencil-beams which
inter-sect the cloud, andLt=0 for pencil-beams above the cloud top, this expression for α
effectively just depends on the weightsaj, which depend only onzt.
2.5.4 Definition of cloud forward model
Thus, the cloud forward modelfis simply Eq. (14) applied to each of the FOVs available
5
in the measurement vectory, along with the definition of the CEF,α, given in Eq. (15). Furthermore, since these are analytic expressions, analytic derivatives are used to calculate elements of the Jacobian matrixK.
2.6 Combining microwindow results
2.6.1 Statistical combination
10
Retrievals,xk, and associated covariances,Sxk, are obtained from each of theM=10 microwindows. These results can then be combined using the standard statistical pro-cedure for independent estimates, such that
ˆ
S−x1=
M X
k=1
(Sxk)−1
(16)
ˆ
x=Sˆx
M X
k=1
(Sxk)−1xk (17)
15
where ˆxand ˆSx represent the combined estimate and its covariance. There is an
as-sumption here that the retrieved parameters do not vary spectrally – at least across the tens of wavenumbers represented by the selected microwindows (cloud-top radi-ances are converted to cloud-top temperatures prior to the combination). Extinction, of course, does vary spectrally – however over the small spectral range sampled by the
20
AMTD
3, 3877–3906, 2010Retrieval of macrophysical cloud
parameters from MIPAS
J. Hurley et al.
Title Page Abstract Introduction Conclusions References Tables Figures
◭ ◮
◭ ◮
Back Close Full Screen / Esc
Printer-friendly Version Interactive Discussion
Discussion
P
a
per
|
Dis
cussion
P
a
per
|
Discussion
P
a
per
|
Discussio
n
P
a
per
|
MWs, this variation is not great. It also ignores the fact that the same a priori temper-ature climatology is used for each estimate, so the separate microwindow results are not strictly independent.
2.6.2 Spike tests
This combination step also allows a spike-test to be applied – that is, a removal of
5
results from any microwindows which deviate significantly from the mean. The χ2
statistic is computed for each microwindow individually
χk2=(xk−xˆ)TSˆ
−1
x (xk−xˆ), (18)
and if the microwindow with the highest χ2 value exceeds the average χ2 by some factor (e.g. 2) its results are removed from the combination and the test repeated for
10
the remaining microwindows.
2.6.3 Error inflation
In theory, the covariance ˆSx should contain the random error information on the re-trieved values. However, it is recognised that this is an optimistic assumption since it makes no allowance for the forward model errors or approximations. If the different
15
microwindows produce a large scatter of results, then the standard deviationDof this distribution is likely to be a better estimate of the actual uncertainty, although this does not necessarily allow for forward model errors either since all microwindows make the same assumptions. A three-element vector of scale-factorseis constructed to take the maximum of these, such that
20
em=max
1,Dm σm
(19)
AMTD
3, 3877–3906, 2010Retrieval of macrophysical cloud
parameters from MIPAS
J. Hurley et al.
Title Page Abstract Introduction Conclusions References Tables Figures
◭ ◮
◭ ◮
Back Close Full Screen / Esc
Printer-friendly Version Interactive Discussion
Discussion
P
a
per
|
Dis
cussion
P
a
per
|
Discussion
P
a
per
|
Discussio
n
P
a
per
|
The retrieval covariance is then “inflated” to produce the final covariance, such that ˆ
S′x mm=e2mSˆx mm. (20)
2.7 Operational considerations
The retrieval scheme described attempts to extract the maximum cloud information (i.e. three parameters) from the spectra, and assumes that continuum radiances from the
5
FOV containing the cloud-top, as well as the FOV immediately below, are available (Rc
andRl).
In an operational processor, it is desirable to have alternative schemes available to perhaps retrieve fewer parameters in situations where the full retrieval fails (due to an insufficient number of microwindows providing retrievals which converge or pass the
10
spike test), or if insufficient measurements are available (most commonly when the cloud-top is detected in the lowest spectrum in the limb scan).
Assuming that a cloud-top has been detected somewhere in the scan, the opera-tional algorithm attempts the following retrieval schemes in sequence until one returns valid results for at least three microwindows.
15
1. If available, using the measurement from the sweep below the cloud-topRl (i.e.
the cloud-top not located in the lowest sweep in the scan), with a priori extinction information given byµa=−2.5 (i.e. mid-range value). This is the full three
param-eter retrieval (zc,Tc,µc) from three measurements (Rc,Rl,α) (plus the nominally
zero radiance measurementRufrom the sweep above the cloud-top).
20
2. As (1) but settingµa=−1.0, giving a “thick cloud” assumption (kc=0.1 km−1). Such
a large initial guess value of extinction reduces the Jacobians with respect to this parameter to nearly zero, effectively leaving just two parameters (zc,Tc) to be
retrieved from three measurements (Rc,Rl,α).
3. As (2) but withoutRl – that is, the “thick cloud” assumption allowing for retrieval
25
of two parameters (zc,Tc) from only one sweep using two measurements (Rc,α).
AMTD
3, 3877–3906, 2010Retrieval of macrophysical cloud
parameters from MIPAS
J. Hurley et al.
Title Page Abstract Introduction Conclusions References Tables Figures
◭ ◮
◭ ◮
Back Close Full Screen / Esc
Printer-friendly Version Interactive Discussion
Discussion
P
a
per
|
Dis
cussion
P
a
per
|
Discussion
P
a
per
|
Discussio
n
P
a
per
|
This relies on the CEF retrieval in order to separate the two parameters.
3 Preliminary validation and application of algorithm
3.1 Example results: 1 April 2003
In this section, all measurements registered by MIPAS on 1 April 2003 have been pro-cessed using the described algorithm to highlight the products calculated and available
5
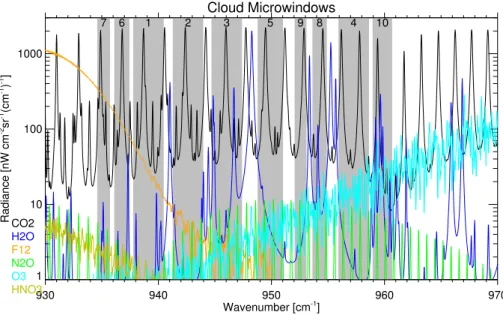
for further analysis. Figure 2 shows the retrieved values of CTH, CTT and CEX, along with the errors stemming from the retrieval process itself (from the retrieval error co-variance matrix). Generally, the values reported are sensible. Furthermore, the types of retrieval, as discussed in Sect. 2.7, are identified by different symbols – and profiles in which there is deemed to be no cloud present are identified by a cross, giving an
in-10
dication of the proportion of vertical scans taken through the atmosphere having cloud present somewhere in the scan.
3.2 Application of algorithm to a test month: April 2003
As the algorithm seems capable to retrieve trustworthy estimates of the simulated cloud parameters, the algorithm can be applied with a degree of confidence to real MIPAS
15
data, and be expected to yield sensible results. A full month’s data taken in April 2003 is used as a test ensemble. Preliminary validation is carried out qualitatively, by com-paring results with the ISCCP high-cloud climatology (ISCCP, 2008) – keeping in mind that ISCCP infrared cloud products are determined from nadir-measurements (which will penetrate further vertically into clouds, and hence report lower cloud heights) and
20
AMTD
3, 3877–3906, 2010Retrieval of macrophysical cloud
parameters from MIPAS
J. Hurley et al.
Title Page Abstract Introduction Conclusions References Tables Figures
◭ ◮
◭ ◮
Back Close Full Screen / Esc
Printer-friendly Version Interactive Discussion
Discussion
P
a
per
|
Dis
cussion
P
a
per
|
Discussion
P
a
per
|
Discussio
n
P
a
per
|
It is immediately obvious that, with the chosen cloud detection method, the macro-physical cloud parameter retrieval presented here provides information on higher clouds (such as cirrus) which ISCCP clearly misses. MIPAS shows cloud top heights increasing toward the equator, which is expected due to increasing tropopause height toward the tropics, while ISCCP finds lowered cloud top heights at the equator.
Fur-5
thermore, ISCCP seems to predominately miss high cloud, as either a result of its cloud detection method, or its nadir-geometry. Cloud top temperatures are largely anti-correlated with cloud top heights in both the MIPAS and ISCCP results, as ex-pected. Comparing cloud opacities, it is qualitatively obvious that MIPAS sees – and retrieves – more thin cloud than does ISCCP, as supported by the relative frequency of
10
smaller extinction values reported over the globe – and particularly in regions such as the tropics where optically-thin cirrus is ubiquitous. This is a function of ISCCP prod-ucts having been retrieved from nadir measurements, which are typically sensitive only to cloud opacities larger than 0.01, highlighting again the suitability of limb-sounding instruments such as MIPAS for cloud analysis and study.
15
As well, analysis of the retrieved errors from the retrieval covariance matrixSx gives a quantitative estimate of the quality of the retrieved results. Figure 4 shows the dis-tribution of the retrieval errors for the month’s worth of MIPAS data. Generally, the retrieval is able to estimate the cloud top height within 50 m, cloud top temperature within 0.5 K, and extinction to within 15%.
20
Typically around 25% of sampled MIPAS scan profiles are cloud free throughout the atmosphere, about 40% of vertical scans are retrieved with the full Type 1 retrieval, whilst about 25% are retrieved with the Type 2 retrieval and about 10% with the Type 3 retrieval. The proportion of unsuccessful retrievals is less than 1%.
3.3 Comparison of CEF and CI detection mechanisms
25
Section 2.3 describes the method used to select measurements as containing cloud and as the CI Method is the traditionally used method, this section seeks to assert that the CEF is reasonable as a cloud detection method, and in fact, may capture more
AMTD
3, 3877–3906, 2010Retrieval of macrophysical cloud
parameters from MIPAS
J. Hurley et al.
Title Page Abstract Introduction Conclusions References Tables Figures
◭ ◮
◭ ◮
Back Close Full Screen / Esc
Printer-friendly Version Interactive Discussion
Discussion
P
a
per
|
Dis
cussion
P
a
per
|
Discussion
P
a
per
|
Discussio
n
P
a
per
|
optically-or-geometrically thin cloud. In this section, application of both CEF and CI cloud detection methods to the same set of spectra. This set of spectra is selected as all those spectra measured below 30 km above which the CEF method first detects a cloud top, which will give a realistic selection of clear and cloudy examples. Com-parison between the two detection mechanisms is made using real MIPAS data for all
5
measurements registered on 1 April 2003.
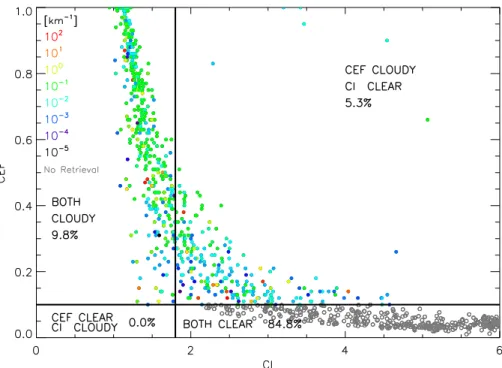
Figure 5 shows the results of this comparison, highlighting that the CEF scheme detects more cloud than does the CI method. It is plausible that the scatter of points at higher CI are indeed cloudy cases, as there appears to be larger scatter than at-tributable to normal variations of temperature and trace-species concentrations.
Fur-10
thermore, if the thresholds are applied and cloud detection is carried out, the CEF scheme detects more cloud particularly in regions where thin cloud such as polar stratospheric clouds or cirrus are expected. In general, the CEF method selects far more measurements as cloud-contaminated – which should yield a more complete selection of cloud data upon which to create climatological analysis.
15
It is worth noting that the percentage of spectra identified as containing cloud is de-pendent upon the choice of threshold applied to each detection method. For instance, at the operation threshold of 1.8, the CI method detects cloud in 9.8% of the studied set of spectra. The CEF method will select 9.8% of the spectra as containing cloud if its threshold is modified to 0.32 (instead of the suggested 0.1), although it is worth noting
20
that both methods do not choose all the same individual cases as cloud-contaminated. If the CI threshold for cloud is loosened to 4.0, it selects 17.6% of the spectra in the set as cloudy – a percentage which can be matched by setting the CEF threshold to 0.08. Application of CEF and CI cloud detection methods to MIPAS data highlights that the CEF method detects more possible cloud, including thin cloud which is so frequently
25
AMTD
3, 3877–3906, 2010Retrieval of macrophysical cloud
parameters from MIPAS
J. Hurley et al.
Title Page Abstract Introduction Conclusions References Tables Figures
◭ ◮
◭ ◮
Back Close Full Screen / Esc
Printer-friendly Version Interactive Discussion
Discussion
P
a
per
|
Dis
cussion
P
a
per
|
Discussion
P
a
per
|
Discussio
n
P
a
per
|
4 Conclusions
This study confirms that cloud top height, cloud top temperature and extinction co-efficient can be successfully retrieved by modelling clouds quite simply and by using an optimal estimation-type retrieval whereby an estimate for CEF initiates the retrieval close to the correct cost minimum. The retrieval algorithm has been tested and found
5
reliable on real MIPAS data. The retrieval errors associated with application of this algorithm to this data can be used to determine a measure of confidence for how well the forward model represents realistic scattering clouds. From this, CTH is retrieved to within 50 m, CTT to within 0.5 K and kextwithin a factor of 15% (these errors, associated with the retrieved parameters, are in the retrieval error covariance matrixSx), although
10
there do exist cases in which higher error exists.
It should be noted that the greatest error is expected to result from the error in the initial forward model assumption of horizontal homogeneity – that is, that a cloud can be represented by a single flat cloud top height, a single extinction coefficient and a consistent temperature structure throughout the body of the cloud. Horizontal
ho-15
mogeneity is a simplification of the geometry and optics of real clouds – but there are infinite possible cloud fields and it is impossible to retrieve inhomogeneous fillings of the MIPAS FOV without prior knowledge of the geometry of the inhomogeneity. Thus, whilst the assumption of horizontal homogeneity is insufficient to fully represent reality, it is the closest representation that can be accomplished without some other a priori
20
knowledge such as a limb imager coinciding with the FTS view.
Acknowledgements. Part of this work was done as part of a DPhil undertaken at the University of Oxford under the funding of the Commonwealth Scholarship Committee in the UK. Part of this work was supported by ESA through the MIPClouds project: “Cloud Information Retrieval from MIPAS Measurements”, AO/1-5255/06/I-OL.
25
AMTD
3, 3877–3906, 2010Retrieval of macrophysical cloud
parameters from MIPAS
J. Hurley et al.
Title Page Abstract Introduction Conclusions References Tables Figures
◭ ◮
◭ ◮
Back Close Full Screen / Esc
Printer-friendly Version Interactive Discussion
Discussion
P
a
per
|
Dis
cussion
P
a
per
|
Discussion
P
a
per
|
Discussio
n
P
a
per
|
References
Barton, I.: Upper-level cloud climatology from an orbiting satellite, J. Atmos. Sci., 40, 435–447, 1983. 3880
Bernath, P.: The Atmospheric Chemistry Experiment (ACE): An Overview, Geoscience and Remote Sensing Symposium, IGARSS ’02, 2002.
5
CLAES: Website on SPASCI CLAES Mission, www.spasci.com/CLAES/mission.html, 2007. Dudhia, A.: Website on the Reference Forward Model (RFM): Software User’s Manual (SUM),
http://www.atm.ox.ac.uk/RFM/sum/, 2005. 3884
Dudhia, A., Jay, V. L., and Rodgers, C. D.: Microwindow selection for high-spectral-resolution sounders, Appl. Optics, 41, 3665–3673, 2002. 3883
10
European Space Agency: website on ESA ENVISAT, http://envisat.esa.int/instruments/images/ MIPAS Interferometer.gif, 2005. 3879
Ewen, G.: Infrared Limb Observations of Cloud, DPhil thesis in Atmospheric, Oceanic and Planetary Physics, University of Oxford, Oxford, UK, 2005. 3882
Global Change Master Directory: Website on ISAMS, BADCDatasets:ISAMSWelcome,http: 15
//badc.nerc.ac.uk/data/isams/, 2010.
Hervig, M. and Deshler, T.: Evaluation of aerosol measurements from SAGE II, HALOE, and balloonborne optical particle counters, J. Geophys. Res., 107, AAC3.1–AAC3.12, 2002. Hurley, J., Dudhia, A., and Grainger, R. G.: Cloud detection for MIPAS using singular vector
decomposition, Atmos. Meas. Tech., 2, 533–547, doi:10.5194/amt-2-533-2009, 2009. 20
IMK: website on IMK Karlsruhe Optimized and Precise Radiative transfer Algorithm, http:// www-imk.fzk.de/asf/ame/publications/kopra docu/, 2008. 3882
Intergovernmental Panel on Climate Change: Fourth Assessment Report Climate Change 2007 – The Physical Science Basis, Cambridge University Press, Cambridge, 2008. 3878 ISCCP: website on ISCCP, http://isccp.giss.nasa.gov/index.html, 2008. 3880, 3895, 3897 25
Kahn, B., Eldering, A., Irion, F., Mills, F., Sen, B., and Gunson, M.: Cloud identification in atmospheric trace molecule spectroscopy infrared occultation measurement, Appl. Optics, 41, 2768–2780, 2002. 3881
Lambert, A., Bailey, B., Edwards, D., Gille, J., and Johnson, B.: High Resolution Dynamics Limb Sounder Level-2 Algorithm Theoretical Basis Document 2, Tech. rep., 1999.
30
AMTD
3, 3877–3906, 2010Retrieval of macrophysical cloud
parameters from MIPAS
J. Hurley et al.
Title Page Abstract Introduction Conclusions References Tables Figures
◭ ◮
◭ ◮
Back Close Full Screen / Esc
Printer-friendly Version Interactive Discussion
Discussion
P
a
per
|
Dis
cussion
P
a
per
|
Discussion
P
a
per
|
Discussio
n
P
a
per
|
Moore, D.: Website on University of Leicester Cloud Top Height product, http://www.leos.le.ac. uk/mipas/data/nrt ci.html, 2008. 3882
NASA: Website on GES Distributed Active Archive Center LIMS User’s Guide, ftp://disc1.sci. gsfc.nasa.gov/data/lims/Documentation/, 2007. 3881
Prabhakara, C., Fraser, R., Dalu, G., Wu, M., Curran, R., and Styles, T.: Thin cirrus clouds: 5
seasonal distribution over oceans deduced from NIMBUS-4 IRIS, J. Appl. Meteorol., 27, 379–399, 1988. 3880
Rodgers, C.: Inverse Methods for Atmospheric Sounding: Theory and Practice, World Scientific Publishing Co Pte Ltd, 2000. 3886
SAGE-III-ATBD-Team: SAGE III Algorithm Theoretical Basis Document (ATBD) Cloud Data 10
Products, LaRC 475-00-106, 1.2, Tech. rep., 2002. 3880
Thomas, G. E., Poulsen, C. A., Siddans, R., Sayer, A. M., Carboni, E., Marsh, S. H., Dean, S. M., Grainger, R. G., and Lawrence, B. N.: Validation of the GRAPE single view aerosol retrieval for ATSR-2 and insights into the long term global AOD trend over the ocean, Atmos. Chem. Phys., 10, 4849–4866, doi:10.5194/acp-10-4849-2010, 2010. 3880
15
Spang, R., Remedios, J., and Barkley, M.: Colour indices for the detection and differentiation of cloud types in infra-red limb emission spectra, Adv. Space Res., 33, 1041–1047, 2004. 3881, 3884
Spang, R., Griessbach, S., Hopfner, M., Dudhia, A., Hurley, J., Siddans, R., Waterfall, A., Reme-dios, J., and Sembhi, H.: Technical Note: Retrievability of MIPAS cloud parameter, ESA-ITT 20
AO/1-5255/06/I-OL, Tech. rep., European Space Agency, 2008. 3883
Warren, S., Hahn, C., and London, J.: Simultaneous occurrence of different cloud types, J. Clim. Appl. Meteorol., 24, 658–667, 1985. 3880
Woodbury, G. and McCormick, M.: Global distributions of cirrus clouds determined from SAGE data, Geophys. Res. Lett., 10, 1180–1183, 1983. 3880
25
Wylie, D. and Menzel, W.: Two years of cloud cover statistics using VAS, J. Clim. Appl. Meteo-rol., 2, 380–392, 1989. 3880
Wylie, D., Menzel, W., Woolf, H., and Strabala, K.: Four years of global cirrus cloud statistics using HIRS, J. Climate, 7, 1972–1986, 1994. 3880
Wylie, D., Jackson, D., Menzel, W., and Bates, J.: Trends in global cloud cover in two decades 30
of HIRS observations, J. Climate, 130, 3021–3033, 2005. 3880
AMTD
3, 3877–3906, 2010Retrieval of macrophysical cloud
parameters from MIPAS
J. Hurley et al.
Title Page Abstract Introduction Conclusions References Tables Figures
◭ ◮
◭ ◮
Back Close Full Screen / Esc
Printer-friendly Version Interactive Discussion
Discussion
P
a
per
|
Dis
cussion
P
a
per
|
Discussion
P
a
per
|
Discussio
n
P
a
per
|
Table 1. Microwindows for cloud macrophysical parameter retrievals from MIPAS spectra, or-dered in terms of priority of selection. Note that the boundaries are multiples of 0.125 cm−1 so are consistent with both the “full-resolution” (0.025 cm−1
grid) and “optimised-resolution” (0.0625 cm−1grid) spectra.
MW# Wavenumber Range [cm−1
AMTD
3, 3877–3906, 2010Retrieval of macrophysical cloud
parameters from MIPAS
J. Hurley et al.
Title Page Abstract Introduction Conclusions References Tables Figures
◭ ◮
◭ ◮
Back Close Full Screen / Esc
Printer-friendly Version Interactive Discussion
Discussion
P
a
per
|
Dis
cussion
P
a
per
|
Discussion
P
a
per
|
Discussio
n
P
a
per
|
Cloud Microwindows
930 940 950 960 970
Wavenumber [cm-1] 1
10 100 1000
Radiance [nW cm
-2sr -1(cm -1) -1]
1 2 3 5 4
6
7 9 8 10
CO2 H2O F12 N2O
O3
HNO3
Fig. 1. Modelled full-resolution MIPAS spectrum for a tangent height of 9 km separated by constituent major emitters, in the spectral region of selected MWs listed in Table 1– with MW spectral regions shaded.
AMTD
3, 3877–3906, 2010Retrieval of macrophysical cloud
parameters from MIPAS
J. Hurley et al.
Title Page Abstract Introduction Conclusions References Tables Figures
◭ ◮
◭ ◮
Back Close Full Screen / Esc
Printer-friendly Version Interactive Discussion
Discussion
P
a
per
|
Dis
cussion
P
a
per
|
Discussion
P
a
per
|
Discussio
n
P
a
per
|
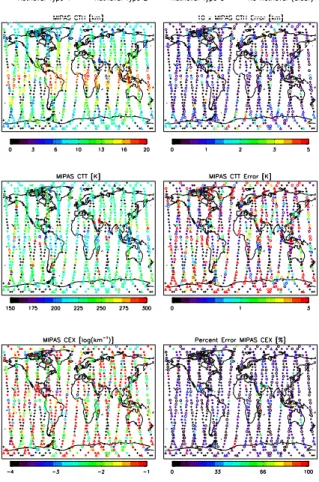
Fig. 3. Top panels: Zonally-averaged retrieved cloud top height (top left), cloud top tempera-ture (top right) and logarithm of extinction coefficient (bottom left) when algorithm is applied to a month’s worth of MIPAS data (solid lines), along with corresponding ISCCP quantities (dotted lines). Bottom panels: Scatterplot showing average cloud top height (top left), cloud top tem-perature (top right) and cloud extinction (bottom left) in a 2.5◦
by 2.5◦
latitude/longitude grid for MIPAS and ISCCP. Solid line shows one-to-one limit. Points colour-coded by latitude.
AMTD
3, 3877–3906, 2010Retrieval of macrophysical cloud
parameters from MIPAS
J. Hurley et al.
Title Page Abstract Introduction Conclusions References Tables Figures
◭ ◮
◭ ◮
Back Close Full Screen / Esc
Printer-friendly Version Interactive Discussion
Discussion
P
a
per
|
Dis
cussion
P
a
per
|
Discussion
P
a
per
|
Discussio
n
P
a
per
|
Fig. 5.Correlation between CI and CEF (evaluated in MW1) colour-coded by extinction coeffi -cient (for those cases for which the retrieval has been evaluated) and by open circles for clear scans, for all spectra above the cloud top (if any) measured MIPAS on 1 April 2003. CI is anti-correlated and CEF is anti-correlated with cloud amount. Horizontal line shows the CEF threshold (above which cloud occurs) and vertical line shows the CI threshold (to the left of which cloud occurs).