NHESSD
3, 941–953, 2015Climate, topographical and
meteorological investigation
R. Singh et al.
Title Page
Abstract Introduction
Conclusions References
Tables Figures
◭ ◮
◭ ◮
Back Close
Full Screen / Esc
Printer-friendly Version Interactive Discussion
Discussion
P
a
per
|
Discussion
P
a
per
|
Discussion
P
a
per
|
Discussion
P
a
per
Nat. Hazards Earth Syst. Sci. Discuss., 3, 941–953, 2015 www.nat-hazards-earth-syst-sci-discuss.net/3/941/2015/ doi:10.5194/nhessd-3-941-2015
© Author(s) 2015. CC Attribution 3.0 License.
This discussion paper is/has been under review for the journal Natural Hazards and Earth System Sciences (NHESS). Please refer to the corresponding final paper in NHESS if available.
Brief Communication: Climate,
topographical and meteorological
investigation of the 16–17 June 2013
Kedarnath (India) disaster causes
R. Singh1, D. Siingh2, S. A. Gokani1, P. S. Buchunde2, R. P. Singh3, and A. K. Singh3
1
KSK Geomagnetic Research Laboratory, Indian Institute of Geomagnetism, Allahabad, India
2
Indian Institute of Tropical Meteorology, Pune, India
3
Department of Physics, Banaras Hindu University, Varanasi, India
Received: 11 December 2014 – Accepted: 20 January 2015 – Published: 3 February 2015 Correspondence to: R. Singh ([email protected])
NHESSD
3, 941–953, 2015Climate, topographical and
meteorological investigation
R. Singh et al.
Title Page
Abstract Introduction
Conclusions References
Tables Figures
◭ ◮
◭ ◮
Back Close
Full Screen / Esc
Printer-friendly Version Interactive Discussion
Discussion
P
a
per
|
Discussion
P
a
per
|
Discussion
P
a
per
|
Discussion
P
a
per
|
Abstract
The devastating episode (17–18 June 2013) at Kedarnath (Uttrakhand, India) caused huge loss of lives and physical/material wealth. To understand this catastrophic event, rainfall/convective data and associated climate meteorological parameters are investi-gated. Low pressure zone with very high cloud cover (60–90 %), and relative humidity 5
(70–100 %) associated with low (<4 m s−1) wind velocity over Kedarnath region during
15–17 June are observed. The cause of disaster seems to be the heavy and continu-ous rainfall associated with snow melting and over flooding/collapse of the Chorabari Lake, located upstream. Monsoon advancement was much faster due to the presence of convectively active phase of the Madden Julian Oscillation.
10
1 Introduction
The present study investigates the climate conditions and meteorological aspects of heavy rainfall leading to the Kedarnath floods in the Uttarakhand state (India) of Hi-malayan region during 17–18 June 2013. The flash floods which was also later named as Himalayan tsunami caused a catastrophe resulting into numerous loss of human 15
lives, live stocks and destruction to property in the Himalayan region. Uttarakhand re-gion in Himalayas normally experiences heavy rainfall during July and August months of the Indian summer monsoon season, and is normally associated with landslides and related dangers. Heavy rains in the month of June such as that occurred during 16–17 June 2013 were not reported since many decades (Dobhal et al., 2013; Srinivasan, 20
2013).
Kedarnath (30◦44′6.7′′N; 79◦4′1′′E; 3583 m above mean sea level), a pilgrimage
temple town, is located in the state of Uttarakhand (India) in the central Himalaya. The Kedarnath valley has a total catchment area of ∼67 km2 with Chorabari Lake up the valley (∼2 km upstream of Kedarnath town) and with the Mandakini and Saraswati 25
NHESSD
3, 941–953, 2015Climate, topographical and
meteorological investigation
R. Singh et al.
Title Page
Abstract Introduction
Conclusions References
Tables Figures
◭ ◮
◭ ◮
Back Close
Full Screen / Esc
Printer-friendly Version Interactive Discussion
Discussion
P
a
per
|
Discussion
P
a
per
|
Discussion
P
a
per
|
Discussion
P
a
per
snow capped peaks. Twenty three percent of area is covered by glaciers (Mehta et al., 2012). Rest of the hilly area is covered by trees and bare land. The Himalayan range contains moraine and is susceptible to landslide and breakage of river coast.
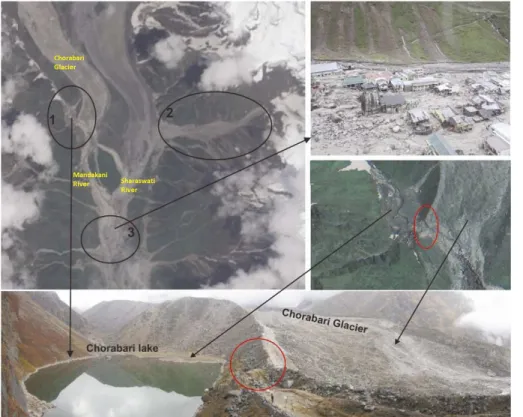
The Chorabari Lake (known as Gandhi Sarovar Lake), located about 2 km upstream of Kedarnath town is approximately 400 m long, 200 m wide and 15–20 m deep (Fig. 1). 5
The sources of water in the lake are snow melting from the surrounding mountain and local rain water. Usually the maximum snow melting is in the month of June and pre-cipitation is maximum in the months of July and August. As a result, water from the lake drains out safely without creating any havoc. The continuous precipitation in the area from 10–17 June 2013 in addition to snow melting filled the lake at a much faster 10
rate. The situation became like a “cloud burst” type event and the lake was rapidly over flooded. In the absence of automatic rain gauge (or hourly measurement of rain) in the area, it could not be ascertained whether cloud burst occurred or not. A cloud burst usually occurs when the amount of precipitation exceeds 100 mm h−1. The
burst-ing of over flooded lake led to its complete drainage within 5–10 min (Dhobal et al., 15
2013) leading to sudden and complete destruction in its path. The rain water from the surrounding of Mandakini and Saraswati rivers along with debris of landslides and col-lapse of river banks flooded the entire area from Kedarnath down to Gaurikund town. Gaurikund town is located 16 km downstream and is the commencement point of the trek to the sacred shrine of Kedarnath. The resting point of Rambara is located halfway 20
between Kedarnath and Gaurikund. The additional huge flux of water from the outburst of Chorabari lake completely washed the whole valley from Kedarnath to Gaurikund. This devastation occurred so fast that nothing could be saved.
In this paper, we have investigated the meteorological parameters like, wind velocity, atmospheric pressure, total cloud cover, surface temperature, relative humidity, sur-25
face precipitation, surface convective precipitation, cloud top temperature (day/night) for the selected region of Uttarakhand (lat. 28–33◦N; long., 76–81◦E) with Kedarnath
NHESSD
3, 941–953, 2015Climate, topographical and
meteorological investigation
R. Singh et al.
Title Page
Abstract Introduction
Conclusions References
Tables Figures
◭ ◮
◭ ◮
Back Close
Full Screen / Esc
Printer-friendly Version Interactive Discussion
Discussion
P
a
per
|
Discussion
P
a
per
|
Discussion
P
a
per
|
Discussion
P
a
per
|
causes of early and intense rain leading to flash flood which caused devastation in the valley.
2 Data source
The watch and ward staff of the Wadia Institute of Himalayan Geology (WIHG) sta-tioned at the Chorabari Glacier camp recorded 210 mm rainfall in 12 h from 17:00 h IST 5
(Indian Standard Time), 15 June 2013 to 05:00 h IST, 16 June 2013, and 115 mm rain-fall from 05:00 to 17:00 IST on 16 June 2013 (Dobhal et al., 2013) leading to 325 mm rainfall in 24 h. IST=UT+5:30 h. Another observatory at Ghuttu (about 38 km from Kedarnath) measured 58 mm rain on 15 June, 121 mm on 16 June and 93 mm on 17 June 2013.
10
The daily meteorological parameters such as wind velocity, wind pattern, pressure, total cloud cover, surface temperature, relative humidity, surface precipitation rate, sur-face convective precipitation rate with 0.5◦grid resolution were obtained from Climate
Forecast System Reanalysis (CFSR) data developed by NOAA’s National Centre for Environmental Prediction (NCEP) for the selected region (lat. 28–33◦N; long., 76–
15
81◦E) from the source: http://nomadl.ncep.noaa.gov/ncep-data/index.html. The daily
cloud top temperature (day/night) was obtained from MODIS (http://gdata1.sci.gsfc. noaa.gov/ncep-data/) and the daily rainfall from TRMM (http://gdata1.sci.gsfc.nasa. gov/daac-bin/G3/gui.cgi?instance_id=TRMM_3B42).
3 Observation and discussion
20
NHESSD
3, 941–953, 2015Climate, topographical and
meteorological investigation
R. Singh et al.
Title Page
Abstract Introduction
Conclusions References
Tables Figures
◭ ◮
◭ ◮
Back Close
Full Screen / Esc
Printer-friendly Version Interactive Discussion
Discussion
P
a
per
|
Discussion
P
a
per
|
Discussion
P
a
per
|
Discussion
P
a
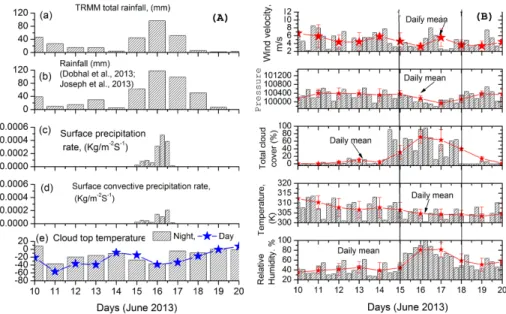
per
15–17 June 2013 with a prominence on 16 and 17 June. The variations of cloud top temperature during the day and night hours are indicative of altitude location of clouds. On 15 June, clouds were at relatively high altitude during the night hours as compared to daytime. On 16 June clouds were almost at the same altitude (∼ −40◦C) during night and day hours and led to heavy rain. Cloud altitude slowly decreased (cloud top temper-5
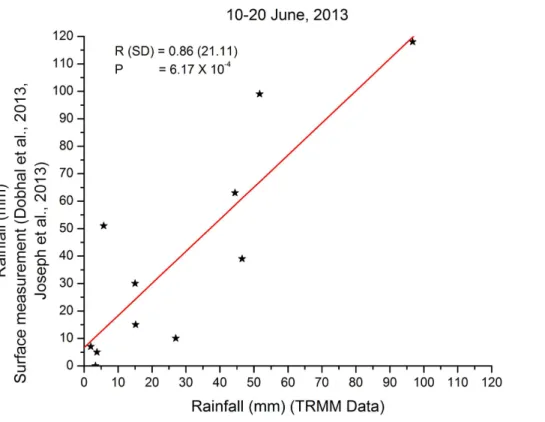
ature reached to∼ −4◦C) during the night of 17 June. In order to assess the validity of TRMM data, ground based measurements of rainfall data (Dobhal et al., 2013; Joseph et al., 2013) have been compared to satellite data (Fig. 3). The correlation coefficient between the two came out to 0.86 with good significance level.
Cloud development and rainfall depends on meteorological parameters (Williams, 10
1995, 2004; Siingh et al., 2013, 2014, 2015). Figure 2b shows six hourly variations of wind velocity, pressure, cloud cover (%), surface temperature and relative humidity for the period 10–20 June 2013. Daily mean variation is also shown in each plot. Wind velocity is seen to remain quite low (less than 4 m s−1) during 15–16 June 2013. Wind
velocity increased to 8.5 m s−1 on the evening of 16 June, and then decreased to <
15
3 m s−1on 17 June. Pressure measurements clearly showed low pressure zone during
16–17 June. Cloud cover was almost 90 % on 16 June. Large amount of cloud cover associated with low pressure zone supports the convergence of South-west Monsoon through westerly disturbance over the region.
The cloud image taken from Kalpana-1 satellite (www.imd.gov.in/section/satmet/ 20
dynamic/insat.htm; Dobhal et al., 2013) on 17 June showed the presence of dense cloud over the Himalayas in Uttarakhand, Himachal states of India and Nepal lead-ing to heavy rain. Relative humidity durlead-ing 15–17 June was quite high, reachlead-ing up to 100 % on 16 June. High value of relative humidity, large cloud coverage and low value of wind velocity altogether resulted in huge rainfall for long duration. The daily 25
NHESSD
3, 941–953, 2015Climate, topographical and
meteorological investigation
R. Singh et al.
Title Page
Abstract Introduction
Conclusions References
Tables Figures
◭ ◮
◭ ◮
Back Close
Full Screen / Esc
Printer-friendly Version Interactive Discussion
Discussion
P
a
per
|
Discussion
P
a
per
|
Discussion
P
a
per
|
Discussion
P
a
per
|
passage of convective cloud system may contribute dominantly to the thermodynamic instability.
The data survey of the last several decades shows that the greatest amount of pre-cipitation in Kedarnath area usually occurs during July and August, sometimes also in September due to the convergence of Southwest Monsoon. Barros et al. (2004) studied 5
the relationship of cloud morphology with land form and orography of the Himalayan re-gion and showed that in this rere-gion (from 20 to 35◦N) smaller but long-lived convective
cloud clusters and disorganized short-lived convective systems advance and retreat as the monsoon propagates away from the Bay of Bengal in June and July, and then recedes in August and September. The Himalayan mountain range acts as a physical 10
barrier to the monsoon current and the nearby Tibetan Plateau acts as a major heat source in the summer and heat sink in winter (Das, 1968; Rao, 1976; Qie et al., 2003). The monsoon activity reached Uttrakhand state of North India in middle June, which is almost about fifteen to twenty days before the usual time. The southwest monsoon reached Kerala (south India) on its typical date (1 June 2013) and spread over south-15
east Bay of Bengal on the same day. Till 5–6 June the monsoon progressed over India as expected. During the next 10 days the monsoon advancement became much faster. As reported by the Indian Meteorological Department-2013 southwest monsoon end of season report, the pace of advancement had been the fastest in the last 73 years (1941–2013). The formation of cyclonic storm Mahasen (10–16 May 2013) over south-20
east Bay of Bengal strengthened the low level cross equatorial monsoon flow over south Andaman Sea and adjoining south Bay of Bengal which aided to the advance-ment of southwest monsoon. The convectively active phase of the Madden–Julian Os-cillation and the associated systematic northward propagation of east–west shear zone at the mid tropospheric levels during this period also helped in faster advancement of 25
monsoon and increased rainfall activity.
NHESSD
3, 941–953, 2015Climate, topographical and
meteorological investigation
R. Singh et al.
Title Page
Abstract Introduction
Conclusions References
Tables Figures
◭ ◮
◭ ◮
Back Close
Full Screen / Esc
Printer-friendly Version Interactive Discussion
Discussion
P
a
per
|
Discussion
P
a
per
|
Discussion
P
a
per
|
Discussion
P
a
per
inland. The intrusion of cold air in the presence of moist/humid air along with orographic uplift could have triggered intense convection, low convergence resulting in heavy rain-fall over the Uttrakhand. In a similar case of extreme rainrain-fall (July–early August 2010), associated with devastating flood in Pakistan (Hong et al., 2011; Wang et al., 2011; Lau and Kim, 2012), Hong et al. (2011) advocated that southward penetration of cold dry air 5
associated with trough east of the blocking induced anomalous low level convergence and upward motion, and provided favourable environment for northward propagation of monsoon surges. Houze et al. (2011) attributed this event to an association with the anomalous propagation of a depression formed over Bay of Bengal.
Kedarnath town is situated on the outwash plane of Chorabari and companion 10
glaciers in the Mandakini River valley. Mandakini and Saraswati rivers encircle this out-wash plane and meet near the town (Fig. 1). Overcrowding of people during past few years have caused change in the course of Saraswati river which now flows just behind the Kedarnath town. Houses built at Kedarnath, and at the downstream located Ram-bara and Gaurikund towns, are on the loosely bound moraine/fluvial deposits, prone to 15
landslides and river cuttings.
May and June climatically suits for pilgrimage and tours to Uttrakhand and hence maximum pilgrims and travellers are usually present in the state, most of them prefer-ring the Kedarnath valley and surrounding area. To provide amenities/facilities to the surplus population, residents from other region of Uttarakhand also migrate to the val-20
ley. As a result, the level of population along with supporting animals is enhanced to a much greater extent than usual. The population is over flooded beyond the capacity of the valley. In order to have accommodation, buildings and temporary shelters are built along the banks of river, sometimes making encroachments in the river bed lead-ing to blockage in the flow of river. In fact buildlead-ings, roads and developmental activities 25
have disrupted the smooth flow of rivers in Uttrakhand.
NHESSD
3, 941–953, 2015Climate, topographical and
meteorological investigation
R. Singh et al.
Title Page
Abstract Introduction
Conclusions References
Tables Figures
◭ ◮
◭ ◮
Back Close
Full Screen / Esc
Printer-friendly Version Interactive Discussion
Discussion
P
a
per
|
Discussion
P
a
per
|
Discussion
P
a
per
|
Discussion
P
a
per
|
Kedarnath town and downstream areas. Flooded water and debris from Saraswati river added to this devastation. Many houses along with other civil structures in Kedarnath town, Rambara and Gaurikund were completely washed out. This occurred in the early morning of 17 June 2013. As a result hundreds of people and animals lost their lives in addition to huge damage of property.
5
4 Conclusion
Meteorological parameters such as wind velocity, pressure, cloud cover, surface tem-perature, relative humidity and cloud-top temperature were analyzed to understand the heavy rainfall during 15–17 June 2013, which caused unprecedented loss of hu-man life, animals and properties in the Kedarnath region of Uttarkhand, India. Analysis 10
show that cloud cover reached almost 90 % (on 16 June 2013) and wind speed was low (<4 m s−1). In addition to this, relative humidity reached ∼100 %. These factors
support convective heavy rainfall which was observed during 15–17 June 2013. The convergence of southwest monsoon trough and westerly disturbances over the region was observed.
15
Chorabari lake outburst caused by heavy rain and ice melting in the nearby moun-tains flooded the Mandakini and Saraswati Rivers. As a result, the towns of Kedarnath, Rambara and Gaurikund were completely washed out. Heavy rain and associated land-slides are not uncommon in Uttarkhand during monsoon months (July–September). In June 2013, the monsoon advanced by almost a month and coincided with the peak 20
period of pilgrimage and tourism. Consequently much more loss of human life, animals and property occurred.
Author contributions. The concept of the paper was initiated by R. Singh and D. Siingh. The analyses for the paper were collaboratively done by R. Singh, D. Siingh, S. A. Gokani and P. S. Buchunde. R. P. Singh and A. K. Singh contributed to data interpretation, discussion and
25
NHESSD
3, 941–953, 2015Climate, topographical and
meteorological investigation
R. Singh et al.
Title Page
Abstract Introduction
Conclusions References
Tables Figures
◭ ◮
◭ ◮
Back Close
Full Screen / Esc
Printer-friendly Version Interactive Discussion
Discussion
P
a
per
|
Discussion
P
a
per
|
Discussion
P
a
per
|
Discussion
P
a
per
Acknowledgements. R. Singh, S. A. Gokani are grateful to Director IIG for support and encour-agement for work. D. Siingh, P. S. Buchunde are grateful to Director IITM for continuous en-couragement and also support towards the collaborative work with KSK GRL, IIG (Allahabad), BHU (Varanasi) and IITM (Pune).
References
5
Barros, A. P., Kim, G., Williams, E., and Nesbitt, S. W.: Probing orographic controls in the Himalayas during the monsoon using satellite imagery, Nat. Hazards Earth Syst. Sci., 4, 29–51, doi:10.5194/nhess-4-29-2004, 2004.
Das, P. K.: The Monsoon, National Book Trust India, New Delhi (India), 1968.
Dobhal, D. P., Gupta, A. K., Mehta, M., and Khandelwal, D. D.: Kedarnath disaster: facts and
10
plausible causes, Curr. Sci. India, 105, 171–174, 2013.
Hong, C. C., Hsu, H. H., Lin, N. H., and Chiu, H.: Roles of European Blocking and the tropical-extratropical interaction in the 2010 Pakistan flooding, Geophys. Res. Lett., 38, L13806, doi:10.1029/2011GL047583, 2011.
Houze, R. A., Rassmussen, K. L., Medina, S., Brodzik, S. R., and Romatschke, U.: Anomalous
15
atmospheric events leading to the summer 2010 floods in Pakistan, B. Am. Meteorol. Soc., 92, 291–298, doi:10.1175/2010BAMS3173.1, 2011.
IMD, India Meteorological Department: Southwest monsoon end of-season report, available at: http://imd.gov.in/section/nhac/dynamic/endofseasonreport2013.pdf(last access: 8 Decem-ber 2014), 2013.
20
Joseph, S., Sahai, A. K., Sharmila, S., Abhilash, S., Borah, N., Pillai, P. A., Chattopadhyay, R., and Kumar, A.: Extended Range Prediction of Uttarakhand Heavy Rainfall Event by an En-semble Prediction System based on CFSv2, Indian Institute of Tropical Meteorology, Pune, India, ISSN 0252-1075.ESSO/IITM/SERP/SR/03(2013)/180, 2013.
Lau, W. K. M. and Kim, K. M.: The 2010 Pakistan flood and Russian heat wave: teleconnection
25
of hydrometeorological extremes, J. Hydrometeorol., 13, 392–403, doi:10.1175/JHM-D-11-016.1, 2012.
Mehta, M., Majeed, Z., Dobhal, D. P., and Srivastava, P.: Geomorphological evidences of post-LGM glacial advancements in the Himalaya: a study from Chorabari Glacier, Garhwal Hi-malaya, India, J. Earth Syst. Sci., 121, 149–163, 2012.
NHESSD
3, 941–953, 2015Climate, topographical and
meteorological investigation
R. Singh et al.
Title Page
Abstract Introduction
Conclusions References
Tables Figures
◭ ◮
◭ ◮
Back Close
Full Screen / Esc
Printer-friendly Version Interactive Discussion
Discussion
P
a
per
|
Discussion
P
a
per
|
Discussion
P
a
per
|
Discussion
P
a
per
|
Qie, X.: Progress in the atmospheric electricity researches in China during 2006–2010, Adv. Atmos. Sci., 29, 992–1005, doi:10.1007/s00376-011-1195-0, 2012.
Qie, X., Toumi, R., and Yuan, T.: Lightning activities on the Tibetan Plateau as observed by the lightning imaging sensor, J. Geophys. Res., 108, 4551, doi:10.1029/2002JD003304, 2003. Rao, Y. P.: Southwest Monsoon, Meteorological Monograph, Synoptic Meteorology No. 1/1976,
5
India Meteorological Department, Delhi, India, 1976.
Siingh, D., Kumar, P. R., Kulkarni, M. N., Singh, R. P., and Singh, A. K.: Lightning, convective rain and solar activity over the South/Southeast Asia, Atmos. Res., 120–121, 99–111, 2013. Siingh, D., Buchunde, P. S., Singh, R. P., Nath, A., Kumar, S., and Ghodpage, R. N.:
Lightning and convective rain study at different parts of India, Atmos. Res., 137, 35–48,
10
doi:10.1016/j.atmosres.2013.09.018, 2014.
Siingh, D., Buchunde, P. S., Gandhi, H., Singh, R., Singh, S., Patil, M. N., and Singh, R. P.:Lightning and convective rain over Indian peninsula and Indo-China peninsula, Adv. Space Res., 55, 1085–1103, doi:10.1016/j.asr.2014.11.014, 2015.
Srinivasan, J.: Predicting and managing extreme rainfall, Curr. Sci. India, 105, 7–8, 2013.
15
Wang, S. Y., Davies, R. E., Huang, W. R., and Gillies, R. R.: Pakistan’s two-stage monsoon and links with the recent climate change, J. Geophys. Res., 116, D16114, doi:10.1029/2011JD015760, 2011.
Williams, E. R.: Meteorological aspects of thunderstorms, in: CRC Handbook on Atmospheric Electrodynamics, vol. 1, edited by: Volland, H., CRC Press, Boca Raton, FL, 27–60, 1995.
20
NHESSD
3, 941–953, 2015Climate, topographical and
meteorological investigation
R. Singh et al.
Title Page
Abstract Introduction
Conclusions References
Tables Figures
◭ ◮
◭ ◮
Back Close
Full Screen / Esc
Printer-friendly Version Interactive Discussion
Discussion
P
a
per
|
Discussion
P
a
per
|
Discussion
P
a
per
|
Discussion
P
a
per
Figure 1.The Landsat satellite image (23 June 2013; after disaster), showing (1) Chorabari
NHESSD
3, 941–953, 2015Climate, topographical and
meteorological investigation
R. Singh et al.
Title Page
Abstract Introduction
Conclusions References
Tables Figures
◭ ◮
◭ ◮
Back Close
Full Screen / Esc
Printer-friendly Version Interactive Discussion
Discussion
P
a
per
|
Discussion
P
a
per
|
Discussion
P
a
per
|
Discussion
P
a
per
|
Figure 2. (A)Variation of daily mean(a)TRMM total rainfall(b)rainfall (Dobhal et al., 2013),
NHESSD
3, 941–953, 2015Climate, topographical and
meteorological investigation
R. Singh et al.
Title Page
Abstract Introduction
Conclusions References
Tables Figures
◭ ◮
◭ ◮
Back Close
Full Screen / Esc
Printer-friendly Version Interactive Discussion
Discussion
P
a
per
|
Discussion
P
a
per
|
Discussion
P
a
per
|
Discussion
P
a
per
Figure 3.Comparison plot of ground based measured rainfall and TRMM measured rainfall