www.atmos-chem-phys.net/13/3185/2013/ doi:10.5194/acp-13-3185-2013
© Author(s) 2013. CC Attribution 3.0 License.
Atmospheric
Chemistry
and Physics
Geoscientiic
Geoscientiic
Geoscientiic
Geoscientiic
Remote sensing of ice crystal asymmetry parameter using
multi-directional polarization measurements – Part 2: Application
to the Research Scanning Polarimeter
B. van Diedenhoven1,2, B. Cairns2, A. M. Fridlind2, A. S. Ackerman2, and T. J. Garrett3
1Columbia University, Center for Climate System Research, New York, NY, USA 2NASA Goddard Institute for Space Studies, New York, NY, USA
3Department of Atmospheric Sciences, University of Utah, Salt Lake City, Utah, USA
Correspondence to:B. van Diedenhoven ([email protected])
Received: 15 October 2012 – Published in Atmos. Chem. Phys. Discuss.: 14 December 2012 Revised: 6 March 2013 – Accepted: 7 March 2013 – Published: 18 March 2013
Abstract. A new method to retrieve ice cloud
asymme-try parameters from multi-directional polarized reflectance measurements is applied to measurements of the airborne Research Scanning Polarimeter (RSP) obtained during the CRYSTAL-FACE campaign in 2002. The method assumes individual hexagonal ice columns and plates serve as prox-ies for more complex shapes and aggregates. The closest fit is searched in a look-up table of simulated polarized re-flectances computed for cloud layers that contain individual, randomly oriented hexagonal columns and plates with a vir-tually continuous selection of aspect ratios and distortion. The asymmetry parameter, aspect ratio and distortion of the hexagonal particle that leads to the best fit with the measure-ments are considered the retrieved values. Two cases of thick convective clouds and two cases of thinner anvil cloud layers are analyzed. Median asymmetry parameters retrieved by the RSP range from 0.76 to 0.78, and are generally smaller than those currently assumed in most climate models and satel-lite retrievals. In all cases the measurements indicate rough-ened or distorted ice crystals, which is consistent with pre-vious findings. Retrieved aspect ratios in three of the cases range from 0.9 to 1.6, indicating compact particles dominate the cloud-top shortwave radiation. Retrievals for the remain-ing case indicate plate-like ice crystals with aspect ratios around 0.3. The RSP retrievals are qualitatively consistent with the CPI images obtained in the same cloud layers. Re-trieved asymmetry parameters are compared to those deter-mined in situ by the Cloud Integrating Nephelometer (CIN). For two cases, the median values of asymmetry parameter
retrieved by CIN and RSP agree within 0.01, while for the two other cases RSP asymmetry parameters are about 0.03– 0.05 greater than those obtained by the CIN. Part of this bias might be explained by vertical variation of the asymmetry parameter or ice shattering on the CIN probe, or both.
1 Introduction
observed in situ provide poor spatial coverage and do not al-ways represent values at the top of the clouds relevant for solar reflectances. Moreover, such small asymmetry param-eters around 0.75 are seemingly inconsistent with the occa-sional sightings of halos within ice clouds from surface ob-servations (Sassen et al., 2003) that imply pristine ice crys-tals, which generally have high asymmetry parameters (e.g. Baum et al., 2011; Yang et al., 2013).
In Part 1 of the paper (van Diedenhoven et al., 2012a), we presented a new method to remotely sense the ice crystal asymmetry parameter using multi-directional polarized re-flectance measurements. Additionally, the method provides estimates for the microscale surface roughness or distortion of the ice crystals and the effective aspect ratios (AR) of their components. In the current paper we apply this technique to measurements made by the airborne Research Scanning Po-larimeter (RSP) obtained during the Cirrus Regional Study of Tropical Anvils and Cirrus Layers – Florida Area Cirrus Experiment (CRYSTAL-FACE) campaign in July 2002. Fur-thermore, cloud optical thicknesses and cloud-top heights are simultaneously derived from RSP measurements using es-tablished techniques. The results are evaluated using near-collocated measurements of the CIN, the Cloud Particle Imager (CPI), the MODIS Airborne Simulator (MAS) and cloud radar.
2 Retrieval procedures and data processing
The primary measurements used in this work were obtained with the Research Scanning Polarimeter (RSP) instrument (Cairns et al., 1999, 2003), an airborne version of the Aerosol Polarimetry Sensor satellite instrument (Mishchenko et al., 2007) that was lost during the failed launch of the Glory mis-sion in March 2011. The RSP provides simultaneous mea-surements of total and polarized reflectances in 9 bands from the visible to the shortwave infrared. During CRYSTAL-FACE, one of the two available RSP instruments was mounted on the Proteus high-altitude aircraft built by Scaled Composites, LLC. The RSP scans along track, providing measurements of each pixel at 152 different viewing angles at 0.8◦ intervals. During CRYSTAL-FACE the instrument was mounted on the aircraft at an angle of approximately 14.5◦, leading to viewing angles ranging from+45◦to−75◦. The instantaneous field-of-view of the RSP is 14 mrad, lead-ing to typical pixel sizes of about 40–150 m at nadir for the aircraft altitudes and cloud-top heights occurring dur-ing CRYSTAL-FACE. The instrument is primarily designed to provide exceptionally accurate information about aerosols (e.g. Chowdhary et al., 2002; Knobelspiesse et al., 2012) but has been shown to provide unique information about liquid clouds as well (Knobelspiesse et al., 2011; Alexandrov et al., 2012). To date, little RSP data over ice clouds have been ana-lyzed (e.g. Ottaviani et al., 2012), and the CRYSTAL-FACE
dataset currently provides the only substantial collection of RSP measurements over ice clouds.
2.1 Asymmetry parameter and optical thickness
retrieval
Asymmetry parameters are retrieved from the multi-direction polarized reflectance measurements using the method de-scribed in detail in Part 1. The method is based on previous findings that (a) complex aggregates of hexagonal crystals generally have scattering phase matrices resembling those of their components (e.g. Fu, 2007; Um and McFarquhar, 2007, 2009), and (b) scattering phase matrices systematically vary with aspect ratios of crystals and their degree of distortion or microscale surface roughness (e.g. Fu, 2007; Yang and Fu, 2009). Individual hexagonal ice columns and plates are as-sumed to serve as proxies for more complex shapes and ag-gregates. As shown in Part 1, smooth, undistorted hexagonal columns produce strong features in the degree of polarization functions at the scattering angles usually observed by multi-directional polarimeters (&100◦). Similar, but sharper struc-tures are generally obtained for plates (e.g. Takano and Liou, 1989). Such features are systematically diminished with in-creasing distortion or microscale surface roughness (Part 1; Macke et al., 1996; Yang et al., 2008). Furthermore, as shown in Part 1, the polarization from hexagonal ice crystals gener-ally increases when their aspect ratio increasingly deviates from unity, especially at scattering angles smaller than about 140◦. Thus, a best fit to multi-directional polarization mea-surements at 864 nm is sought within a look-up table (LUT) calculated by assuming individual hexagonal particles with varying aspect ratios (AR=0.02–50) and distortion parame-ters (δ=0–0.7; see Macke et al. (1996) and below for a defi-nition ofδ), which have asymmetry parameters ranging from 0.71 to 0.94. The asymmetry parameter of the corresponding column or plate is considered to be representative (i.e. the retrieved value) of the asymmetry parameter of the ice crys-tal ensemble at the top of the observed cloud. For clouds with optical thickness less than 5, the cloud optical thickness must be retrieved simultaneously with the asymmetry parameter, while for optically thicker clouds the asymmetry parameter retrieval is independent of cloud optical thickness.
efficient, yet accurate treatment of microscale surface rough-ness. For a large collection of ice crystals, microscale surface roughness and large-scale particle distortion both lead to a similar randomization of the angles between crystal facets, which in turn leads to the diminishing of features in the scattering phase matrix. Increasing the number of impuri-ties within ice crystals also has a similar effect (Hess et al., 1998). Thus, we consider the distortion used here a proxy of randomization of the angles between crystal facets possibly caused by any of these effects. Furthermore, our approach is based on the common assumption that ice crystals consist of fundamental hexagonal structures that can be either smooth or distorted. Some evidence exists that, under some condi-tions, small ice crystals can form or evolve into other shapes, such as spheroids (e.g., Mishchenko and Sassen, 1998; Nel-son, 1998; Lawson et al., 2010; Gayet et al., 2012). In future work, application of our approach to clouds consisting of par-ticles fundamentally different from hexagonal prisms should be evaluated.
The retrieval technique was evaluated in Part 1 using sim-ulated measurements based on state-of-the-art optical prop-erties of smooth, moderately roughened and severely rough-ened solid plates, solid and hollow columns, solid and hol-low bullet rosettes, droxtals, aggregates of columns and ag-gregates of plates, as well as several mixtures of these habits (Baum et al., 2005a, 2011; Yang et al., 2013). The evaluation showed that the ice crystal asymmetry parameters are gener-ally retrieved to within 5 %, or about 0.04 in absolute terms, largely independent of calibration errors, range and sampling density of scattering angles and random noise in the measure-ments. Moreover, plate-like, column-like, smooth and rough particles were found to be generally correctly identified. The area-weighted mean aspect ratio of the particles (or their components) (cf. Fu, 2007) is retrieved by this method. In the case of mixtures of plates and columns, the technique is expected to yield aspect ratios approximately equal to the area-weighted mean of AR for plates plus 1/AR for columns (or 1/AR for plates plus AR for columns). For example, for a cloud in which plates with AR=0.1 and columns with
AR=2 each contribute half of the total cross-sectional area,
we expect the retrieved aspect ratio would be either close to (0.1+1/2)/2=0.3 or (1/0.1+2)/2=6. However, this
should be verified in future work.
For the inference of ice crystal asymmetry parameter, the relative root-mean-squared difference (RRMSD, Eq. (5) in Part 1) between polarization measurements at the consid-ered angles and the corresponding simulated values from our look-up table is determined for each combination of aspect ratio and distortion, and the combination leading to the low-est RRMSD corresponds to the retrieved asymmetry param-eter. In this study, for each analyzed CRYSTAL-FACE flight leg, a separate LUT is calculated assuming the mean solar zenith and relative azimuth angle of the flight leg. To de-termine the RRMSD, the measurements are interpolated to the scattering angles at which the LUT is determined. This
is done, rather than interpolating the entire LUT to the scat-tering angles of each measurement, to reduce computational effort. Note, however, that maximum differences in scatter-ing angle grid of the measurements and the LUT are only about 0.4◦.
Based on the analysis presented in Part 1, asymmetry pa-rameters are only retrieved if measurements are available for scattering angles between 120◦and 150◦. Measurements with polarized reflectances lower than 0.002 or scattering an-gles greater than 165◦(at which polarized reflectance over ice clouds are usually near zero) are excluded to avoid over-whelming influence of instrument noise as well as geometry and calibration uncertainties. Since the RSP noise and cali-bration uncertainties in polarized reflectances above clouds are expected to be well below 0.002, independent of mea-surement geometry (Knobelspiesse et al., 2012), this filter-ing can be considered conservative. Furthermore, measure-ments for which the estimated degree of polarization from ocean sunglint exceeds 0.5 % are excluded. For this, sunglint is simulated using the rough ocean surface approximation by Cox and Munk (1954, 1956) with a windspeed of 4 m s−1, and the extinction of the sunglint through the cloud layer is calculated using Beer’s law. Note that this estimate of con-tamination of sunglint is approximate and that the threshold of 0.5 % is a conservative one based on visual inspection of the polarized reflectances measured over clouds at sunglint geometries.
Since the asymmetry parameter retrieval is independent of cloud optical thickness for clouds with optical thickness greater than about 5, asymmetry parameters are retrieved for these pixels using a LUT with an arbitrary large optical thick-ness (τc=50), as described in Part 1. Pixels with a cloud op-tical thickness larger than 5 are identified by the requirement that the measured total reflectance in the 864 nm channel near nadir is larger than the smallest value appearing in the corre-sponding LUT for a cloud optical thickness of 5. Note that this threshold technique is conservative since the reflectance of a cloud with optical thickness of 5 decreases substantially with increasing asymmetry parameter.
For completeness, the optical thickness of clouds that were identified as optically thick (τc>5) are retrieved after the asymmetry parameter is determined. For this, a separate LUT is calculated containing total reflectances for clouds with op-tical thickness values varying with steps of 1 forτc=10– 20 and with steps of 2 for optically thicker clouds up to τc=100. To reduce the size of this LUT, the optical prop-erties of all hexagonal plates and columns in the original LUT are averaged in 0.02 wide asymmetry parameter bins between 0.7 and 0.86. The nadir reflectances corresponding to the asymmetry parameter that are closest to the retrieved value are then used to determine the cloud optical thickness. If the asymmetry parameter is not retrieved for a given pixel owing to the data selection criteria, the optical thickness is retrieved using the LUT corresponding to an asymmetry pa-rameter of 0.78.
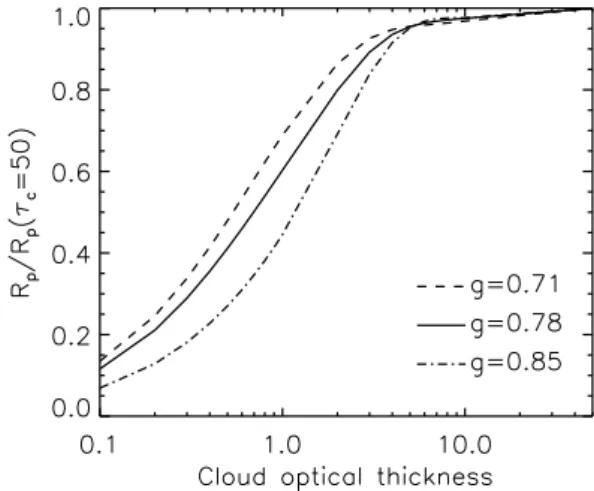
In order to assess to which optical depth within the cloud top the retrieved asymmetry parameters correspond, Fig. 1 shows polarized reflectances at a scattering angle of 120◦ for cloud layers with increasing optical thickness relative to the polarized reflectances of optically thick clouds (τc=50). This figure shows that for clouds with an optical thickness larger than about 5 the polarized reflectance is nearly satu-rated, as discussed above and in Part 1. Furthermore, two-thirds of the maximum polarized reflectance is reached at a cloud optical thickness of about 0.8 to 2, depending on the asymmetry parameter. From this we estimate that the polar-ized reflectances used to retrieve asymmetry parameters are dominated by the first one or two units of optical depth in the cloud layer (cf. Platnick, 2000). Similar results are obtained for other scattering angles. In future work, vertical weighting functions of the polarized radiance field could be calculated and evaluated against realistic cloud model simulations (cf. Zhang et al., 2010; Alexandrov et al., 2012).
2.2 Cloud-top height retrievals
Cloud-top height estimates are needed to process the level-1 RSP observations into data suitable for the asymmetry parameter retrieval, as explained in Sect. 2.3. Cloud-top height is estimated from polarized reflectances based on the method described by Buriez et al. (1997), which is opera-tionally applied to measurements of the Polarization and Di-rectionality of the Earth’s Reflectances (POLDER) instru-ment. The molecular Rayleigh scattering signature in polar-ized reflectances is used to estimate the column of air be-tween the cloud and the aircraft, from which the cloud height can be derived. The method relies on the fact that the sig-nal of Rayleigh scattering in the polarized reflectance sigsig-nal is strong at scattering angles in the range 60–120◦at short wavelengths, but negligible at longer wavelengths, while the contributions of clouds to the polarized reflectance are com-parable at all wavelengths in the visible to near-infrared.
Fig. 1.Polarized reflectanceRpas a function of cloud optical
thick-nessτcrelative to its value atτc=50. Different linestyles indicate
calculations made assuming different asymmetry parameters as in-dicated. Solar zenith, viewing and relative azimuth angles are 13◦, 52◦and 55◦, respectively, leading to a scattering angle of 120◦.
The contribution of Rayleigh scattering to the polarized reflectanceRp,rat a wavelengthλand scattering angleγ is approximated by the single scattering approximation via
Rp,r(λ)= 3 16
1−cos2γ µ0µ
1τr (1)
whereµ0andµare the cosine of the solar zenith and viewing angles, respectively, and1τr(λ)is the Rayleigh optical thick-ness of the air column between the aircraft and the cloud (or other lower boundary).Rp,rat 410 nm can be estimated by correcting the polarized radiances measured by the 410 nm channel of RSP using those at 864 nm, where Rayleigh scat-tering is negligible:
Rp,r(λ=410 nm)≈ π
q
(Q2410+U4102 )−(Q2864+U8642 )
µ0F⊙
, (2)
whereF⊙is the solar irradiance, andQandU are the sec-ond and third Stokes parameters, respectively (van de Hulst, 1957). In turn,1τrat 410 nm can be estimated using Eqs. (1) and (2).
The Rayleigh optical thickness of the total column of air from top of atmosphere to sea level,τλ,0, can be estimated by (Hansen and Travis, 1974; Bodhaine et al., 1999) τr,0(λ)=0.008569λ−4×(1+0.0113λ−2+0.00013λ−4). (3) Since the Rayleigh optical depth is proportional to pres-sure,1τrrelates to cloud-top and aircraft heights,zcloudand
zaircraft, respectively, through
whereH is the scale height of atmospheric pressure given by the hydrostatic approximation, which is approximately 7.4 km at mid-troposphere. Thus, by inverting Eq. (4),zcloud can be derived from1τrestimated from the RSP measure-ments and Eqs. (1) and (2). The flight altitude of the Proteus during CRYSTAL-FACE is available in the aircraft naviga-tion files and generally was about 17 km for the analyzed legs.
Following Buriez et al. (1997), the cloud-top height is only estimated for measurements with scattering angles between 60–120◦. Since several measurements are generally available in this scattering angle range for a given RSP field-of-view, the median of the derived cloud-top heights is used here, while the differences between maximum and minimum val-ues are used as an indication of uncertainty.
This simple cloud-top height estimate assumes opaque cloud layers, ignores multiple Rayleigh scattering, and is therefore expected to underestimate the cloud-top height for optically thin clouds (τ .3) (Buriez et al., 1997), as also shown later. Cloud transmission and multiple Rayleigh scat-tering may be corrected for using look-up tables (cf. Buriez et al., 1997). Since we are mainly focusing here on relatively optically thick clouds for which polarized reflectances are nearly saturated (see Fig. 1), such corrections are assumed to be minimal and therefore are not applied here. Develop-ment of a more versatile cloud-top height retrieval algorithm for RSP is planned for future work.
2.3 RSP Level-1 data processing
At a given location of the aircraft, the RSP acquires mea-surements at 152 different viewing angles, which all target a different location on the cloud deck. Before cloud physical properties can be determined from the data, the actual RSP scans must be aggregated to obtain multi-directional obser-vations for a certain location (pixel) at cloud top (Alexan-drov et al., 2012). For this aggregation, knowledge of the cloud height, the angle at which the instrument is mounted on the aircraft, and the aircraft’s position, altitude and attitude (pitch, roll, crab angles) are crucial. Unfortunately, Proteus attitude information was not recorded during CRYSTAL-FACE. For the relatively straight flight legs analyzed here, we assume the roll angle to be negligible and the aircraft to be oriented parallel to the flight direction. The pitch of the aircraft and the instrument mounting angle together deter-mine the angular difference between the nadir direction in the instrument’s reference plane and the actual nadir direc-tion, here dubbed the effective pitch. The effective pitch can be estimated by (1) using distinct features in the polarized reflectance data at well-determined scattering angles, such as those from the liquid cloud “rainbow”, ocean sunglint and Rayleigh scattering; or (2) determining the cloud-top height using the technique described in Sect. 2.2 and validating it against auxiliary information. Here, we mainly use the lat-ter technique using collocated cloud-top height information
from cloud radar, MODIS airborne simulator (MAS) and in situ aircraft measurements. As demonstrated later, an effec-tive pitch of 12◦ yields a cloud-top height from RSP that generally matches the auxiliary cloud-top height information within about 1 km for the considered flight legs. In addition, the effective pitch of 12◦ also leads to ocean sunglint fea-tures that are at the expected scattering angles. Furthermore, rainbow features over liquid clouds appear around a scatter-ing angle of 140◦, as expected, although such features are present only in flight legs not analyzed here, since we focus on ice clouds. Given that the mounting angle of the RSP was determined to be approximately 14.5◦, an effective pitch of 12◦indicates that the aircraft attack angle was about 2.5◦on average. The cloud-top height retrieved with the technique described in Sect. 2.2 increases about 0.3 km for each degree decrease in effective pitch. Hence, the uncertainty in effec-tive pitch is estimated to be about 3◦. In Sect. 3, we discuss the uncertainties in the retrieved asymmetry parameters as-sociated with this uncertainty in aircraft geometry.
The Proteus aircraft was not particularly stable during the CRYSTAL-FACE flights. Oscillations in the aircraft attitude are evident in the data as wave patterns traversing over scat-tering angles in the consecutively measured polarized re-flectances plotted as a function of time. The magnitude and frequency of these patterns varies between flight legs. Air-craft attitude variations are relatively small for the parts of the flight legs selected for this paper. The influence of such patterns on the retrieval products is difficult to quantify, but no obvious artifacts associated with attitude variations are apparent in the retrieved parameters.
Additional uncertainties in the angular aggregation are caused by cloud-top heights that vary substantially over the the flight leg, such as for a cloud edge. Such effects of cloud structure and inhomogeneity lead to an increased difference between cloud-top heights retrieved from measurements at different scattering angles using the method described in Sect. 2.2. Currently, pixels for which the difference between minimum and maximum retrieved cloud-top heights exceed 3 km are excluded. For the four cases studied here, this fil-ter excludes only some pixels at cloud edges, but few pixels remain if a smaller threshold is used.
2.4 Cloud integrating nephelometer data
measurements of the CIN and similar probes in several cloud types is given by Garrett (2008).
During CRYSTAL-FACE, CIN instruments were mounted on the WB-57 and Citation aircraft. However, the CIN on the WB-57 had one faulty channel, which inhibited the re-trieval of the asymmetry parameter from its measurements. Thus, only CIN data from the Citation are used in this pa-per. Asymmetry parameters are derived from the measure-ments as described by Gerber et al. (2000) and Garrett et al. (2003). Only data with a signal-to-noise ratio higher than 15 in the backscattering channel are used to minimize uncertain-ties owing to random shot noise and ambient light.
As confirmed recently by Korolev et al. (2011), most in situ probes measuring in ice clouds can be subject to issues associated with shattering of large ice crystals on the probes or aircraft. Evidence of shattering in the data of the Cloud Particle Imager probe on the Citation during CRYSTAL-FACE has been seen (C. Schmitt, personal communication, 2011), although the severity and effect of shattering is unique to each instrument design (Korolev et al., 2011). For ex-ample, the CIN has a much larger aperture than the CPI. However, Garrett (2007) argued, based on intercomparisons among in situ probes and with remote sensing retrievals (e.g. Noel et al., 2007), that shattering effects on the CIN measure-ments during CRYSTAL-FACE were likely to have been lim-ited. Where shattering occurs, it would expose more surface area, leading to positively biased extinction measurements, as argued by Heymsfield et al. (2006). The potential effect of shattering on asymmetry parameters measured by the CIN is difficult to estimate. In the hypothetical case of large par-ticles composed of components with aspect ratios substan-tially deviating from unity that shatter into numerous small particles with aspect ratios close to unity, the retrieved asym-metry parameter would probably be biased low (see Fig. 1 in Part 1) with positive biases owing to ice shattering seem-ing less likely. However, if aggregates merely break up into their components, the effect on asymmetry parameters mea-sured in situ is likely to be minimal, since aggregates of crys-tals have similar asymmetry parameters as their components (Part 1; Um and McFarquhar, 2007, 2009; Baran, 2009).
2.5 Other data
In addition to the RSP and CIN data, we use data from the Cloud Particle Imager probe (CPI, Lawson et al., 2001) mounted on the WB-57, the MODIS Airborne Simulator (MAS, King et al., 2004) mounted on the ER-2, and the 94-GHz Cloud Radar System (CRS, Li et al., 2004) on the ER-2. CPI data and auxiliary aircraft navigation data were downloaded from NASA’s Earth Science Project Of-fice (ESPO) data archive. MAS level-1 data was down-loaded from NASA’s MAS website. Because substantial bi-ases on the measurements of the visible and shortwave in-frared channels of MAS were recently identified (T. Arnold, personal communication, 2012), we do not use MAS data in
this wavelength range or the MAS level-2 products derived from them, such as effective radius and cloud optical thick-ness. CRS data was downloaded from NASA’s High-Altitude Radar website. Flight track images were obtained from the NASA Langley CRYSTAL-FACE Satellite Page.
3 Results
Results from four Proteus flight segments shown in Fig. 2 are presented here: two flight legs that have collocated CRS, MAS and CIN data (29 and 11 July); and two flight legs for which nearby vertical transects of CIN measurements are available (7 July and 21 July). Thick convective clouds were sampled on 29 and 7 July, while thinner anvil cloud layers were sampled on 11 and 21 July. In all cases the anvils sam-pled were roughly 1.5–2 h aged and active cells remained in some contiguous region of the sampled cloud.
3.1 29 July 2002
On 29 July 2002, a large storm developed at around 17:00– 18:00 UTC on Florida’s west coast (Fig. 2a) and it was sam-pled by all aircraft involved in the CRYSTAL-FACE cam-paign in the next 2–3 h (e.g. Li et al., 2004; Noel et al., 2004; Chepfer et al., 2005; Lopez et al., 2006). Here we an-alyzed measurements obtained at roughly 20:30 UTC in out-flow aged by roughly 2 h. The mean solar zenith and relative azimuth angles for RSP data in this case are 41◦ and 10◦, respectively.
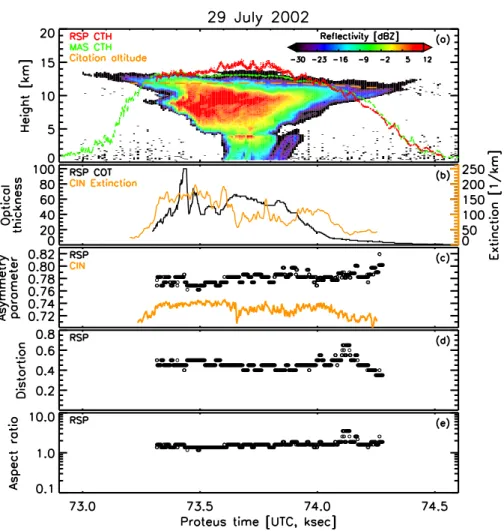
Figure 3 shows cloud-top heights, optical thickness, asym-metry parameter, distortion and aspect ratio retrieved from RSP measurements as a function of time, along with CRS re-flectivity profiles, MAS 11 µm brightness temperature cloud-top heights collocated with the CRS track, and extinction and asymmetry parameters retrieved by the CIN. The Pro-teus (RSP) and ER-2 (CRS, MAS) aircrafts were well collo-cated for these legs and CRS and MAS data are shifted and stretched according to the aircraft proximity files available in NASA’s ESPO repository. The CIN data were acquired about 30 min earlier and the Citation aircraft sampled the storm at a slightly different attack angle. The CIN data are shifted and stretched in time according to the flight tracks and to match features in the retrieved extinction to those in the CRS radar reflectivity.
(a) (b)
(c) (d)
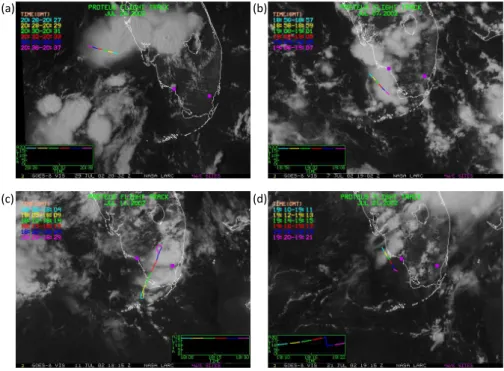
Fig. 2.GOES-8 visible images with Proteus flight track for(a)29 July;(b)7 July;(c)11 July; and(d)21 July. The magenta dots mark the western and eastern ground sites. On 11 July, the most northern storm in the flight track is investigated in Fig. 10. Plotted Proteus altitude information for 21 July is not correct. Figures courtesy of Patrick Minnis and Louis Nguyen, NASA Langley Research Center.
the classic representation of a deep convective system, as presented by Houze (1981). For the bulk of the storm RSP retrieves cloud-top heights of 12–15 km. The differences be-tween minimum and maximum RSP cloud-top heights are less than 100 m, indicating the Proteus was stable during the flight leg, the cloud top is relatively homogeneous, and the estimated effective pitch is appropriate (see Sect. 2.2). At the overshooting top the RSP retrieved cloud top is about 0.5 km higher than the radar cloud top, on average, and more vari-able. In the trailing anvil the estimated cloud heights are sub-stantially lower than the radar cloud top, presumably owing to the erroneous assumption of opaque clouds in the cloud-top height retrieval method, as described in Sect. 2.2. Note that the Proteus was turning over the leading anvil and no RSP data are available there. RSP cloud-top heights com-pare well with MAS 11 µm brightness temperature cloud-top heights, especially near and over the trailing and lead-ing anvils. Interestlead-ingly, the underestimation of cloud top re-trieved by MAS is very similar to that seen by RSP, which might be expected since the retrieval of cloud top from the 11 µm brightness temperature also assumes opaque clouds (Minnis et al., 2008). However, the MAS cloud-top height is only minimally higher in the region of the overshooting top detected by the radar and RSP. Figure 3a also shows that the CIN mounted on the Citation aircraft was sampling the cloud at about 12 km, just below cloud top.
Figure 3b shows the optical thickness retrieved from RSP measurements, which is about 40–100 at the core of the
sys-tem and strongly decreases in the trailing anvil. Extinction values retrieved by the CIN reach up to 200 km−1.
Asymmetry parameters retrieved by the RSP are shown in Fig. 3c and generally range from about 0.76 to 0.8 with a me-dian of 0.78. The smallest asymmetry parameters are gener-ally found at the location with greatest optical thickness and radar reflectivity in the cloud top (around 73.5 ks UTC). No retrievals are performed in the optically thin part of the lead-ing anvil because of a substantial influence of ocean sunglint. The retrieved asymmetry parameters correspond to hexag-onal columns with a median aspect ratio of 1.6 (Fig. 3e) and a median distortion of 0.45 (Fig. 3d). Polarized re-flectances used to retrieve asymmetry parameters are gener-ally weighted towards the first few optical depths in a cloud (see Sect. 2.1 and Fig. 1). Since 11 µm brightness tempera-tures generally represent the cloud temperature over the first optical depth (Minnis et al., 2008), the asymmetry parameter retrieved by the RSP is likely representative of a level close to the MAS cloud-top height shown in Fig. 3a. As discussed in Sect. 2.3, the aircraft pitch angle was not recorded dur-ing CRYSTAL-FACE and is estimated with an uncertainty of about 3◦. Increasing or decreasing the effective pitch angle with 3◦leads to a mean increase or decrease of the retrieved asymmetry parameter of 0.008, which is a small effect com-pared to the overall accuracy of the retrieval method, which is estimated to be 0.04 (Part 1).
Fig. 3.RSP, CRS, MAS and CIN data for 29 July 2002 as a function of time corresponding to the RSP data on the Proteus aircraft. CRS, MAS and CIN data are shifted and stretched/squeezed in time to best collocate with the RSP data.(a)Cloud radar reflectivity (color contours); RSP retrieved cloud-top height (red) with minimum and maximum retrieved heights in dotted lines; cloud-top height derived from MAS 11 µm brightness temperature (green) and altitude of Citation aircraft carrying CIN (orange dashed).(b)Cloud optical thickness (COT) retrieved by RSP (black, left axis) and extinction derived from CIN (orange, right axis).(c)Asymmetry parameter retrieved from RSP (black) and CIN (orange).(d)Distortion parameter from RSP.(e)Aspect ratio from RSP.
to 0.74 with a median of 0.73. While the difference between the median values derived from RSP and CIN might not be significant based on their respective uncertainties of approxi-mately 0.04 and 0.02, at certain locations in the flight leg the difference between them exceeds 0.06. One possible reason for this difference might be that RSP retrievals are weighted towards the first optical depth of the cloud, which is close to the MAS 11 µm brightness temperature cloud-top heights (see Sect. 2.1), whereas the CIN measurements are obtained deeper in the cloud. Indeed, vertically resolved CIN mea-surements in clouds sampled on 7 and 21 July as presented in Sects. 3.2 and 3.4, respectively, (see also Garrett et al., 2005) suggest a positive dependence of asymmetry parame-ter with altitude, although the dependence is weak. Also lidar depolarization profiles slightly increase above about 13.5 km (Noel et al., 2004), which might indicate a change in par-ticle habit. Furthermore, Gayet et al. (2012) observed
32%
7%
1% 50%
10% a) July 29 2002
23%
5%
2% 40% 30%
b) July 11 2002
35%
7%
1% 55%
2% c) July 21 2002
D>55 μm 55% D<55
μm 45%
D>55 μm 22% D<55
μm 78% D>55
μm 31% D<55
μm 69%
Spherical Column Plate Small Irregular Large Irregular
Fig. 4.Percentages of contribution to the total surface area from ice crystals with a maximum diameter smaller and larger than 55 µm as determined by the CPI on the WB-57 (top pie diagrams), and percentages of CPI classifications according to total surface area (lower multi-colored pie diagrams, Lawson et al., 2001) for(a)29 July (timet=71.2–71.4 ks UTC, heighth=12.5 km);(b)11 July (t=67.2–67.4 ks UTC,h=13.2 km); and (c) 21 July (t=68.5– 68.6 ks UTC,h=14.1 km).
on the geometric optics approximation, which may not ap-ply if very small particles (with size parameters below about 100) dominate in the observed cloud. Furthermore, the scat-tering properties of small ice crystals are highly uncertain (e.g., Ulanowski et al., 2006; Um and McFarquhar, 2009). Further research on the validity of relying on geometrics op-tics to produce the LUTs is needed. We note that ice crystal effective radii retrieved using GOES-8 (Minnis et al., 1995), collocated with the Citation aircraft, range from 25 µm to 40 µm (not shown) and are therefore expected to be large enough for the geometrics optics approximation to be valid. As an alternative explanation for the difference between CIN and RSP retrievals, we speculate that the CIN data might be biased low, owing to ice shattering or other problems caused by the rather extreme environment within this cloud system. However, the potential effect of shattering on CIN retrievals of asymmetry parameters is difficult to quantify, as discussed in Sect. 2.4.
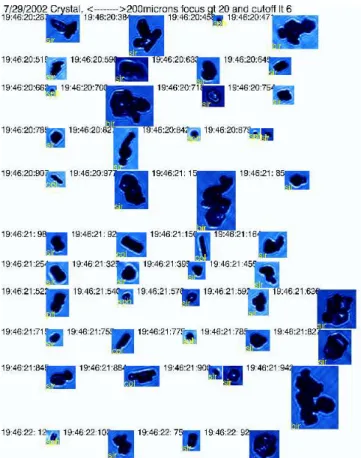
Ice habit classifications from the CPI on the WB-57, sam-pling the cloud at approximately 12.5 km, show that small irregular and spherical particles dominated the total surface area in the cloud top (Fig. 4a; see also Noel et al., 2004). (Note that the term “spherical” is used for anything that ap-pears roughly circular on the 2-D images and does not imply perfect ice spheres. Moreover, the CPI resolution is insuffi-cient to detect crystal details smaller than about 3 µm.) The small irregular particles appear to be either compact crys-tals with aspect ratios near unity or distorted aggregates of columns and plates in the CPI images, as shown in Fig. 5 (see more images in Noel et al., 2004). Furthermore, particles
Fig. 5.Typical CPI images taken in the 29 July case on the WB-57.
with maximum dimensions smaller than 55 µm, which are generally assumed to be quasi-spherical, contributed 69 % of the surface area measured by the CPI (Fig. 4a). Thus, the dis-torted particles with aspect ratios near unity retrieved by the RSP appear qualitatively consistent with these CPI statistics. We consider this consistency as more of a corroboration than a confirmation, since the CPI data measurements are merely two-dimensional projections and suffer from sampling bi-ases as well as possible shattering effects (e.g. Korolev and Isaac, 2003; Korolev et al., 2011). The RSP results are also consistent with the dominance of irregular particles with as-pect ratios near unity in cloud tops derived from lidar de-polarization measurements (Noel et al., 2004). Furthermore, rough crystals were also found to be consistent with measure-ments made by the Cloud and Aerosol Spectrometer (CAS) throughout the CRYSTAL-FACE campaign (Baumgardner, 2005).
3.2 7 July 2002
Fig. 6.Same as Fig. 3 but for 7 July and without CIN retrievals.
roughly 1.5 h are shown in Fig. 6, along with CRS radar reflectivity and MAS 11 µm brightness temperature heights (Fig. 6a). This case was selected because the Citation air-craft carrying the CIN performed a spiral maneuver in the system at around 20:00 UTC, allowing a vertical profile of CIN measurements. Unfortunately, no CPI classifications or images are available. The data from the ER-2 and Citation were shifted and stretched/squeezed in time according to the flight paths and by matching features in the data. The radar reflectivities shown in Fig. 6a resemble those measured on 29 July (Fig. 3a) with a thick anvil that has a top near 12 km and high reflectivities extending down to the surface at some locations, indicative of precipitation. The mean solar zenith and relative azimuth angles corresponding to the RSP mea-surements for this case are 22◦and 50◦, respectively.
Figure 6a shows cloud-top heights retrieved by RSP vary-ing around 12 km, which is consistent with the radar data. The difference between minimum and maximum cloud-top heights retrieved with the Rayleigh method (Sect. 2.2) is
somewhat greater than in the previous case, presumably ow-ing to the more heterogeneous cloud top. MAS 11 µm bright-ness temperature heights are about 1 km higher than the me-dian height from the Rayleigh method but are close to the maximum Rayleigh height.
Optical thicknesses (Fig. 6b) range from 1 to about 55. Asymmetry parameters (Fig. 6c) range from 0.74 to 0.77 with a median of 0.76. Aspect ratios (Fig. 6e) are again close to unity with a median of 0.86, and the median distortion is 0.5 (Fig. 6d).
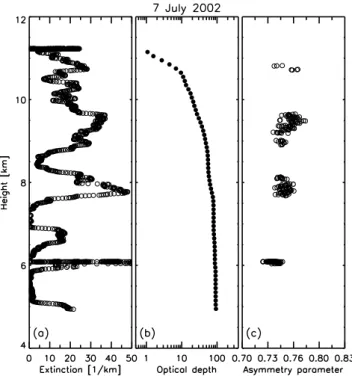
Fig. 7.CIN retrievals of extinction(a); optical depth(b); and asym-metry parameter(c)for data collected during the spiral of the Cita-tion aircraft on 7 July 2002.
might be attributable to the facts that the sampled storm was quickly evolving and that the CIN and RSP measurements were obtained at a 1 h time difference and at different loca-tions. At cloud top, asymmetry parameters retrieved by the CIN range from 0.74 to 0.77, with a median of 0.76 that, in contrast to the previous case, compares remarkably well with the RSP retrievals. Furthermore, asymmetry parameters from the CIN show a slight increase with height, which might explain part of the discrepancy between asymmetry parame-ters retrieved by the CIN and RSP on 29 July, as discussed in Sect. 3.1. As particle size generally increases with decreasing height (Lawson et al., 2010; van Diedenhoven et al., 2012b) and particle aspect ratio is expected to increase somewhat with size (Auer and Veal, 1970; Korolev and Isaac, 2003), asymmetry parameters might be expected to increase with decreasing height rather than decrease, as found here. We speculate that the slight increase of asymmetry parameter with decreasing height might result from an increase of par-ticle distortion or surface roughness.
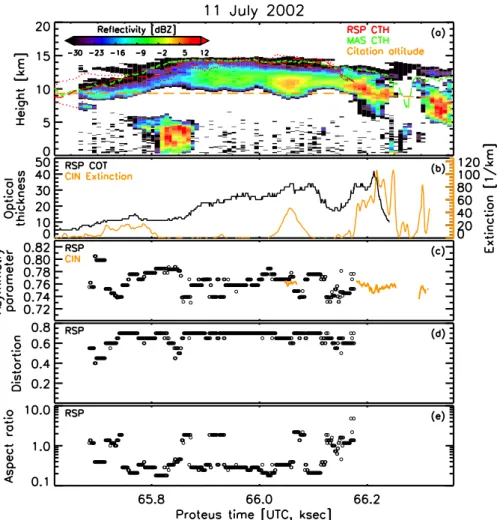
3.3 11 July 2002
On 11 July 2002, storms developed at around 16:00 UTC on Florida’s southeast coast (Fig. 2b) with outflow advecting westward (Chepfer et al., 2005; Lopez et al., 2006). Here we focus only on the northern storm since not all data are avail-able for the southern storm. As seen in Fig. 8a, at around 18:30 UTC the anvil, aged by roughly 1.5 h, generally
ex-tends from 8–15 km altitude (Lopez et al., 2006). The data from the ER-2 and Citation used here lagged the RSP data by about 10 and 20 min, respectively, and were shifted and stretched/squeezed in time according to the flight paths and by matching features in the data. The mean solar zenith and relative azimuth angles for this case are 13◦and 55◦, respec-tively.
Cloud-top heights from RSP, MAS and the radar gener-ally agree well (Fig. 8a). The difference between minimum and maximum cloud-top heights retrieved with the Rayleigh method (Sect. 2.2) is somewhat greater than for the 29 July case, presumably owing to the more heterogeneous cloud top. At the edge of the cloud around 65.7 ks UTC, this differ-ence exceeded our threshold for performing RSP retrievals (3 km, see Sect. 2.2). At around 61.15 ks UTC, the Proteus started to perform a turn, leading to increasingly underes-timated cloud-top heights owing to changing aircraft atti-tude not accounted for in our data processing. Figure 8a also shows that the Citation flew at about 9 km and only sampled the cloud when the bottom dropped below that altitude.
Optical thicknesses generally ranged from 5 to 40 and cor-relate with radar reflectivity (Fig. 8b). At the location where the CIN sampled the bottom of the cloud, extinction values up to 100 km−1occur and also correlate with radar reflectiv-ity.
Retrieved asymmetry parameters (Fig. 8c) are between about 0.72 and 0.8 and show more variation than seen in the 29 July case (Fig. 3c). Both RSP and CIN retrieve me-dian asymmetry parameters of 0.76 for this case, which is slightly smaller than retrieved by RSP in the previous case. Although CIN sampled the very bottom of the cloud, vertical profiles presented by Garrett et al. (2005) and in Sects. 3.2 and 3.4 show weak variation of the asymmetry parameter with altitude. Median distortion is 0.7, which is the upper limit in our LUT, and substantially greater than distortion values retrieved in the 29 July case. The retrieved aspect ra-tios (Fig. 8e) with a median value of 0.33 are also consider-ably more different from unity than seen in the previous case and show more variability.
Fig. 8.Same as Fig. 3 but for 11 July.
3.4 21 July 2002
Several storms developed on the east coast of Florida at around 18:00 UTC on 21 July, 2002 and relatively strong winds advected the anvils southeastwards off the coast, where they were sampled by the Proteus, Citation and WB-57 aircraft. No radar or MAS measurements are available since the ER-2 did not fly that day but we include the case because the Citation performed a spiral in the cloud. The structure and evolution of this system have been discussed in detail by Garrett et al. (2005). Around the time the RSP and CIN measurements were obtained, the sampled anvil started to detach from the storm that generated it. The vertical extent of the anvil is similar to that sampled on 11 July (8.5–14 km; Garrett et al., 2005). The mean solar zenith and relative az-imuth angles for the RSP data in this case are 24◦and 68◦, respectively.
Cloud-top heights vary over the anvil from about 10 to 14 km (Fig. 10a). The highest cloud tops occur at the down-wind, southern end of the storm (69.35 ks UTC) and strongly drop after about 69.4 ks UTC. The large differences between minimum and maximum cloud-top heights are retrieved by
the RSP for times before 69.12 ks UTC, presumably because of uncertainties in the angle aggregation owing to the rel-atively sharp edge of the cloud, as discussed in Sect. 2.2. Retrieved optical thicknesses peak at about 20 (Fig. 10b). Interestingly, the optical thickness peaks at a different loca-tion than the cloud-top height, indicating a sheared system. Near-collocated cloud-top heights retrieved using GOES-8 (Sherwood, 2004) compare well with the RSP retrievals (not shown).
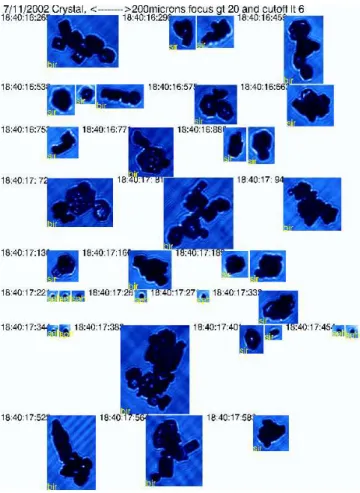
Fig. 9.Typical CPI images taken in the 11 July case on the WB-57.
to that obtained on 29 July (Fig. 3c). Individual CPI images have been shown by Garrett et al. (2005), and those acquired near the cloud top appear similar to those obtained on 29 July, which are shown in Fig. 5.
The vertical profile of extinction, optical depth and asym-metry parameters derived from the CIN measurements ob-tained around 19:30 UTC are shown in Fig. 11. The opti-cal depth is again opti-calculated by vertiopti-cally integrating me-dian extinction values in 100 m altitude bins. The same pro-files were shown by Garrett et al. (2005). However, extinc-tion and optical thickness values shown here are about 20 % greater than those in Garrett et al. (2005), while asymmetry parameters are about 0.05 lower, owing to a correction factor applied to the calibration parameters used in the 2005 pa-per. Thus, Fig. 11 can be considered a correction to (part of) Fig. 5 in Garrett et al. (2005). The optical thickness derived from the CIN extinction measurements is 27, which is some-what greater than the maximum value retrieved by the RSP (Fig. 10b). A qualitatively consistent discrepancy was found for the spiral obtained on 7 July (Sect. 3.2).
The asymmetry parameters retrieved by the CIN show a slight increase with height and are about 0.73 in the top of the cloud, which is smaller than the median values re-trieved by the RSP (0.76) although comparable with the
low-est values retrieved by RSP (0.74). Also, the median values retrieved by the RSP and CIN statistically agree within their combined uncertainties. Garrett et al. (2005) noted that a spi-ral performed by the WB-57 in the same anvil between 12.5 and 14.5 km still detected cloud at these altitudes, but only with extinction values below 0.2 km−1 and a total optical depth of about 0.1. These cloud particles were interpreted as a separate thin tropopause cirrus layer by Garrett et al. (2005). However, the gradual increase of cloud-top height at 69.1–69.4 ksec and the sudden drop thereafter, as seen in Fig. 10a, suggest a single cloud system with top heights ranging from about 10 to 14 km. Unfortunately, the WB-57 CIN instrument was not fully functioning and was not able to retrieve asymmetry parameters. Since the Citation did not reach the very top of the cloud at all locations, it is possible that the difference between asymmetry parameters retrieved by CIN and RSP are partly attributable to vertical variation if the asymmetry parameters in the very top are substantially greater than those at the altitudes of the CIN measurements. Furthermore, possible biases in RSP and CIN retrievals, as discussed in Sect. 3.1, could also be causing part of this dif-ference.
3.5 Discussion
The asymmetry parameter, distortion and aspect ratios re-trieved by RSP for all four cases are compared in Table 1, along with the CIN asymmetry parameters and CPI classifi-cations. Median asymmetry parameters retrieved by the RSP range from 0.76 to 0.78, with the maximum values obtained on 29 July. Greater variability (interquartile ranges) are seen for the detached anvils (11th and 21st July) compared to the thick convective clouds (29 and 7 July) with the retrievals for the 29th being the least variable. Between the four cases studied here, the CIN measurements show somewhat more variability, clumping into two cases near 0.73 and two others near 0.76.
Although the difference in median asymmetry parameters between the 29th and other cases is not below the estimated retrieval uncertainty of 0.04, the 29 July case stands out with large optical thickness and an apparently overshooting top. Furthermore, elevated dust layers were observed on 29 July (Sassen et al., 2003) and this storm had exceptionally strong lightning activity (Ott et al., 2010); both may have an effect on ice particle growth (e.g. Fridlind et al., 2004; Sherwood et al., 2006). The 29 July case also stands out because of the large difference between asymmetry parameters retrieved by the RSP and the CIN. Vertical variation of the asymmetry parameter may explain part of the difference between CIN and RSP retrievals in this case.
Fig. 10.RSP retrieval as a function of time for 21 July.(a)Cloud-top height with minimum and maximum retrieved heights in dotted lines; (b)cloud optical thickness;(c)asymmetry parameter,(d)distortion parameter; and(e)aspect ratios.
the fraction of total surface area contributed by particles with maximum dimensions larger than 55 µm, as measured by the CPI, as well as substantially fewer spherical particles and more large irregular particles appearing in the CPI images. This is the only storm in our study that evolved over land, which may have affected its dynamical structure (Futyan and Del Genio, 2007) and thereby the ice habits.
Ambient temperatures and ice supersaturation levels are known to influence the aspect ratios of the ice crys-tals and whether cryscrys-tals grow as plate- or column-like (e.g. Bailey and Hallett, 2009). For most of the cases studied here, plate-like aspect ratios (<1) and column-like aspect ra-tios (>1) are retrieved over the observed storms, consistent with varying mixtures of cloud-top particle shapes, includ-ing aggregates with both column and plate elements (Fig. 5), which could be indicative of varying crystal formation and evolution histories. Only for the 29 July case are aspect ratios
greater than unity always retrieved, indicating the consistent predominance of column-like crystals at cloud top.
4 Conclusions
Table 1.Median retrieved asymmetry parameters from RSP and CIN, median aspect ratios and median distortion from the RSP, CPI areal fraction of particles larger than 55 µm, and CPI classifications dominating particle area. Interquartile ranges are given in brackets.
Case Cloud sampled RSPg CINg RSP RSP CPI Main CPI classesa study aspect ratio distortion D >55 µm
29 July Deep convection 0.782 (±0.005) 0.732 (±0.014) 1.6 (±0.3) 0.45 (±0.05) 31 % SI (50 %), SPH (32 %) 7 July Deep convection 0.757 (±0.008) 0.762 (±0.019)b 0.86 (±0.1) 0.50 (±0.05) N/A N/A
11 July Detached anvil 0.767 (±0.024) 0.757 (±0.008) 0.33 (±1) 0.70 (±0.1) 55 % SI (40 %), LI (30 %) 21 July Detached anvil 0.759 (±0.012) 0.725 (±0.012)b 1.2 (±0.4) 0.50 (±0.1) 22 % SI (55 %), SPH (35 %)
aLI denotes large irregular; SI denotes small irregular; SPH denotes spherical. bValues in the top 1 km of CIN measurements.
Fig. 11.Same as Fig. 7 but for 21 July.
measurements. The asymmetry parameter of the hexagonal particle that yields the closest match to the measurements is considered the retrieved value. As discussed in Part 1, this method yields asymmetry parameters with an accuracy of about 5 %, or 0.04 in absolute terms. Additionally, an esti-mate is established for the microscale surface distortion of the ice crystals and the effective aspect ratios of their compo-nents. Cloud optical thickness and cloud-top heights are also obtained from the RSP measurements in this study.
Four case studies were analyzed: two cases of thick con-vective clouds and two cases of thinner (detached) anvil cloud layers. Median asymmetry parameters retrieved by the RSP range from 0.76 to 0.78. In general, the detached anvil clouds showed somewhat more variation in retrieved asym-metry parameter than the thick convective clouds. In all cases the measurements indicate roughened or distorted ice crys-tals, consistent with previous findings. Retrieved aspect ra-tios in three of the cases were found to be close to unity,
indi-cating that compact particles dominate the radiation, qualita-tively consistent with CPI images where available. Retrievals for the anvil sampled on 11 July indicated ice crystals con-sisting of plate-like components with aspect ratios around 0.3, consistent with the increased number of aggregates of plates seen in the CPI images obtained in this cloud layer.
Retrieved asymmetry parameters were compared to those determined by the Cloud Integrating Nephelometer (CIN), which obtained in situ measurements in the same cloud lay-ers. For one case sampling a thick convective cloud and one case sampling an anvil cloud, the median values of asymme-try parameter retrieved by CIN and RSP agree within 0.01. For the two other cases, however, RSP asymmetry parame-ters are systematically higher than those obtained by the CIN by about 0.03–0.05. Part of this bias might be explained by vertical variation of the asymmetry parameter, as the RSP re-trievals are estimated to be weighted towards the first optical depth of the cloud top, while the CIN probed deeper in the cloud. Also, the CIN measurements might have been affected by ice shattering on the probe.
situ and other remote sensing data obtained from other cam-paigns (e.g. TWP-ICE, TC4). Furthermore, in order to pro-vide a more rigorous evaluation of the capabilities of the ap-proach presented here, in situ instruments are required that that are not contaminated by shattering artifacts and possibly sample the scattering matrix elements across a wide range of scattering angles.
For the effective radii of the ice present in the tops of the studied clouds (20–50 µm, as indicated by GOES-8), typical parameterizations of ice crystal asymmetry parameters yield values from 0.78 to 0.83 (e.g. Fu, 1996; Chou et al., 2002; McFarquhar et al., 2002), which is generally larger than re-trieved for the case studies in this paper, although some other parameterizations yield lower asymmetry parameters (e.g., Mitchell et al., 1996; Edwards et al., 2007). The retrieved asymmetry parameters are also considerably smaller than those assumed in current satellite retrievals of ice cloud op-tical thickness and ice crystal effective radius (Baum et al., 2005b). As shown by, for example, van Diedenhoven et al. (2012b), such retrievals of ice crystal effective radius depend on the assumed ice model, primarily on the assumed asym-metry parameter. Although RSP provides the shortwave in-frared measurements that allow simultaneous retrieval of ice crystal effective radius (Nakajima and King, 1990), we did not include these retrievals in the present study. Simultane-ous retrievals of asymmetry parameter, effective radius and cloud optical thickness from RSP measurements would pro-vide an ideal means to study the sensitivity of effective radius retrievals to variations in asymmetry parameter.
Acknowledgements. This material is based upon work supported by the NASA ROSES program under grant number NNX11AG81G and by the NASA Radiation Science Program managed by Hal Maring in support of the SEAC4RS field experiment. We thank Andrzej Wasilewski for his help interpreting the level-1 RSP data.
Edited by: Q. Fu
References
Alexandrov, M. D., Cairns, B., Emde, C., Ackerman, A. S., and van Diedenhoven, B.: Accuracy assessments of cloud droplet size retrievals from polarized reflectance measurements by the research scanning polarimeter, Remote Sens. Environ., 125, 92– 111, doi:10.1016/j.rse.2012.07.012, 2012.
Auer, A. and Veal, D.: The dimension of ice crystals in natural clouds, J. Atmos. Sci, 27, 919–926, 1970.
Auriol, F., Gayet, J.-F., Febvre, G., Jourdan, O., Labonnote, L., and Brogniez, G.: In situ observation of cirrus scattering phase func-tions with 22◦ and 46◦ halos: cloud field study on 19 Febru-ary 1998, J. Atmos. Sci., 58, 3376–3390, doi:10.1175/1520-0469(2001)058<3376:ISOOCS>2.0.CO;2, 2001.
Bailey, M. P. and Hallett, J.: A comprehensive habit diagram for atmospheric ice crystals: confirmation from the laboratory, AIRS II, and other field studies, J. Atmos. Sci., 66, 2888–2899, doi:10.1175/2009JAS2883.1, 2009.
Baran, A. J.: A review of the light scattering properties of cirrus, J. Quant. Spectrosc. Rad. Transf., 110, 1239–1260, doi:10.1016/j.jqsrt.2009.02.026, 2009.
Baran, A. J., Shcherbakov, V. N., Baker, B. A., Gayet, J. F., and Lawson, R. P.: On the scattering phase-function of non-symmetric ice-crystals, Q. J. R. Meteor. Soc., 131, 2609–2616, doi:10.1256/qj.04.137, 2005.
Baum, B. A., Heymsfield, A. J., Yang, P., and Bedka, S. T.: Bulk scattering properties for the remote sensing of ice clouds, Pt. I: Microphysical data and models, J. Appl. Meteor., 44, 1885, doi:10.1175/JAM2308.1, 2005a.
Baum, B. A., Yang, P., Heymsfield, A. J., Platnick, S., King, M. D., Hu, Y. X., and Bedka, S. M.: Bulk scattering properties for the remote sensing of ice clouds, Pt. II: Narrowband models, J. Appl. Meteor., 44, 1896–1911, 2005b.
Baum, B. A., Yang, P., Heymsfield, A. J., Schmitt, C. G., Xie, Y., Bansemer, A., Hu, Y.-X., and Zhang, Z.: Improvements in shortwave bulk scattering and absorption models for the remote sensing of ice clouds, J. Appl. Meteor. Clim., 50, 1037–1056, doi:10.1175/2010JAMC2608.1, 2011.
Baumgardner, D.: The shapes of very small cirrus particles derived from in situ measurements, Geophys. Res. Lett., 32, L01806, doi:10.1029/2004GL021300, 2005.
Bodhaine, B. A., Wood, N. B., Dutton, E. G., and Slusser, J. R.: On rayleigh optical depth calculations, J. At-mos. Ocean. Tech., 16, 1854–1861, doi:10.1175/1520-0426(1999)016<1854:ORODC>2.0.CO;2, 1999.
Buriez, J., Vanbauce, C., and Parol, F.: Cloud detection and deriva-tion of cloud properties from POLDER, Int. J. Remote Sens., 18, 2785–2813, doi:10.1080/014311697217332, 1997.
Cairns, B., Russell, E. E., and Travis, L. D.: Research scanning polarimeter: calibration and ground-based measurements, Proc. SPIE, 3754, 186–196, avaiable at: http://adsabs.harvard.edu/abs/ 1999SPIE.3754..186C, 1999.
Cairns, B., Russell, E. E., LaVeigne, J. D., and Tennant, P. M. W.: Research scanning polarimeter and airborne usage for remote sensing of aerosols, Proc. SPIE, 5158, 33–44, doi:10.1117/12.518320, 2003.
Cetrone, J. and Houze, R. A.: Leading and trailing anvil clouds of West African squall lines, J. Atmos. Sci., 68, 1114–1123, doi:10.1175/2011JAS3580.1, 2011.
Chepfer, H., Noel, V., Minnis, P., Baumgardner, D., Nguyen, L., Raga, G., McGill, M. J., and Yang, P.: Particle habit in tropical ice clouds during CRYSTAL-FACE: comparison of two remote sensing techniques with in situ observations, J. Geophys. Res., 110, D16204, doi:10.1029/2004JD005455, 2005.
Chou, M.-D., Lee, K.-T., and Yang, P.: Parameterization of short-wave cloud optical properties for a mixture of ice particle habits for use in atmospheric models, J. Geophys. Res., 107, 4600, doi:10.1029/2002JD002061, 2002.
Chowdhary, J., Cairns, B., and Travis, L. D.: Case studies of aerosol retrievals over the ocean from multiangle, multispectral pho-topolarimetric remote sensing data, J. Atmos. Sci., 59, 383–397, doi:10.1175/1520-0469(2002)059<0383:CSOARO>2.0.CO;2, 2002.
Cox, C. and Munk, W.: Measurement of the roughness of the sea surface from photographs of the sun’s glitter, J. Opt. Soc. Amer-ica, 44, 838–850, doi:10.1364/JOSA.44.000838, 1954.
Cox, C. and Munk, W.: Slopes of the sea surface deduced from pho-tographs of sun glitter, Bull. Scripps Inst. Oceanogr., 6, 401–488, 1956.
de Haan, J., Bosma, P., and Hovenier, J.: The adding method for multiple scattering calculations of polarized light, Astron. As-troph., 183, 371–391, 1987.
Edwards, J., Havemann, S., Thelen, J.-C., and Baran, A.: A new parametrization for the radiative properties of ice crystals: Com-parison with existing schemes and impact in a GCM, Atmos. Res., 83, 19–35, doi:10.1016/j.atmosres.2006.03.002, 2007. Evans, K. F., Wang, J. R., Racette, P. E., Heymsfield, G., and Li,
L.: Ice cloud retrievals and analysis with the compact scan-ning submillimeter imaging radiometer and the cloud radar system during CRYSTAL-FACE, J. Appl. Met., 44, 839–859, doi:10.1175/JAM2250.1, 2005.
Francis, P. N., Jones, A., Saunders, R. W., Shine, K. P., Slingo, A., and Sun, Z.: An observational and theoretical study of the radia-tive properties of cirrus: some results from ICE’89, Q. J. R. Me-teorol. Soc, 120, 809–848, doi:10.1002/qj.49712051804, 1994. Fridlind, A. M., Ackerman, A. S., Jensen, E. J., Heymsfield, A. J.,
Poellot, M. R., Stevens, D. E., Wang, D., Miloshevich, L. M., Baumgardner, D., Lawson, R. P., Wilson, J. C., Flagan, R. C., Seinfeld, J. H., Jonsson, H. H., VanReken, T. M., Varutbangkul, V., and Rissman, T. A.: Evidence for the predominance of mid-tropospheric aerosols as subtropical anvil cloud nuclei., Science, 304, 718–22, doi:10.1126/science.1094947, 2004.
Fu, Q.: An accurate parameterization of the solar radiative proper-ties of cirrus clouds for climate models., J. Clim., 9, 2058–2082, doi:10.1175/1520-0442(1996)009<2058:AAPOTS>2.0.CO;2, 1996.
Fu, Q.: A new parameterization of an asymmetry factor of cir-rus clouds for climate models, J. Atmos. Sci., 64, 4140, doi:10.1175/2007JAS2289.1, 2007.
Futyan, J. M. and Del Genio, A. D.: Deep convective system evo-lution over Africa and the tropical atlantic, J. Clim., 20, 5041– 5060, doi:10.1175/JCLI4297.1, 2007.
Garrett, T. J.: Comments on “Effective radius of ice cloud parti-cle populations derived from aircraft probes”, J. Atmos. Ocean. Tech., 24, 1495–1503, doi:10.1175/JTECH2075.1, 2007. Garrett, T. J.: Observational quantification of the optical
proper-ties of cirrus cloud, in: Light Scattering Reviews 3, Springer Berlin Heidelberg, Berlin, Heidelberg, 3–26, doi:10.1007/978-3-540-48546-9, 2008.
Garrett, T. J., Hobbs, P. V., and Gerber, H.: Shortwave, single-scattering properties of arctic ice clouds, J. Geophys. Res., 106, 15155–15172, doi:10.1029/2000JD900195, 2001.
Garrett, T. J., Gerber, H., Baumgardner, D. G., Thohy, C. H., and Weinstock, E. M.: Small, highly reflective ice crys-tals in low-latitude cirrus, Geophys. Res. Lett., 30, 10–13, doi:10.1029/2003GL018153, 2003.
Garrett, T. J., Navarro, B. C., Twohy, C. H., Jensen, E. J., Baum-gardner, D. G., Bui, P. T., Gerber, H., Herman, R. L., Heyms-field, A. J., Lawson, P., Minnis, P., Nguyen, L., Poellot, M., Pope, S. K., Valero, F. P. J., and Weinstock, E. M.: Evo-lution of a Florida cirrus anvil, J. Atmos. Sci., 62, 2352, doi:10.1175/JAS3495.1, 2005.
Gayet, J. F., Cr´epel, O., Fournol, J. F., and Oshchepkov, S.: A new airborne polar nephelometer for the measurements of optical and microphysical cloud properties, Pt. I: Theoretical design, Ann. Geophys., 15, 451–459, doi:10.1007/s00585-997-0451-1, 1997. Gayet, J.-F., Shcherbakov, V., Mannstein, H., Minikin, A.,
Schu-mann, U., Str¨om, J., Petzold, A., Ovarlez, J., and Immler, F.: Mi-crophysical and optical properties of midlatitude cirrus clouds observed in the southern hemisphere during INCA, Q. J. R. Me-teor. Soc., 132, 2719–2748, doi:10.1256/qj.05.162, 2006. Gayet, J.-F., Mioche, G., Bugliaro, L., Protat, A., Minikin, A.,
Wirth, M., D¨ornbrack, A., Shcherbakov, V., Mayer, B., Gar-nier, A., and Gourbeyre, C.: On the observation of unusual high concentration of small chain-like aggregate ice crystals and large ice water contents near the top of a deep convective cloud during the CIRCLE-2 experiment, Atmos. Chem. Phys., 12, 727–744, doi:10.5194/acp-12-727-2012, 2012.
Gerber, H., Takano, Y., Garrett, T. J., and Hobbs, P. V.: Nephelome-ter measurements of the asymmetry parameNephelome-ter, volume extinc-tion coefficient, and backscatter ratio in arctic clouds, J. Atmos. Sci., 57, 3021–3034, 2000.
Hansen, J. E. and Travis, L. D.: Light scattering in plan-etary atmospheres, Space Sci. Rev., 16, 527–610, doi:10.1007/BF00168069, 1974.
Hess, M., Koelemeijer, R. B., and Stammes, P.: Scattering ma-trices of imperfect hexagonal ice crystals, J. Quant. Spectrosc. Rad. Transf., 60, 301–308, doi:10.1016/S0022-4073(98)00007-7, 1998.
Heymsfield, A. J., Schmitt, C., Bansemer, A., van Zadelhoff, G.-J., McGill, M. J., Twohy, C., and Baumgardner, D.: Effective radius of ice cloud particle populations derived from aircraft probes, J. Atmos. Ocean. Tech., 23, 361–380, doi:10.1175/JTECH1857.1, 2006.
Houze, R. A.: Structures of atmospheric precipitation systems: A global survey, Radio Sci., 16, 671–689, doi:10.1029/RS016i005p00671, 1981.
King, M. D., Platnick, S., Yang, P., Arnold, G. T., Gray, M. A., Riedi, J. C., Ackerman, S. A., and Liou, K.-N.: Remote sens-ing of liquid water and ice cloud optical thickness and effective radius in the Arctic: application of airborne multispectral MAS data, J. Atmos. Ocean. Tech., 21, 857–875, doi:10.1175/1520-0426(2004)021<0857:RSOLWA>2.0.CO;2, 2004.
Knobelspiesse, K., Cairns, B., Redemann, J., Bergstrom, R. W., and Stohl, A.: Simultaneous retrieval of aerosol and cloud properties during the MILAGRO field campaign, Atmos. Chem. Phys., 11, 6245–6263, doi:10.5194/acp-11-6245-2011, 2011.
Knobelspiesse, K., Cairns, B., Mishchenko, M., Chowdhary, J., Tsi-garidis, K., van Diedenhoven, B., Martin, W., Ottaviani, M., and Alexandrov, M.: Analysis of fine-mode aerosol retrieval capabil-ities by different passive remote sensing instrument designs, Opt. Express, 20, 21457, doi:10.1364/OE.20.021457, 2012.
Korolev, A. V. and Isaac, G.: Roundness and aspect ratio of particles in ice clouds, J. Atmos. Sci., 60, 1795–1808, 2003.
Korolev, A. V., Emery, E. F., Strapp, J. W., Cober, S. G., Isaac, G. A., Wasey, M., and Marcotte, D.: Small ice particles in tropo-spheric clouds: fact or artifact? Airborne icing instrumentation evaluation experiment, Bull. Amer. Meteor. Soc., 92, 967–973, doi:10.1175/2010BAMS3141.1, 2011.
in May and July 1998 during FIRE ACE, J. Geophys. Res., 106, 14989–15014, doi:10.1029/2000JD900789, 2001.
Lawson, R. P., Jensen, E., Mitchell, D. L., Baker, B., Mo, Q., and Pilson, B.: Microphysical and radiative properties of tropical clouds investigated in TC4 and NAMMA, J. Geophys. Res., 115, D00J08, doi:10.1029/2009JD013017, 2010.
Li, L., Heymsfield, G. M., Racette, P. E., Tian, L., and Zenker, E.: A 94-GHz cloud radar system on a NASA high-altitude ER-2 air-craft, J. Atmos. Ocean. Tech., 21, 1378–1388, doi:10.1175/1520-0426(2004)021<1378:AGCRSO>2.0.CO;2, 2004.
Lopez, J. P., Fridlind, A. M., Jost, H.-J., Loewenstein, M., Ack-erman, A. S., Campos, T. L., Weinstock, E. M., Sayres, D. S., Smith, J. B., Pittman, J. V., Hallar, A. G., Avallone, L. M., Davis, S. M., and Herman, R. L.: CO signatures in subtropical con-vective clouds and anvils during CRYSTAL-FACE: an analy-sis of convective transport and entrainment using observations and a cloud-resolving model, J. Geophys. Res., 111, D09305, doi:10.1029/2005JD006104, 2006.
Macke, A., Mueller, J., and Raschke, E.: Single scattering properties of atmospheric ice crystals, J. Atmos. Sci., 53, 2813–2825, 1996. McFarquhar, G. M., Yang, P., Macke, A., and Baran, A. J.: A new parameterization of single scattering solar radiative properties for tropical anvils using observed ice crystal size and shape distribu-tions, J. Atmos. Sci., 59, 2458–2478, 2002.
Minnis, P., Kratz, D., and Coakley, J.: Clouds and the Earth’s Ra-diant Energy System (CERES) algorithm theoretical basis docu-ment, vol. 3: cloud analyses and radiance inversions (subsystem 4), NASA RP 1376, 3, 135–176, 1995.
Minnis, P., Yost, C. R., Sun-Mack, S., and Chen, Y.: Estimating the top altitude of optically thick ice clouds from thermal infrared satellite observations using CALIPSO data, Geophys. Res. Lett., 35, L12801, doi:10.1029/2008GL033947, 2008.
Mishchenko, M. I. and Sassen, K.: Depolarization of Lidar Returns by Small Ice Crystals: An Application to Contrails, Geophys. Res. Lett., 25, 309–312, doi:10.1029/97GL03764, 1998. Mishchenko, M. I., Cairns, B., Kopp, G., Schueler, C. F., Fafaul,
B. A., Hansen, J. E., Hooker, R. J., Itchkawich, T., Maring, H. B., and Travis, L. D.: Accurate monitoring of terrestrial aerosols and total solar irradiance: introducing the glory mission, Bull. Am. Meteor. Soc., 88, 677, doi:10.1175/BAMS-88-5-677, 2007. Mitchell, D., Liu, Y., and Macke, A.: Modeling cirrus clouds, Pt. II:
Treatment of radiative properties, J. Atmos. Sci., 53, 2967–2988, 1996.
Nakajima, T. and King, M. D.: Determination of the op-tical thickness and effective particle radius of clouds from reflected solar radiation measurements, Pt. I: The-ory, J. Atmos. Sci., 47, 1878–1893, doi:10.1175/1520-0469(1990)047<1878:DOTOTA>2.0.CO;2, 1990.
Nelson, J.: Sublimation of Ice Crystals., J. Atmos. Sci., 55, 910– 919, doi:10.1175/1520-0469(1998)055<0910:SOIC>2.0.CO;2, 1998.
Noel, V., Winker, D., McGill, M., and Lawson, P.: Classi-fication of particle shapes from lidar depolarization ratios in convective ice clouds compared to in situ observations during CRYSTAL-FACE, J. Geophys. Res., 109, D24213, doi:10.1029/2004JD004883, 2004.
Noel, V., Winker, D. M., Garrett, T. J., and McGill, M.: Extinc-tion coefficients retrieved in deep tropical ice clouds from li-dar observations using a CALIPSO-like algorithm compared to
in-situ measurements from the cloud integrating nephelometer during CRYSTAL-FACE, Atmos. Chem. Phys., 7, 1415–1422, doi:10.5194/acp-7-1415-2007, 2007.
Ott, L. E., Pickering, K. E., Stenchikov, G. L., Allen, D. J., DeCaria, A. J., Ridley, B., Lin, R.-F., Lang, S., and Tao, W.-K.: Production of lightning NOx and its vertical
distribu-tion calculated from three-dimensional cloud-scale chemical transport model simulations, J. Geophys. Res., 115, D04301, doi:10.1029/2009JD011880, 2010.
Ottaviani, M., Cairns, B., Chowdhary, J., van Diedenhoven, B., Knobelspiesse, K., Hostetler, C., Ferrare, R., Burton, S., Hair, J., Obland, M., and Rogers, R.: Polarimetric retrievals of surface and cirrus clouds properties in the region affected by the Deep-water Horizon oil spill, Remote Sens. Environ., 121, 389–403, doi:10.1016/j.rse.2012.02.016, 2012.
Platnick, S.: Vertical photon transport in cloud remote sens-ing problems, J. Geophys. Res., 105, 22919–22935, doi:10.1029/2000JD900333, 2000.
Platt, C. M. R., Reynolds, D. W., and Abshire, N. L.: Satellite and Lidar observations of the albedo, emittance and optical depth of cirrus compared to model calcula-tions, Mon. Weather Rev., 108, 195–204, doi:10.1175/1520-0493(1980)108<0195:SALOOT>2.0.CO;2, 1980.
Sassen, K., Zhu, J., and Benson, S.: Midlatitude cirrus cloud climatology from the facility for atmospheric re-mote sensing, Pt. IV: Optical displays, Appl. Opt., 42, 332, doi:10.1364/AO.42.000332, 2003.
Sherwood, S. C.: Deep convective cloud-top heights and their ther-modynamic control during CRYSTAL-FACE, J. Geophys. Res., 109, D20119, doi:10.1029/2004JD004811, 2004.
Sherwood, S. C., Phillips, V. T. J., and Wettlaufer, J. S.: Small ice crystals and the climatology of lightning, Geophys. Res. Lett., 33, L05804, doi:10.1029/2005GL025242, 2006.
Stephens, G. L., Tsay, S.-C., Stackhouse, P. W., J., and Flatau, P. J.: The relevance of the microphysical and radiative properties of cirrus clouds to climate and climatic feedback, J. Atmos. Sci., 47, 1742–1754, 1990.
Takano, Y. and Liou, K.-N.: Solar Radiative Transfer in Cir-rus Clouds. Part I: Single-Scattering and Optical Proper-ties of Hexagonal Ice Crystals, J. Atmos. Sci., 46, 3–19, doi:10.1175/1520-0469(1989)046<0003:SRTICC>2.0.CO;2, 1989.
Ulanowski, Z., Hesse, E., Kaye, P., and Baran, A.: Light scattering by complex ice-analogue crystals, J. Quant. Spectrosc. Radiat. Transfer, 100, 382–392, doi:10.1016/j.jqsrt.2005.11.052, 2006. Um, J. and McFarquhar, G. M.: Single-scattering properties of
ag-gregates of bullet rosettes in cirrus, J. Appl. Meteor. Clim., 46, 757–775, doi:10.1175/JAM2501.1, 2007.
Um, J. and McFarquhar, G. M.: Single-scattering properties of aggregates of plates, Q. J. R. Meteorol. Soc, 135, 291–304, doi:10.1002/qj.378, 2009.
van de Hulst, H. C.: Light scattering by small particles, Dover Pub-lications, New York, 1957.
van Diedenhoven, B., Fridlind, A. M., Ackerman, A. S., and Cairns, B.: Evaluation of hydrometeor phase and ice properties in cloud-resolving model simulations of tropical deep convection using ra-diance and polarization measurements, J. Atmos. Sci., 69, 3290– 3314, doi:10.1175/JAS-D-11-0314.1, 2012b.
Vogelmann, A. M. and Ackerman, T. P.: Relating cirrus cloud properties to observed fluxes: a critical assess-ment, J. Atmos. Sci., 52, 4285–4301, doi:10.1175/1520-0469(1995)052<4285:RCCPTO>2.0.CO;2, 1995.
Yang, P., Kattawar, G., Hong, G., Minnis, P., and Hu, Y.: Uncertain-ties associated with the surface texture of ice particles in satellite-based retrieval of cirrus clouds - Part I: Single-scattering proper-ties of ice crystals with surface roughness, IEEE Trans. Geosci. Rem. Sens., 46, 1940–1947, doi:10.1109/TGRS.2008.916471, 2008.
Yang, P. and Fu, Q.: Dependence of ice crystal optical properties on particle aspect ratio, J. Quant. Spectrosc. Rad. Transf., 110, 1604–1614, doi:10.1016/j.jqsrt.2009.03.004, 2009.
Yang, P., Bi, L., Baum, B. A., Liou, K.-N., Kattawar, G. W., Mishchenko, M. I., and Cole, B.: Spectrally consistent scatter-ing, absorption, and polarization properties of atmospheric ice crystals at wavelengths from 0.2 µm to 100 µm, J. Atmos. Sci., 70, 330–347, doi:10.1175/JAS-D-12-039.1, 2013.
Zhang, Z., Yang, P., Kattawar, G., Riedi, J., Labonnote, L. C., Baum, B. A., Platnick, S., and Huang, H.-L.: Influence of ice par-ticle model on satellite ice cloud retrieval: lessons learned from MODIS and POLDER cloud product comparison, Atmos. Chem. Phys., 9, 7115–7129, doi:10.5194/acp-9-7115-2009, 2009. Zhang, Z., Platnick, S., Yang, P., Heidinger, A. K., and Comstock,