AMTD
4, 5389–5424, 2011Global distributions of hydrocarbons from
MIPAS RR measurements
A. Wiegele et al.
Title Page
Abstract Introduction
Conclusions References
Tables Figures
◭ ◮
◭ ◮
Back Close
Full Screen / Esc
Printer-friendly Version
Interactive Discussion
Discussion
P
a
per
|
Dis
cussion
P
a
per
|
Discussion
P
a
per
|
Discussio
n
P
a
per
|
Atmos. Meas. Tech. Discuss., 4, 5389–5424, 2011 www.atmos-meas-tech-discuss.net/4/5389/2011/ doi:10.5194/amtd-4-5389-2011
© Author(s) 2011. CC Attribution 3.0 License.
Atmospheric Measurement Techniques Discussions
This discussion paper is/has been under review for the journal Atmospheric Measurement Techniques (AMT). Please refer to the corresponding final paper in AMT if available.
Global distributions of C
2
H
6
, C
2
H
2
, HCN,
and PAN retrieved from MIPAS reduced
spectral resolution measurements
A. Wiegele, N. Glatthor, M. H ¨opfner, U. Grabowski, S. Kellmann, A. Linden, G. Stiller, and T. von Clarmann
Karlsruher Institut f ¨ur Technologie, Institut f ¨ur Meteorologie und Klimaforschung, Karlsruhe, Germany
Received: 29 July 2011 – Accepted: 10 August 2011 – Published: 19 August 2011 Correspondence to: A. Wiegele ([email protected])
AMTD
4, 5389–5424, 2011Global distributions of hydrocarbons from
MIPAS RR measurements
A. Wiegele et al.
Title Page
Abstract Introduction
Conclusions References
Tables Figures
◭ ◮
◭ ◮
Back Close
Full Screen / Esc
Printer-friendly Version
Interactive Discussion
Discussion
P
a
per
|
Dis
cussion
P
a
per
|
Discussion
P
a
per
|
Discussio
n
P
a
per
|
Abstract
Vertical profiles of mixing ratios of C2H6, C2H2, HCN, and PAN were retrieved from
MIPAS reduced spectral resolution nominal mode limb emission measurements. The retrieval strategy followed that of the analysis of MIPAS high resolution measurements, with occasional adjustments to cope with the reduced spectral resolution under which
5
MIPAS is operated since 2005. Largest mixing ratios are found in the troposphere, and reach 1.2 ppbv for C2H6, 1 ppbv for HCN, 600 pptv for PAN, and 450 pptv for C2H2. The estimated precision in case of significantly enhanced mixing ratios (including mea-surement noise and propagation of uncertain parameters randomly varying in the time domain) and altitude resolution are typically 10 %, 3–4.5 km for C2H6, 15 %, 4–6 km for
10
HCN, 6 %, 2.5–3.5 km for PAN, and 7 %, 2.5–4 km for C2H2.
1 Introduction
The MIPAS instrument onboard the ESA’s Envisat research satellite (Fischer et al., 2008) measures atmospheric limb emission in the mid-infrared (IR) spectral region in five spectral bands between 685 cm−1 and 2410 cm−1. From the spectra retrieval of a 15
high number of atmospheric constituents is possible. From June 2002 to March 2004 MIPAS measured at a spectral resolution of 0.025 cm−1
(high spectral resolution, HR). After a failure of the interferometer slide operation resumed in January 2005 at a de-graded spectra resolution of 0.0625 cm−1(reduced spectral resolution, RR), however at
improved horizontal and vertical sampling. Retrievals of temperature and stratospheric
20
constituents, namely H2O, O3, HNO3, CH4, N2O, ClONO2and ClO from reduced
spec-tral resolution spectra already have been published by von Clarmann et al. (2009b). In this paper we present RR retrievals of gases which are important in the upper troposphere: C2H6, C2H2, HCN, and PAN. These retrievals are performed with the
IMK-IAA research processor which is one of different MIPAS-Envisat processors.
AMTD
4, 5389–5424, 2011Global distributions of hydrocarbons from
MIPAS RR measurements
A. Wiegele et al.
Title Page
Abstract Introduction
Conclusions References
Tables Figures
◭ ◮
◭ ◮
Back Close
Full Screen / Esc
Printer-friendly Version
Interactive Discussion
Discussion
P
a
per
|
Dis
cussion
P
a
per
|
Discussion
P
a
per
|
Discussio
n
P
a
per
|
2 Measurements
The MIPAS instrument measures atmospheric emission in mid-IR in limb geometry from a sunsynchroneous polar orbit at an altitude of about 800 km. All of the mea-surements described in this paper are performed in the so-called reduced resolu-tion nominal mode with 27 tangent altitudes per limb scan. The scanning pattern
5
varies with latitude; the lowermost nominal tangent altitudes are 6 km close to the poles and 12 km at the equator. The uppermost tangent altitudes vary between 70 and 76 km, respectively. The tangent altitude increment increases with altitude from 1.5 km at the lowermost part of the scan pattern to 4 km at the uppermost altitudes (cf. http://www.atm.ox.ac.uk/group/mipas/rrmodes.html). The along-track sampling is
10
about 400 km. During one day close to 1500 profiles are measured in 15 orbits.
3 Retrieval
The retrieval follows the strategy described in von Clarmann et al. (2003), i.e. radiative transfer calculations are performed with the Karlsruhe Optimized and Precise Radiative Transfer Algorithm (KOPRA, (Stiller et al., 2002)); dedicated spectral regions (so-called
15
“microwindows”) are used instead of the entire spectral band in order to gain compu-tational efficiency and to reduce the signal of interfering species (von Clarmann and Echle, 1998; Echle et al., 2000); an empirical continuum emission as well as a zero-level calibration correction is jointly fitted to the spectra to reduce the sensitivity of the retrieval to weakly wavenumber-dependent inaccuracies of radiative transfer modelling
20
and calibration; a regularization scheme based on a Tikhonov-type first order finite differences scheme is used to stabilize the retrieval (Steck and von Clarmann, 2001; Tikhonov, 1963). The used spectroscopic dataset is Hitran04 (Rothman et al., 2005) and corresponding updates (e.g. Allen et al., 2005).
Since the species under assessment do not possess prominent spectral signatures,
25
AMTD
4, 5389–5424, 2011Global distributions of hydrocarbons from
MIPAS RR measurements
A. Wiegele et al.
Title Page
Abstract Introduction
Conclusions References
Tables Figures
◭ ◮
◭ ◮
Back Close
Full Screen / Esc
Printer-friendly Version
Interactive Discussion
Discussion
P
a
per
|
Dis
cussion
P
a
per
|
Discussion
P
a
per
|
Discussio
n
P
a
per
|
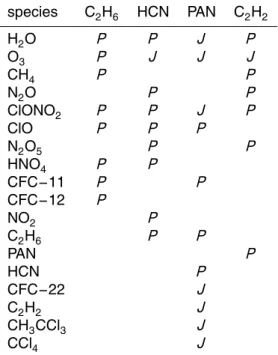
propagation of uncertainties in the abundances of interfering species, either vertical profiles resulting from a preceding retrieval of the interferents in a different spectral re-gion are used to model their contribution to the spectral signal (so-called “pre-fit”), or the abundances of the interferents are jointly fitted with the abundances of the target species (so-called “joint-fit”) (cf. Table 1). Temperature, tangent altitude information
5
and mixing ratios of the major contributors to the infrared spectrum were taken from von Clarmann et al. (2009b). The retrieval grid has a 1 km spacing up to 44 km and is coarser above (2 km up to 70 km and 5 km up to 120 km). For radiative transfer modelling, a horizontally homogeneous atmosphere in case of trace gas mixing ratios is assumed. However, for temperature, a linear horizontal variation was allowed in a
10
range of 400 km around the nominal geolocation of the limb scan. This improves the accuracy of the retrieval (Kiefer et al., 2010), and in many cases it helps to reduce the number of convergence failures.
3.1 Retrieval of C2H6
The retrieval procedure for the MIPAS HR spectra of C2H6was developed by von
Clar-15
mann et al. (2007) and Glatthor et al. (2009). The retrievals of C2H6 from reduced
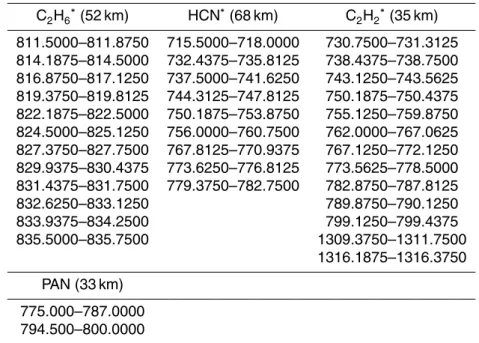
resolution spectra is performed as described there. Despite the different spectral reso-lution and tangent altitude grid, their retrieval setup proved robust also for the reduced resolution measurements and required no major modification. The highest tangent al-titude used is 52 km. The microwindows used are located between 811.5 cm−1 and 20
835.75 cm−1(cf. Tab. 2).
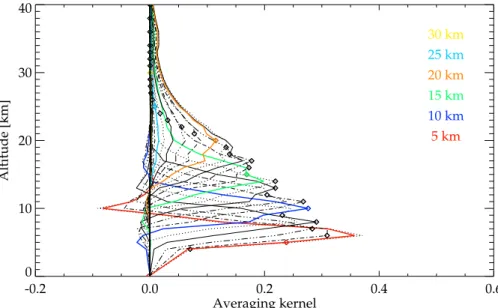
The regularization chosen leads to the averaging kernels as shown in Fig. 1. While the peak values of the averaging kernels are decreasing with altitude and the averaging kernels are broadened, they are still well-behaved in a sense that they are roughly symmetric and peak at the nominal altitudes. The only awkward feature is the strong
25
negative side wiggle of the 5 km averaging kernel at 10 km.
AMTD
4, 5389–5424, 2011Global distributions of hydrocarbons from
MIPAS RR measurements
A. Wiegele et al.
Title Page
Abstract Introduction
Conclusions References
Tables Figures
◭ ◮
◭ ◮
Back Close
Full Screen / Esc
Printer-friendly Version
Interactive Discussion
Discussion
P
a
per
|
Dis
cussion
P
a
per
|
Discussion
P
a
per
|
Discussio
n
P
a
per
|
above. Since the altitude resolution of HR measurements remains better than 7 km at higher altitude and reaches similar values in the troposphere, the altitude resolution of RR is a little weaker than that of HR.
The horizontal resolution of the measurement was estimated using the method by von Clarmann et al. (2009a). The horizontal information smearing calculated as the
5
halfwidth of the horizontal component of the 2-D averaging kernel is approximately 410 km at altitudes below 15 km and about 480 km above (see Table 4).
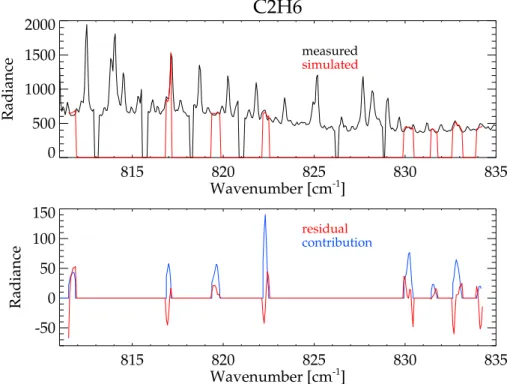
In Fig. 2 the measured and modelled spectrum and the fit residual of both are dis-played. In comparison to the residual the spectral contribution of C2H6 is shown in
the lower part of the plot. The noise eqivalent spectral radiance NESR in the
spec-10
tral range is about 10.4 nW/(cm2sr cm−1) while the root of mean squares RMS of the
residual is 29.5 nW/(cm2sr cm−1). The part of the residuals not explained by the noise
is attributed to parameter uncertainties disscused below but nevertheless the spectral contribution of C2H6exceeds the residual.
The estimated retrieval errors are dominated by measurement noise at the
lower-15
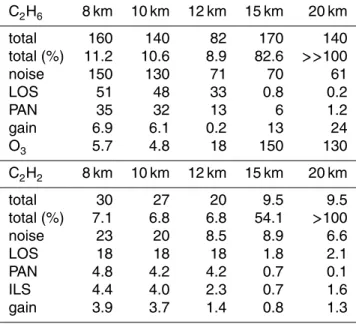
most altitudes (cf. Table 3) and by propagation of ozone uncertainties at altitudes at and above 15 km. The total random (noise plus propagation of random parameter un-certainties) retrieval error is estimated at 76 to 158 pptv for altitudes of 8 to 12 km. This corresponds to a relative error of about 11 % at altitudes up to 12 km for measurements of quite strong mixing ratios, such as in a pollution plume.
20
3.2 Retrieval of C2H2
A method retrieving C2H2 from MIPAS HR spectra was developed by Glatthor et al.
(2007). Their C2H2is fitted jointly with PAN between 775 cm− 1
and 800 cm−1. In
con-trast, we use C2H2 emissions in the 730.75 cm−1 and 787.8125 cm−1 spectral region
(see Table 2), and we use prefitted PAN mixing ratios. In our retrieval, ozone is the only
25
AMTD
4, 5389–5424, 2011Global distributions of hydrocarbons from
MIPAS RR measurements
A. Wiegele et al.
Title Page
Abstract Introduction
Conclusions References
Tables Figures
◭ ◮
◭ ◮
Back Close
Full Screen / Esc
Printer-friendly Version
Interactive Discussion
Discussion
P
a
per
|
Dis
cussion
P
a
per
|
Discussion
P
a
per
|
Discussio
n
P
a
per
|
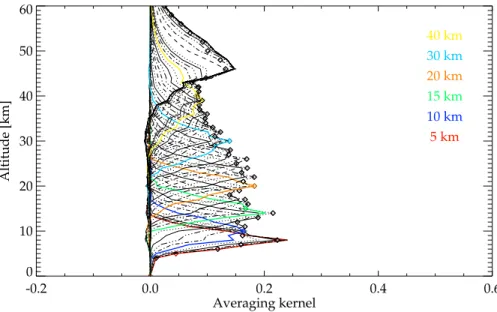
The averaging kernels are displayed in Fig. 3. The vertical resolution of RR is better than 4 km below 18 km and worse than 8 km above 24 km and. Negative side wig-gles are even more pronounced than those of C2H6. The vertical resolution is slightly
improved compared to HR at altitudes below 18 km but worse above. The horizontal information smearing is 229 km (see Table 4).
5
The spectral contribution of C2H2 is much higher than that of C2H6 (see Fig. 4).
While an NESR of 22.2 nW/(cm2sr cm−1) is expected and the residual RMS is
46.22 nW/(cm2sr cm−1
) the contribution of C2H2 to the simulated spectrum exceeds
the residual by a few times.
The retrieval error of the C2H2 retrieval is dominated by noise and tangent altitude
10
uncertainties (see Table 3). The total random retrieval error is estimated at 20 to 30 pptv for altitudes of 8 to 12 km. The total random retrieval error at high mixing ratios is at about 7 %. Again, relative errors are increasing strongly above the altitudes of signifi-cant prominence, here at about 13 km.
3.3 Retrieval of HCN
15
First MIPAS full resolution retrievals of HCN were developed by Glatthor et al. (2007). In contrast to their retrieval setup, here we jointly fit O3 instead of using pre-fitted O3
mixing ratios. This leads to a better agreement between measured and modelled radi-ances and hints at inconsistencies of ozone spectroscopic data in the spectral region used for the HCN retrieval and that used for the regular O3 retrievals. Since ozone
20
uncertainties are the dominating parameter error source of the HCN retrieval, this ad-ditional effort is justified. Further, we use a different set of microwindows, to cope with worse spectral interference problem at the reduced spectral resolution (cf. Table 2). The use of the original microwindow set of the full resolution retrievals would lead to a high bias of HCN at altitudes above 30 km.
25
The averaging kernels of HCN yield smaller peak values than those of C2H6 and
AMTD
4, 5389–5424, 2011Global distributions of hydrocarbons from
MIPAS RR measurements
A. Wiegele et al.
Title Page
Abstract Introduction
Conclusions References
Tables Figures
◭ ◮
◭ ◮
Back Close
Full Screen / Esc
Printer-friendly Version
Interactive Discussion
Discussion
P
a
per
|
Dis
cussion
P
a
per
|
Discussion
P
a
per
|
Discussio
n
P
a
per
|
40 km, it is worse than 10 km. Compared to HCN HR measurements (Glatthor et al., 2007) the altitude resolution at RR is slightly improved. The horizontal information smearing is approximately 425 km at altitudes below 15 km and about 500 km above (see Table 4).
The residual between the measured and the modelled spectrum is plotted in Fig. 6
5
along with the measured and the modelled spectrum. While NESR is at about 13.4 nW/(cm2sr cm−1) the RMS of the residual is at about 40.0 nW/(cm2sr cm−1). The
spectral contribution of HCN outmatches the residual in most microwindows signifi-cantly.
Random parameter errors are the main error source at most altitudes (see Table 3).
10
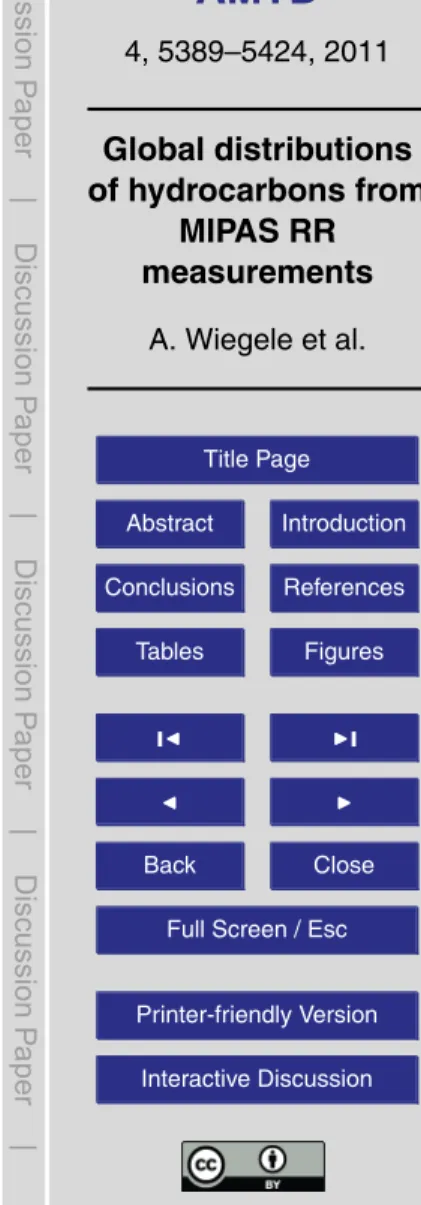
Depending on altitude, the error budget is dominated by tangent altitude pointing un-certainties, measurement noise, spectral shift, and at a few altitudes interference by N2O5. The total random retrieval error is estimated at 95 to 115 pptv for altitudes of 8
to 12 km and at 32 to 54 pptv for altitudes of 15 to 30 km. The relative error is less than 15 % at lowermost altitudes and less than 25 % up to 30 km.
15
3.4 Retrieval of PAN
The peroxyacetyl nitrate (PAN) retrieval from reduced resolution spectra has been mod-ified with respect to the PAN retrievals developed for full resolution MIPAS spectra by Glatthor et al. (2007). Like for HCN retrievals, O3is now jointly retrieved instead of
be-ing prefitted. The microwindows have been adjusted slightly to the reduced resolution
20
spectra (cf. Table 2). Small microwindows in the 775 cm−1–800.0 cm−1spectral region
were merged. This led to a better determined retrieval of the background continuum since in our retrieval the jointly fitted background continuum assigns one continuum variable per microwindow. However, the gap between 790.5 cm−1and 794.5 cm−1has
been kept in order to avoid interference problems with the CO2Q-branch at 792 cm− 1
.
25
AMTD
4, 5389–5424, 2011Global distributions of hydrocarbons from
MIPAS RR measurements
A. Wiegele et al.
Title Page
Abstract Introduction
Conclusions References
Tables Figures
◭ ◮
◭ ◮
Back Close
Full Screen / Esc
Printer-friendly Version
Interactive Discussion
Discussion
P
a
per
|
Dis
cussion
P
a
per
|
Discussion
P
a
per
|
Discussio
n
P
a
per
|
horizontal information smearing is approximatly 315 km at altitudes below 15 km and about 495 km above (see Table 4).
Figure 8 exibits the spectra, the spectral residual and the contribution of PAN at a single retrieval. The expected NESR is about 10.8 nW/(cm2sr cm−1) and the RMS of
the residual is about 26.9 nW/(cm2sr cm−1). The contribution of PAN exceeds the RMS 5
clearly.
Dominating error sources are measurement noise and tangent altitude pointing un-certainty (Table 3). The total random retrieval error is estimated at 27 to 45 pptv for altitudes of 8 to 12 km. The total relative error in lowermost altitudes is about 7 % and less.
10
4 Results
In the following, we show selected examples of measurements in October 2007. This period has been selected because of the plumes which are formed by biomass burning regularly at October in southern midlatitudes (Singh et al., 1996; Glatthor et al., 2009). Single orbit volume mixing ratios (vmr) as well as monthly mean vmrs will be shown.
15
4.1 C2H6
Ethane (C2H6) is the most important non-methane hydrocarbon (Singh et al., 2001) in
the troposphere. Its sources are supposed to be anthropogenically or production by biomass burning. While most recent papers (e.g. Xiao et al., 2008) estimate industrial activity as dominating, former ones (Rudolph, 1995) propose equality between both
20
sources. Dominating sinks are reaction with OH in the troposphere and with atomic chlorine (Cl) in the stratosphere (Aikin et al., 1982).
Mixing ratios of C2H6measured by MIPAS close to the tropopause often reach values
AMTD
4, 5389–5424, 2011Global distributions of hydrocarbons from
MIPAS RR measurements
A. Wiegele et al.
Title Page
Abstract Introduction
Conclusions References
Tables Figures
◭ ◮
◭ ◮
Back Close
Full Screen / Esc
Printer-friendly Version
Interactive Discussion
Discussion
P
a
per
|
Dis
cussion
P
a
per
|
Discussion
P
a
per
|
Discussio
n
P
a
per
|
this latitude for the first time at the shown orbit. For HR measurements (Glatthor et al., 2009) mixing ratios up to 700 pptv at single locations were found.
We observed the maximium monthly mean mixing ratios of C2H6in October 2007 at
about 800 pptv. For monthly means of the same month in different years the RR mixing ratios fit well to the HR mixing ratios. In October 2003 Glatthor et al. (2009) found
5
mixing ratios of about 600 pptv close to Africa, while RR measurements in October 2007 show mixing ratios of about 800 pptv above the southern Atlantic Ocean at most similar latitudes (Fig. 10). In addition, mean HR mixing ratios of C2H6for another time
period close to October 2003 (von Clarmann et al., 2007) show comparable mixing ratios as well (approx. 600 pptv) with maximum values at a biomass burning plume
10
location.
Outside of the tropics in lower altitudes and thus below tropopause as well, less prominent but nevertheless significant enhancements of C2H6can be found at northern
latitudes especially above Asia (Fig. 10). These generally higher values in the northern hemisphere may be attributed to antropogenic activities.
15
4.2 C2H2
The sources and sinks of ethine (C2H2) are similar to those of ethane, although the relative importance of biomass burning is larger (Singh et al., 1996).
Similar as the pollutants discussed before, MIPAS measurements of C2H2show
sig-nificantly increased mixing ratios at 30◦S at the orbit plotted in Fig. 11. Mixing ratios 20
up to 400 pptv are reached there, while few other measurements reach about 100 pptv and most of them are close to zero. Glatthor et al. (2007) found mixing ratios of C2H2
at single MIPAS HR measurements performed in October until December 2003 of up to 400 pptv as well.
The monthly mean mixing ratios reveal a global background of about 40 pptv or
25
AMTD
4, 5389–5424, 2011Global distributions of hydrocarbons from
MIPAS RR measurements
A. Wiegele et al.
Title Page
Abstract Introduction
Conclusions References
Tables Figures
◭ ◮
◭ ◮
Back Close
Full Screen / Esc
Printer-friendly Version
Interactive Discussion
Discussion
P
a
per
|
Dis
cussion
P
a
per
|
Discussion
P
a
per
|
Discussio
n
P
a
per
|
et al. (2010) show peak (approx. 200 pptv) and background (approx. 50 pptv) mixing ratios very close to our MIPAS RR monthly mean mixing ratios.
Singh et al. (1996) measured median mixing ratios in polluted air masses by in situ measurements above the southern Atlantic Ocean of 160 pptv and 50 pptv as back-ground at 11.5 km in September and October 1992.
5
4.3 HCN
HCN is well mixed in the troposphere and has slowly decreasing mixing ratios due to loss by reaction with OH and O(1D) in the stratosphere (Cicerone and Zellner, 1983). Spaceborne measurements (Rinsland et al., 1998) led to the conclusion that HCN mainly is produced by biomass burning and may be utilised as a tracer for such events
10
(Singh et al., 2001; Li et al., 2003; Glatthor et al., 2007).
Mixing ratios of HCN at the sample orbit (Fig. 13) exhibit mixing ratios of about 200 pptv at lowermost altitudes close to tropopause throughout all latitudes. Polluted air masses show mixing ratios up to 1 ppbv. Glatthor et al. (2009) obtained mixing ratios of about 300 pptv by HR single measurements at all latidues and longitudes at
15
12 km altitude. HR peak values reach 500 pptv. ATMOS measurements (Rinsland et al., 1998) reveal mixing ratios close to 1 ppbv at one measurement and above 400 pptv for a few others at comparable altitudes while background values are between 200 and 300 pptv.
While the HR measurements performed by Glatthor et al. (2009) for October 2003
20
reach monthly means of 500 pptv, the RR mixing ratios exceed 600 pptv above the southern Atlantic Ocean in October 2007 at 12 km (Fig. 14) at the same altitude. Re-gional enhancements of HCN polewards of 40◦at 8 km are found in both hemispheres.
They are presumed to be advected from biomass burning event at lower latitudes or boreal fires.
AMTD
4, 5389–5424, 2011Global distributions of hydrocarbons from
MIPAS RR measurements
A. Wiegele et al.
Title Page
Abstract Introduction
Conclusions References
Tables Figures
◭ ◮
◭ ◮
Back Close
Full Screen / Esc
Printer-friendly Version
Interactive Discussion
Discussion
P
a
per
|
Dis
cussion
P
a
per
|
Discussion
P
a
per
|
Discussio
n
P
a
per
|
4.4 PAN
Peroxyacetyl nitrate (PAN) is produced from tropospheric precursors. The precursors are hydrocarbons which have been transformed at different steps to a peroxyacetyl radical CH3C(O)OO. A reversible reaction of the peroxyacetyl radical with nitrate (NO2) leads to PAN. The lifetime of PAN is strongly temperature dependent (Singh, 1987) with
5
up to 5 months at 250 K and about an hour at 298 K. Thus the lifetime at the tropopause level exceeds the lifetime in lower troposphere and upper stratosphere.
Peak mixing ratios of PAN measured by MIPAS at reduced spectral resolution reach more than 500 pptv (Fig. 15). At several other locations mixing ratios up to 250 pptv are obtained. The RR monthly mean measurements show background values of about
10
100 pptv except of northern midlatitudes and northwards (Fig. 16). There, more than 200 pptv are reached at most locations. At polluted areas, e.g. the southern Atlantic Ocean at 12 km, PAN mixing ratios exceed 400 pptv.
Upper tropospheric ten-day mean PAN mixing ratios in October 2003, which falls in the MIPAS HR period, reach 500 pptv (Glatthor et al., 2007); their tropospheric
back-15
ground mixing ratios were below 100 pptv at southern latitudes and about 150 pptv at northern latitudes. Further MIPAS HR retrievals were performed by Moore and Reme-dios (2010). These authors found similar backgrounds at global monthly means in January 2003. Their peak values are close to 500 pptv at 300 hPa and about 225 pptv at 201 hPa. These HR results are in good agreement to our PAN results retrieved from
20
MIPAS RR spectra.
AMTD
4, 5389–5424, 2011Global distributions of hydrocarbons from
MIPAS RR measurements
A. Wiegele et al.
Title Page
Abstract Introduction
Conclusions References
Tables Figures
◭ ◮
◭ ◮
Back Close
Full Screen / Esc
Printer-friendly Version
Interactive Discussion
Discussion
P
a
per
|
Dis
cussion
P
a
per
|
Discussion
P
a
per
|
Discussio
n
P
a
per
|
5 Conclusions
MIPAS onboard Envisat is able to measure pollutants in the upper troposphere also at reduced spectral resolution which is applied since beginning of 2005. HCN, PAN, and C2H2can be measured with a slightly better altitude resolution compared to the high
spectral resolution mode at most levels. Only the C2H6measurements have a reduced
5
altitude resolution. The improvements refer particularly to the upper troposphere. In case of significantly enhanced mixing ratios, like in biomass burning plumes, the total relative random errors of all species under assessment are 15 % or below. Plumes of different compositions and different mixing ratio enhancements can be found.
The retrieved mixing ratios at reduced spectral resolution are in good agreement
10
with the mixing ratios obtained by high resolution measurements or measured by other instruments. No indication for inconsistency between the different measurements has been detected. Comparison with results found in literature suggests that the chemical charakteristics of biomass burning plumes with respect to C2H6, C2H2, HCN, and PAN
have been quite similar in the time periods analyzed.
15
Acknowledgements. The work was funded by DFG under contract number GL 643/1-1, project POMODORO. ESA has provided MIPAS level-1. The retrievals of IMK/IAA were performed on the HP XC4000 of the Scientific Supercomputing Center (SSC) Karlsruhe under project grant MIPAS. IMK data analysis was supported by DLR under contract number 50EE0901.
References
20
Aikin, A. C., Herman, J. R., Maier, E. J., and McQuillan, C. J.: Atmospheric Chemistry of Ethane and Ethylene, J. Geophys. Res., 87(C4), 3105–3118, 1982. 5396
Allen, G., Remedios, J. J., Newnham, D. A., Smith, K. M., and Monks, P. S.: Improved mid-infrared cross-sections for peroxyacetyl nitrate (PAN) vapour, Atmos. Chem. Phys., 5, 47–56, doi:10.5194/acp-5-47-2005, 2005. 5391
25
AMTD
4, 5389–5424, 2011Global distributions of hydrocarbons from
MIPAS RR measurements
A. Wiegele et al.
Title Page
Abstract Introduction
Conclusions References
Tables Figures
◭ ◮
◭ ◮
Back Close
Full Screen / Esc
Printer-friendly Version
Interactive Discussion
Discussion
P
a
per
|
Dis
cussion
P
a
per
|
Discussion
P
a
per
|
Discussio
n
P
a
per
|
plume from biomass burning, in : Generalizations from a three-dimensional study of TRACE A carbon monoxide, J. Geophys. Res., 103, 28059–28077, 1998.
Cicerone, R. J. and Zellner, R.: The Atmospheric Chemistry of Hydrogen Cyanide (HCN), J. Geophys. Res., 88(C15), 10689–10696, 1983. 5398
Echle, G., von Clarmann, T., Dudhia, A., Flaud, J.-M., Funke, B., Glatthor, N., Kerridge, B.,
5
L ´opez-Puertas, M., Mart´ın-Torres, F. J., and Stiller, G. P.: Optimized spectral microwindows for data analysis of the Michelson Interferometer for Passive Atmospheric Sounding on the Environmental Satellite, Appl. Optics, 39, 5531–5540, 2000. 5391
Fischer, H., Birk, M., Blom, C., Carli, B., Carlotti, M., von Clarmann, T., Delbouille, L., Dudhia, A., Ehhalt, D., Endemann, M., Flaud, J. M., Gessner, R., Kleinert, A., Koopman, R., Langen,
10
J., L ´opez-Puertas, M., Mosner, P., Nett, H., Oelhaf, H., Perron, G., Remedios, J., Ridolfi, M., Stiller, G., and Zander, R.: MIPAS: an instrument for atmospheric and climate research, Atmos. Chem. Phys., 8, 2151–2188, doi:10.5194/acp-8-2151-2008, 2008. 5390
Glatthor, N., von Clarmann, T., Fischer, H., Funke, B., Grabowski, U., H ¨opfner, M., Kellmann, S., Linden, A., Milz, M., Steck, S., and Stiller, G.: Global peroxyacetyl nitrate (PAN) retrieval in
15
the upper troposphere from limb emission spectra of the Michelson Interferometer for Passive Atmospheric Sounding (MIPAS), Atmos. Chem. Phys., 7, 2775–2787, doi:10.5194/acp-7-2775-2007, 2007. 5393, 5394, 5395, 5397, 5398, 5399
Glatthor, N., von von Clarmann, T., Stiller, G., Funke, B., Koukouli, M. E., Fischer, H., Grabowski, U., H ¨opfner, M., Kellmann, S., and Linden, A.: Large-scale upper tropospheric
20
pollution observed by MIPAS HCN and C2H6 global distributions, Atmos. Chem. Phys., 9, 9619–9634, doi:10.5194/acp-9-9619-2009, 2009. 5392, 5396, 5397, 5398
Kiefer, M., Arnone, E., Dudhia, A., Carlotti, M., Castelli, E., von Clarmann, T., Dinelli, B. M., Kleinert, A., Linden, A., Milz, M., Papandrea, E., and Stiller, G.: Impact of temperature field inhomogeneities on the retrieval of atmospheric species from MIPAS IR limb emission
25
spectra, Atmos. Meas. Tech., 3, 1487–1507, doi:10.5194/amt-3-1487-2010, 2010. 5392 Li, Q., Jacob, D. J., Yantosca, R. M., Heald, C. L., Singh, H. B., Koike, M., Zhao, Y., Sachse, G.
W., and Streets, D. G.: A global three-dimensional model analysis of the atmospheric bud-gets of HCN and CH3CN: Constraints from aircraft and ground measurements, J. Geophys. Res., 108(D21), 8827, doi:10.1029/2002JD003075, 2003. 5398
30
AMTD
4, 5389–5424, 2011Global distributions of hydrocarbons from
MIPAS RR measurements
A. Wiegele et al.
Title Page
Abstract Introduction
Conclusions References
Tables Figures
◭ ◮
◭ ◮
Back Close
Full Screen / Esc
Printer-friendly Version
Interactive Discussion
Discussion
P
a
per
|
Dis
cussion
P
a
per
|
Discussion
P
a
per
|
Discussio
n
P
a
per
|
Parker, R. J., Remedios, J. J., Moore, D. P., and Kanawade, V. P.: Acetylene C2H2 retrievals from MIPAS data and regions of enhanced upper tropospheric concentrations in August 2003, Atmos. Chem. Phys. Discuss., 10, 29735–29771, doi:10.5194/acpd-10-29735-2010, 2010. 5397
Rinsland, C. P., Gunson, M. R., Wang, P.-H., Arduini, R. F., Baum, B. A., Minnis, P., Goldman,
5
A., Abrams, M. C., Zander, R., Mahieu, E., Salawitch, R. J., Michelsen, H. A., Irion, F. W., and Newchurch, M. J.: ATMOS/ATLAS 3 Infrared Measurements of Trace Gases in the November 1994 Tropical and Subtropical Upper Troposphere, J. Quant. Spectrosc. Ra., 60(5), 891–901, 1998. 5398
Rothman, L. S., Jacquemart, D., Barbe, A., Chris Benner, D., Birk, M., Brown, L. R., Carleer,
10
M. R., Chackerian, Jr., C., Chance, K., Coudert, L. H., Dana, V., Devi, V. M., Flaud, J.-M., Gamache, R. R., Goldman, A., Hartmann, J.-J.-M., Jucks, K. W., Maki, A. G., Mandin, J.-Y., Massie, S. T., Orphal, J., Perrin, A., Rinsland, C. P., Smith, M. A. H., Tennyson, J., Tolchenov, R. N., Toth, R. A., Vander Auwera, J., Varanasi, P., and Wagner, G.: The HITRAN 2004 molecular spectroscopic database, J. Quant. Spectrosc. Ra., 96, 139–204,
15
doi:10.1016/j.jqsrt.2004.10.008, 2005. 5391
Rudolph, J.: The tropospheric distribution and budget of ethane, J. Geophys. Res., 100(D6), 11369–11381, 1995. 5396
Singh, H.: Reactive nitrogen in the troposphere, Environ. Sci. Technol., 21(4), 320–327, 1987. 5399
20
Singh, H. B., Herlth, D., Kolyer, R., Chatfield, R., Viezee,W., Salas, L. J., Chen, Y., Bradshaw, J. D., Sandholm, S. T., Talbot, R., Gregory, G. L., Anderson, B., Sachse, G. W., Browell, E., Bachmeier, A. S., Blake, D. R., Heikes, B., Jacob, D., and H. E. Fuelberg: Impact of biomass burning emissions on the composition of the South Atlantic troposphere: Reactive nitrogen and ozone, J. Geophys. Res., 101(D19), 24203–24219, 1996. 5396, 5397, 5398, 5399
25
Singh, H., Chen, Y., Staudt, A., Jacob, D., Blake, D., Heikes, B., and Snow, J.: Evidence from the Pacific troposphere for large global sources of oxygenated organic compounds, Nature, 410, 1078, doi:10.1038/35074067, 2001. 5396, 5398
Steck, T., and von Clarmann, T.: Constrained Profile Retrieval Applied to the Observation Mode of the Michelson Interferometer for Passive Atmospheric Sounding, Appl. Opt., 40, 3559–
30
3571, 2001. 5391
AMTD
4, 5389–5424, 2011Global distributions of hydrocarbons from
MIPAS RR measurements
A. Wiegele et al.
Title Page
Abstract Introduction
Conclusions References
Tables Figures
◭ ◮
◭ ◮
Back Close
Full Screen / Esc
Printer-friendly Version
Interactive Discussion
Discussion
P
a
per
|
Dis
cussion
P
a
per
|
Discussion
P
a
per
|
Discussio
n
P
a
per
|
simplifying approximations in radiative transfer modelling, J. Quant. Radiat. Transfer, 72(3), 249–280, 2002. 5391
Tikhonov, A.: On the solution of incorrectly stated problems and method of regularization, Dokl. Akad. Nauk. SSSR, 151, 501–504, 1963. 5391
von Clarmann, T., and Echle, G.:Selection of Optimized Microwindows for Atmospheric
Spec-5
troscopy, Appl. Opt., 37, 7661-7669, 1998. 5391
von Clarmann, T., Glatthor, N., Grabowski, U., H ¨opfner, M., Kellmann, S., Kiefer, M., Linden, A., Mengistu Tsidu, G., Milz, M., Steck, T., Stiller, G. P., Wang, D. Y., Fischer, H., Funke, B., Gil-L ´opez, S., and L ´opez-Puertas, M.: Retrieval of temperature and tangent altitude pointing from limb emission spectra recorded from space by the Michelson Interferometer for Passive
10
Atmospheric Sounding (MIPAS), J. Geophys. Res., 108, 4736, doi:10.1029/2003JD003602, 2003. 5391
von Clarmann, T., Glatthor, N., M.E., Koukouli, M.E., Stiller, G., Funke, B., Grabowski, U., H ¨opfner, M., Kellmann, S., Linden, A., Milz, M., Steck, T., and Fischer, H.: MIPAS measure-ments of upper tropospheric C2H6and O3during the southern hemispheric biomass burning
15
season in 2003, Atmos. Chem. Phys., 7, 5861–5872, doi:10.5194/acp-7-5861-2007, 2007. 5392, 5397
von Clarmann, T., De Clercq, C., Ridolfi, M., H ¨opfner, M., and Lambert, J.-C.: The horizontal resolution of MIPAS, Atmos. Meas. Tech., 2, 47–54, doi:10.5194/amt-2-47-2009, 2009 5393, 5408
20
von Clarmann, T., H ¨opfner, M., Kellmann, S., Linden, A., Chauhan, S., Funke, B., Grabowski, U., Glatthor, N., Kiefer, M., Schieferdecker, T., Stiller, G. P., and Versick, S.: Retrieval of tem-perature, H2O, O3, HNO3, CH4, N2O, ClONO2and ClO from MIPAS reduced resolution nom-inal mode limb emission measurements, Atmos. Meas. Tech., 2, 159–175, doi:10.5194/amt-2-159-2009, 2009. 5390, 5392
25
AMTD
4, 5389–5424, 2011Global distributions of hydrocarbons from
MIPAS RR measurements
A. Wiegele et al.
Title Page
Abstract Introduction
Conclusions References
Tables Figures
◭ ◮
◭ ◮
Back Close
Full Screen / Esc
Printer-friendly Version
Interactive Discussion
Discussion
P
a
per
|
Dis
cussion
P
a
per
|
Discussion
P
a
per
|
Discussio
n
P
a
per
|
Table 1.Prefitted (P) and jointly fitted (J) parameters. Spectral shift, temperature, line-of-sight and HNO3are prefits at all retrievals.
species C2H6 HCN PAN C2H2
H2O P P J P
O3 P J J J
CH4 P P
N2O P P
ClONO2 P P J P
ClO P P P
N2O5 P P
HNO4 P P
CFC−11 P P
CFC−12 P
NO2 P
C2H6 P P
PAN P
HCN P
CFC−22 J
C2H2 J
CH3CCl3 J
AMTD
4, 5389–5424, 2011Global distributions of hydrocarbons from
MIPAS RR measurements
A. Wiegele et al.
Title Page
Abstract Introduction
Conclusions References
Tables Figures
◭ ◮
◭ ◮
Back Close
Full Screen / Esc
Printer-friendly Version
Interactive Discussion
Discussion
P
a
per
|
Dis
cussion
P
a
per
|
Discussion
P
a
per
|
Discussio
n
P
a
per
|
Table 2. Microwindows and upper altitude limits (in brackets) for MIPAS reduced resolution nominal mode retrievals (cm−1).
C2H6∗(52 km) HCN∗(68 km) C
2H2∗(35 km) 811.5000–811.8750 715.5000–718.0000 730.7500–731.3125 814.1875–814.5000 732.4375–735.8125 738.4375–738.7500 816.8750–817.1250 737.5000–741.6250 743.1250–743.5625 819.3750–819.8125 744.3125–747.8125 750.1875–750.4375 822.1875–822.5000 750.1875–753.8750 755.1250–759.8750 824.5000–825.1250 756.0000–760.7500 762.0000–767.0625 827.3750–827.7500 767.8125–770.9375 767.1250–772.1250 829.9375–830.4375 773.6250–776.8125 773.5625–778.5000 831.4375–831.7500 779.3750–782.7500 782.8750–787.8125
832.6250–833.1250 789.8750–790.1250
833.9375–834.2500 799.1250–799.4375
835.5000–835.7500 1309.3750–1311.7500
1316.1875–1316.3750 PAN (33 km)
775.000–787.0000 794.500–800.0000
AMTD
4, 5389–5424, 2011Global distributions of hydrocarbons from
MIPAS RR measurements
A. Wiegele et al.
Title Page
Abstract Introduction
Conclusions References
Tables Figures
◭ ◮
◭ ◮
Back Close
Full Screen / Esc
Printer-friendly Version
Interactive Discussion
Discussion
P
a
per
|
Dis
cussion
P
a
per
|
Discussion
P
a
per
|
Discussio
n
P
a
per
|
Table 3. Total errors of the retrievals in pptv and percent and the five most contributing error sources (pptv); LOS=Line Of Sight; ILS=Instrumental Line Shape. The errors are calculated for a single biomass burning plume location with enhanced mixing ratios of all gases.
C2H6 8 km 10 km 12 km 15 km 20 km
total 160 140 82 170 140
total (%) 11.2 10.6 8.9 82.6 >>100
noise 150 130 71 70 61
LOS 51 48 33 0.8 0.2
PAN 35 32 13 6 1.2
gain 6.9 6.1 0.2 13 24
O3 5.7 4.8 18 150 130
C2H2 8 km 10 km 12 km 15 km 20 km
total 30 27 20 9.5 9.5
total (%) 7.1 6.8 6.8 54.1 >100
noise 23 20 8.5 8.9 6.6
LOS 18 18 18 1.8 2.1
PAN 4.8 4.2 4.2 0.7 0.1
ILS 4.4 4.0 2.3 0.7 1.6
AMTD
4, 5389–5424, 2011Global distributions of hydrocarbons from
MIPAS RR measurements
A. Wiegele et al.
Title Page
Abstract Introduction
Conclusions References
Tables Figures
◭ ◮
◭ ◮
Back Close
Full Screen / Esc
Printer-friendly Version
Interactive Discussion
Discussion
P
a
per
|
Dis
cussion
P
a
per
|
Discussion
P
a
per
|
Discussio
n
P
a
per
|
Fig. 3.Continued.
HCN 8 km 12 km 16 km 20 km 30 km 40 km
total 120 96 35 32 54 76
total (%) 13.0 11.9 14.4 17.9 21.7 68.2
noise 43 36 23 25 32 42
LOS 100 83 14 5.5 3.6 7.9
gain 23 16 0.8 7.0 7.8 3.2
T 21 16 0.6 1 5.4 4.9
ILS 13 12 11 7.3 10 7.5
PAN 8 km 10 km 12 km 15 km 20 km
total 45 31 27 19 18
total(%) 6.9 5.2 5.7 >100 >>100
noise 36 30 16 17 15
LOS 24 5.6 21 7.4 5.1
gain 6.3 1.8 2.7 1.6 4.5
ILS 5.4 2.8 1.9 0.8 0.2
AMTD
4, 5389–5424, 2011Global distributions of hydrocarbons from
MIPAS RR measurements
A. Wiegele et al.
Title Page
Abstract Introduction
Conclusions References
Tables Figures
◭ ◮
◭ ◮
Back Close
Full Screen / Esc
Printer-friendly Version
Interactive Discussion
Discussion
P
a
per
|
Dis
cussion
P
a
per
|
Discussion
P
a
per
|
Discussio
n
P
a
per
|
Fig. 4. Horizontal averaging kernels (full width at half maximum) calculated according to von Clarmann et al. (2009a).
altitude 7 km 12 km 20 km 34 km 50 km C2H6 416 km 403 km 480 km 485 km – C2H2 229 km 229 km 229 km 229 km – HCN 438 km 417 km 487 km 497 km 494 km
AMTD
4, 5389–5424, 2011Global distributions of hydrocarbons from
MIPAS RR measurements
A. Wiegele et al.
Title Page
Abstract Introduction
Conclusions References
Tables Figures
◭ ◮
◭ ◮
Back Close
Full Screen / Esc
Printer-friendly Version
Interactive Discussion
Discussion
P
a
per
|
Dis
cussion
P
a
per
|
Discussion
P
a
per
|
Discussio
n
P
a
per
|
-0.2 0.0 0.2 0.4 0.6
Averaging kernel 0
10 20 30 40
Altitude [km]
5 km 10 km
15 km
20 km 25 km
30 km
AMTD
4, 5389–5424, 2011Global distributions of hydrocarbons from
MIPAS RR measurements
A. Wiegele et al.
Title Page
Abstract Introduction
Conclusions References
Tables Figures
◭ ◮
◭ ◮
Back Close
Full Screen / Esc
Printer-friendly Version
Interactive Discussion
Discussion
P
a
per
|
Dis
cussion
P
a
per
|
Discussion
P
a
per
|
Discussio
n
P
a
per
|
C2H6
815 820 825 830 835
Wavenumber [cm-1] 0
500 1000 1500 2000
Radiance
measured simulated
815 820 825 830 835
Wavenumber [cm-1]
-50 0 50 100 150
Radiance
residual contribution
AMTD
4, 5389–5424, 2011Global distributions of hydrocarbons from
MIPAS RR measurements
A. Wiegele et al.
Title Page
Abstract Introduction
Conclusions References
Tables Figures
◭ ◮
◭ ◮
Back Close
Full Screen / Esc
Printer-friendly Version
Interactive Discussion
Discussion
P
a
per
|
Dis
cussion
P
a
per
|
Discussion
P
a
per
|
Discussio
n
P
a
per
|
-0.2 0.0 0.2 0.4 0.6
Averaging kernel 0
10 20 30 40
Altitude [km]
5 km 10 km
15 km
20 km 25 km
30 km
AMTD
4, 5389–5424, 2011Global distributions of hydrocarbons from
MIPAS RR measurements
A. Wiegele et al.
Title Page
Abstract Introduction
Conclusions References
Tables Figures
◭ ◮
◭ ◮
Back Close
Full Screen / Esc
Printer-friendly Version
Interactive Discussion
Discussion
P
a
per
|
Dis
cussion
P
a
per
|
Discussion
P
a
per
|
Discussio
n
P
a
per
|
C2H2
730 740 750 760 770 780 790
Wavenumber [cm-1]
0 1000 2000 3000 4000
Radiance
measured simulated
730 740 750 760 770 780 790
Wavenumber [cm-1] -100
0 100 200 300 400 500
Radiance
residual
contribution
AMTD
4, 5389–5424, 2011Global distributions of hydrocarbons from
MIPAS RR measurements
A. Wiegele et al.
Title Page
Abstract Introduction
Conclusions References
Tables Figures
◭ ◮
◭ ◮
Back Close
Full Screen / Esc
Printer-friendly Version
Interactive Discussion
Discussion
P
a
per
|
Dis
cussion
P
a
per
|
Discussion
P
a
per
|
Discussio
n
P
a
per
|
-0.2 0.0 0.2 0.4 0.6
Averaging kernel 0
10 20 30 40 50 60
Altitude [km]
5 km 10 km
15 km
20 km 30 km
40 km
AMTD
4, 5389–5424, 2011Global distributions of hydrocarbons from
MIPAS RR measurements
A. Wiegele et al.
Title Page
Abstract Introduction
Conclusions References
Tables Figures
◭ ◮
◭ ◮
Back Close
Full Screen / Esc
Printer-friendly Version
Interactive Discussion
Discussion
P
a
per
|
Dis
cussion
P
a
per
|
Discussion
P
a
per
|
Discussio
n
P
a
per
|
HCN
740 750 760 770
Wavenumber [cm-1] 0
1000 2000 3000 4000
Radiance
measured simulated
740 750 760 770
Wavenumber [cm-1] -50
0 50 100 150
Radiance
residual
contribution
AMTD
4, 5389–5424, 2011Global distributions of hydrocarbons from
MIPAS RR measurements
A. Wiegele et al.
Title Page
Abstract Introduction
Conclusions References
Tables Figures
◭ ◮
◭ ◮
Back Close
Full Screen / Esc
Printer-friendly Version
Interactive Discussion
Discussion
P
a
per
|
Dis
cussion
P
a
per
|
Discussion
P
a
per
|
Discussio
n
P
a
per
|
-0.2 0.0 0.2 0.4 0.6
Averaging kernel 0
10 20 30 40
Altitude [km]
5 km 10 km
15 km
20 km 25 km
30 km
AMTD
4, 5389–5424, 2011Global distributions of hydrocarbons from
MIPAS RR measurements
A. Wiegele et al.
Title Page
Abstract Introduction
Conclusions References
Tables Figures
◭ ◮
◭ ◮
Back Close
Full Screen / Esc
Printer-friendly Version
Interactive Discussion
Discussion
P
a
per
|
Dis
cussion
P
a
per
|
Discussion
P
a
per
|
Discussio
n
P
a
per
|
PAN
775 780 785 790 795 800
Wavenumber [cm-1] 0
500 1000 1500 2000 2500 3000
Radiance
measured simulated
775 780 785 790 795 800
Wavenumber [cm-1]
0 100 200 300
Radiance
residual
contribution
AMTD
4, 5389–5424, 2011Global distributions of hydrocarbons from
MIPAS RR measurements
A. Wiegele et al.
Title Page
Abstract Introduction
Conclusions References
Tables Figures
◭ ◮
◭ ◮
Back Close
Full Screen / Esc
Printer-friendly Version
Interactive Discussion
Discussion
P
a
per
|
Dis
cussion
P
a
per
|
Discussion
P
a
per
|
Discussio
n
P
a
per
|
pptv
-200
0 200 400 600 800 1000 1200
C2H6, 29334, 20071010, 0833 - 1012 UT
10 15 20 25
Altitude [km]
0 45 90 45 0 -45 -90 -45 0
Latitude [deg]
AMTD
4, 5389–5424, 2011Global distributions of hydrocarbons from
MIPAS RR measurements
A. Wiegele et al.
Title Page
Abstract Introduction
Conclusions References
Tables Figures
◭ ◮
◭ ◮
Back Close
Full Screen / Esc
Printer-friendly Version
Interactive Discussion
Discussion
P
a
per
|
Dis
cussion
P
a
per
|
Discussion
P
a
per
|
Discussio
n
P
a
per
|
pptv
-100
0 100 200 300 400
C2H2, 29334, 20071010, 0832 - 1012 UT
10 15 20 25
Altitude [km]
0 45 90 45 0 -45 -90 -45 0
Latitude [deg]
AMTD
4, 5389–5424, 2011Global distributions of hydrocarbons from
MIPAS RR measurements
A. Wiegele et al.
Title Page
Abstract Introduction
Conclusions References
Tables Figures
◭ ◮
◭ ◮
Back Close
Full Screen / Esc
Printer-friendly Version
Interactive Discussion
Discussion
P
a
per
|
Dis
cussion
P
a
per
|
Discussion
P
a
per
|
Discussio
n
P
a
per
|
AMTD
4, 5389–5424, 2011Global distributions of hydrocarbons from
MIPAS RR measurements
A. Wiegele et al.
Title Page
Abstract Introduction
Conclusions References
Tables Figures
◭ ◮
◭ ◮
Back Close
Full Screen / Esc
Printer-friendly Version
Interactive Discussion
Discussion
P
a
per
|
Dis
cussion
P
a
per
|
Discussion
P
a
per
|
Discussio
n
P
a
per
|
pptv
0 200 400 600 800 1000
HCN, 29334, 20071010, 0832 - 1012 UT
10 20 30 40
Altitude [km]
0 45 90 45 0 -45 -90 -45 0
Latitude [deg]
AMTD
4, 5389–5424, 2011Global distributions of hydrocarbons from
MIPAS RR measurements
A. Wiegele et al.
Title Page
Abstract Introduction
Conclusions References
Tables Figures
◭ ◮
◭ ◮
Back Close
Full Screen / Esc
Printer-friendly Version
Interactive Discussion
Discussion
P
a
per
|
Dis
cussion
P
a
per
|
Discussion
P
a
per
|
Discussio
n
P
a
per
|
AMTD
4, 5389–5424, 2011Global distributions of hydrocarbons from
MIPAS RR measurements
A. Wiegele et al.
Title Page
Abstract Introduction
Conclusions References
Tables Figures
◭ ◮
◭ ◮
Back Close
Full Screen / Esc
Printer-friendly Version
Interactive Discussion
Discussion
P
a
per
|
Dis
cussion
P
a
per
|
Discussion
P
a
per
|
Discussio
n
P
a
per
|
pptv
0 100 200 300 400 500
PAN, 29334, 20071010, 0832 - 1012 UT
10 15 20 25
Altitude [km]
0 45 90 45 0 -45 -90 -45 0
Latitude [deg]
AMTD
4, 5389–5424, 2011Global distributions of hydrocarbons from
MIPAS RR measurements
A. Wiegele et al.
Title Page
Abstract Introduction
Conclusions References
Tables Figures
◭ ◮
◭ ◮
Back Close
Full Screen / Esc
Printer-friendly Version
Interactive Discussion
Discussion
P
a
per
|
Dis
cussion
P
a
per
|
Discussion
P
a
per
|
Discussio
n
P
a
per
|