BGD
10, 5385–5497, 2013Biosphere-atmosphere ammonia
exchange
C. R. Flechard et al.
Title Page
Abstract Introduction
Conclusions References
Tables Figures
◭ ◮
◭ ◮
Back Close
Full Screen / Esc
Printer-friendly Version Interactive Discussion
Discussion
P
a
per
|
Dis
cussion
P
a
per
|
Discussion
P
a
per
|
Discussio
n
P
a
per
|
Biogeosciences Discuss., 10, 5385–5497, 2013 www.biogeosciences-discuss.net/10/5385/2013/ doi:10.5194/bgd-10-5385-2013
© Author(s) 2013. CC Attribution 3.0 License.
Open Access
Biogeosciences
Discussions
Geoscientiic Geoscientiic
Geoscientiic Geoscientiic
This discussion paper is/has been under review for the journal Biogeosciences (BG). Please refer to the corresponding final paper in BG if available.
Advances in understanding, models and
parameterisations of
biosphere-atmosphere ammonia
exchange
C. R. Flechard1, R.-S. Massad2, B. Loubet2, E. Personne3, D. Simpson4,5, J. O. Bash6, E. J. Cooter6, E. Nemitz7, and M. A. Sutton7
1
INRA, UMR1069 Sol Agro-hydrosyst `eme Spatialisation, 35042 Rennes, France 2
INRA, UMR1091 INRA-AgroParisTech Environnement et Grandes Cultures, 78850 Thiverval-Grignon, France
3
AgroParisTech, UMR 1091 INRA-AgroParisTech Environnement et Grandes Cultures, 78850 Thiverval-Grignon, France
4
EMEP MSC-W, Norwegian Meteorological Institute, Norway 5
Department Earth & Space Sciences, Chalmers University of Technology, Gothenburg, Sweden
6
National Exposure Research Laboratory, Office of Research and Development, US Environmental Protection Agency, Research Triangle Park, NC 27711, USA
7
BGD
10, 5385–5497, 2013Biosphere-atmosphere ammonia
exchange
C. R. Flechard et al.
Title Page
Abstract Introduction
Conclusions References
Tables Figures
◭ ◮
◭ ◮
Back Close
Full Screen / Esc
Printer-friendly Version Interactive Discussion
Discussion
P
a
per
|
Dis
cussion
P
a
per
|
Discussion
P
a
per
|
Discussio
n
P
a
per
|
Received: 1 March 2013 – Accepted: 12 March 2013 – Published: 21 March 2013
Correspondence to: C. R. Flechard ([email protected])
BGD
10, 5385–5497, 2013Biosphere-atmosphere ammonia
exchange
C. R. Flechard et al.
Title Page
Abstract Introduction
Conclusions References
Tables Figures
◭ ◮
◭ ◮
Back Close
Full Screen / Esc
Printer-friendly Version Interactive Discussion
Discussion
P
a
per
|
Dis
cussion
P
a
per
|
Discussion
P
a
per
|
Discussio
n
P
a
per
|
Abstract
Atmospheric ammonia (NH3) dominates global emissions of total reactive nitrogen (Nr), while emissions from agricultural production systems contribute about two thirds of global NH3 emissions; the remaining third emanates from oceans, natural vege-tation, humans, wild animals and biomass burning. On land, NH3 emitted from the
5
various sources eventually returns to the biosphere by dry deposition to sink areas, predominantly semi-natural vegetation, and by wet and dry deposition as ammonium (NH+4) to all surfaces. However, the land/atmosphere exchange of gaseous NH3 is in fact bi-directional over unfertilized as well as fertilized ecosystems, with periods and areas of emission and deposition alternating in time (diurnal, seasonal) and space
10
(patchwork landscapes). The exchange is controlled by a range of environmental fac-tors, including meteorology, surface layer turbulence, thermodynamics, air and surface heterogeneous-phase chemistry, canopy geometry, plant development stage, leaf age, organic matter decomposition, soil microbial turnover, and, in agricultural systems, by fertilizer application rate, fertilizer type, soil type, crop type, and agricultural
manage-15
ment practices. We review the range of processes controlling NH3emission and uptake in the different parts of the soil-canopy-atmosphere continuum, with NH3emission po-tentials defined at the substrate and leaf levels by different [NH+4] / [H+] ratios (Γ).
Surface/atmosphere exchange models for NH3are necessary to compute the tempo-ral and spatial patterns of emissions and deposition at the soil, plant, field, landscape,
20
regional and global scales, in order to assess the multiple environmental impacts of air-borne and deposited NH3and NH+4. Models of soil/vegetation/atmosphere NH3 ex-change are reviewed from the substrate and leaf scales to the global scale. They range from simple steady-state, “big leaf” canopy resistance models, to dynamic, multi-layer, multi-process, multi-chemical species schemes. Their level of complexity depends on
25
BGD
10, 5385–5497, 2013Biosphere-atmosphere ammonia
exchange
C. R. Flechard et al.
Title Page
Abstract Introduction
Conclusions References
Tables Figures
◭ ◮
◭ ◮
Back Close
Full Screen / Esc
Printer-friendly Version Interactive Discussion
Discussion
P
a
per
|
Dis
cussion
P
a
per
|
Discussion
P
a
per
|
Discussio
n
P
a
per
|
coupled, interactive chemical transport models (CTM) and soil/ecosystem modelling at the regional scale. However, it remains a matter for debate to what extent realistic options for future regional and global models should be based on process-based mech-anistic versus empirical and regression-type models. Further discussion is needed on the extent and timescale by which new approaches can be used, such as integration
5
with ecosystem models and satellite observations.
1 Introduction
1.1 Ammonia in the environment
Ammonia (NH3) emission from the biosphere to the atmosphere is one of the many unintended consequences of reactive nitrogen (Nr) creation from inert dinitrogen gas
10
(N2) through symbiotic biological nitrogen fixation (BNF) and the Haber-Bosch process, and of the agricultural usage of the fixed Nrfor crop and meat production (Sutton et al., 2011). Conversely, NH3emission is also one of the main precursors of the nitrogen cas-cade (Galloway et al., 2003), whereby the N atom of the NH3molecule may potentially participate in a number of environmental impacts through a series of pathways and
15
chemical and (micro-) biological transformations in the biosphere. As airborne NH3is transported downwind from sources, chemically processed in the atmosphere, and dry-and wet-deposited to the Earth’s surface, it may be converted in air, vegetation, soils and water successively to NH+4, NO−3, NO, N2O, many organic N forms, threatening in term air quality, water quality, soil quality, the greenhouse gas balance, ecosystems
20
and biodiversity – 5 key threats identified by Sutton et al. (2011).
Quantitatively, NH3is currently believed to account for approximately half of all global biospheric, anthropogenic and natural atmospheric Nr emissions, with Nr defined and inventoried as the sum of NH3-N and oxidized nitrogen NOx-N. Global estimates of NH3 and NOx emissions provided by the Emissions Database for Global Atmospheric
Re-25
BGD
10, 5385–5497, 2013Biosphere-atmosphere ammonia
exchange
C. R. Flechard et al.
Title Page
Abstract Introduction
Conclusions References
Tables Figures
◭ ◮
◭ ◮
Back Close
Full Screen / Esc
Printer-friendly Version Interactive Discussion
Discussion
P
a
per
|
Dis
cussion
P
a
per
|
Discussion
P
a
per
|
Discussio
n
P
a
per
|
Agricultural NH3 emissions dominate and are of the order of 27–38 Tg NH3-N yr−1 (Beusen et al., 2008). Uncertainties in global NH3 emissions are large, possibly up to 30–40 %, as shown by the variability in other published global figures (e.g. calcu-lated estimates of 75 (50–128), by Schlesinger and Hartley, 1992; 45 Tg NH3-N yr−1 by Dentener and Crutzen, 1994; 54 Tg NH3-N yr−1 by Bouwman et al., 1997; 43 Tg
5
NH3-N yr−1 by van Aardenne et al., 2001). By comparison, the global biological and industrial N2 fixation is of the order of 140 Tg N yr−1 (Galloway et al., 2003), of which NH3emissions represent a loss of approximately one third. The environmental impacts of NH3are expected to become more pronounced in many regions of the world where increases in NH3emissions are expected to occur during the 21st century, as a result
10
of agricultural intensification and the manifold effects of climatic change on N cycling. Within the European Union (EU-27), total NH3 and NOx emission estimates are also of the same order, at 3.0 and 2.8 Tg N yr−1, respectively (European Environment Agency, 2012; Sutton et al., 2011), contributing around 7.5 % of global emissions. Al-though EU-27 NH3 emissions declined by 28 % from 1990 to 2010, the share of NH3
15
in total European Nr emissions increased from 44 % to reach the current level of 51 %, because NOxemissions almost halved (−47 %) over the same 20 yr period (European Environment Agency, 2012), due to very significant NOx emission abatements in the transport, industry and energy sectors. A range of NH3emission projections in Europe tend to indicate either a small increase, or possibly a slow linear decline of the order of
20
∼25 % by the year 2100, while NOx emissions are projected to decline exponentially by∼75 % over the same time horizon (Winiwarter et al., 2011).
As oxidised Nr eventually takes a backseat to reduced Nr emissions in Europe and N. America, the degree to which NH3 will control atmospheric chemistry and N de-position to sensitive ecosystems is set to increase over the next few decades. In
ad-25
BGD
10, 5385–5497, 2013Biosphere-atmosphere ammonia
exchange
C. R. Flechard et al.
Title Page
Abstract Introduction
Conclusions References
Tables Figures
◭ ◮
◭ ◮
Back Close
Full Screen / Esc
Printer-friendly Version Interactive Discussion
Discussion
P
a
per
|
Dis
cussion
P
a
per
|
Discussion
P
a
per
|
Discussio
n
P
a
per
|
combustion processes. With global temperatures expected to rise by a few K, and based on thermodynamic considerations (a volatilisation Q10 of 3–4), agricultural NH3 emissions could increase substantially over the 21st century, although water availability is also a critical factor, favouring mineralisation of organic N sources while suppressing NH3emissions by allowing dilution and infiltration (Sutton et al., 2012). The net impact
5
of rising temperatures and altered spatial/seasonal precipitation patterns on regional and global NH3 budgets is as yet uncertain, with the uncertainty being compounded by land-use and land-cover changes and evolving agricultural practices (e.g. fertiliza-tion rates, spreading techniques, grazing density). Such an assessment will require the development of fully mechanistic, climate-dependent models for the quantification of
10
surface/atmosphere NH3 exchange under global environmental change (Sutton et al., 2012).
1.2 Requirements for different ammonia exchange models
Predicting global-change-induced alterations of NH3 emissions and dry deposition is just one out of a range of environmental issues and ecological applications requiring
15
biosphere/atmosphere NH3 exchange modelling, along with, e.g. local N deposition impacts assessments (Hertel et al., 2011; Theobald et al., 2004, 2009; Sutton et al., 1998b; Loubet et al., 2009a), air quality studies (Pinder et al., 2007; Wu et al., 2008), and transboundary air pollution flux estimation (Simpson et al., 2012; Berge et al., 1999). Models of surface/atmosphere NH3 exchange have been both developed and
20
applied for a number of purposes and at a large range of spatial scales ranging from the leaf or plant (Massad et al., 2010a), the canopy or ecosystem (Sutton et al., 1998a; Nemitz et al., 2001a; Riedo et al., 2002; Personne et al., 2009), the landscape (Loubet et al., 2009a; Hertel et al., 2006), to the national/regional level (van Pul et al., 2009; Bash et al., 2012) and to the globe (Dentener and Crutzen, 1994).
25
BGD
10, 5385–5497, 2013Biosphere-atmosphere ammonia
exchange
C. R. Flechard et al.
Title Page
Abstract Introduction
Conclusions References
Tables Figures
◭ ◮
◭ ◮
Back Close
Full Screen / Esc
Printer-friendly Version Interactive Discussion
Discussion
P
a
per
|
Dis
cussion
P
a
per
|
Discussion
P
a
per
|
Discussio
n
P
a
per
|
understanding (e.g. Sutton et al., 1995b; Flechard et al., 1999; Nemitz et al., 2000b; Spindler et al., 2001; Neirynck and Ceulemans, 2008; Burkhardt et al., 2009), as the unexplained variability (residuals) points to potential model weaknesses and areas for further improvements. Models may also be used to fill gaps in measured flux time series in order to provide seasonal or annual NH3 exchange budgets (Flechard et al., 2010).
5
In the absence of measured fluxes, but based on local meteorology and measured am-bient concentrations at given sites, inferential modelling provides NH3 flux estimates for individual ecosystems (Smith et al., 2000; Zimmermann et al., 2006; Walker et al., 2008; Zhang et al., 2009; Flechard et al., 2011). At larger (landscape, regional, global) scales, surface/atmosphere schemes are parameterized for different land uses and
10
embedded within modelling contexts that encompass the whole cycle (from an Earth– Atmosphere–Earth perspective) of emission, dispersion, transport, chemistry and de-position (van Pul et al., 2009; Asman et al., 1998).
The process understanding gained over the years from controlled environment studies and field-scale measurements is eventually formalized into soil–vegetation–
15
atmosphere transfer (SVAT) models, which then feed – in simplified, generalized forms – into landscape-scale models (LSMs), regional or global chemistry and transport mod-els (CTMs), and dynamic global vegetation modmod-els (DGVMs).
1.3 Ammonia measurement and modelling approaches
The development, parameterisation and validation of models over the years has been,
20
to a large extent, underpinned by the ever-increasing availability of NH3concentration and/or flux datasets across all scales.
At sub-landscape scales (cuvette, chamber, plot, field), this has stemmed from tech-nological advances in NH3 flux measurement instrumentation, capable of adequate lower detection limits, continuous on-line analysis for extended periods of time,
se-25
BGD
10, 5385–5497, 2013Biosphere-atmosphere ammonia
exchange
C. R. Flechard et al.
Title Page
Abstract Introduction
Conclusions References
Tables Figures
◭ ◮
◭ ◮
Back Close
Full Screen / Esc
Printer-friendly Version Interactive Discussion
Discussion
P
a
per
|
Dis
cussion
P
a
per
|
Discussion
P
a
per
|
Discussio
n
P
a
per
|
Erisman et al., 2001; Thomas et al., 2009) have helped produce many exchange flux datasets by aerodynamic gradient methods (AGM) or Bowen ratio techniques, both at remote background locations with low (sub-ppb) concentration levels (Flechard and Fowler, 1998b; Milford et al., 2001a), and over polluted semi-natural ecosystems and fertilized agricultural systems (Wyers and Erisman, 1998; Nemitz et al., 2000a,b;
5
Neirynck and Ceulemans, 2008; Sutton et al., 2009b; Flechard et al., 2010; Wolffet al., 2010a; Loubet et al., 2012; Walker et al., 2013). Relaxed eddy accumulation systems have allowed NH3flux measurements at one single height (Nemitz et al., 2001b; Mey-ers et al., 2006; Hensen et al., 2009a). In parallel, a range of new generation, fast-response optical and mass spectrometry instruments have emerged over the last 15 yr
10
(see von Bobrutzki et al., 2009, for a review and intercomparison), which have proved suitable for eddy covariance (EC) measurements of large (emission) fluxes such as those occurring after the land spreading of manures (Whitehead et al., 2008; Sinter-mann et al., 2011). However, many of these instruments have yet to realize their full potential for the smaller exchange fluxes typical of unfertilized background situations
15
(Famulari et al., 2004), not least due to aerosol NH+4 interference and to high-frequency damping losses of NH3 fluctuations from adsorption/desorption within the measure-ment system, especially air inlet lines and online filters (Ellis et al., 2010; Whitehead et al., 2008).
At landscape/regional/global scales, it is much harder to make flux measurements,
20
and modelled surface/atmosphere exchange cannot easily be directly validated. At the landscape scale, limited use has been made of plume measurements and inverse mod-elling of strong sources (Hensen et al., 2009b; Flesch et al., 2007; Blackall et al., 2007; Loubet et al., 2009b; Carozzi et al., 2013). However, model evaluation, especially at the regional scale, typically relies on the indirect indicators provided by measured wet
25
BGD
10, 5385–5497, 2013Biosphere-atmosphere ammonia
exchange
C. R. Flechard et al.
Title Page
Abstract Introduction
Conclusions References
Tables Figures
◭ ◮
◭ ◮
Back Close
Full Screen / Esc
Printer-friendly Version Interactive Discussion
Discussion
P
a
per
|
Dis
cussion
P
a
per
|
Discussion
P
a
per
|
Discussio
n
P
a
per
|
infrared spectroscopy to map NH3 concentrations (Clarisse et al., 2009; Shephard et al., 2011; R’Honi et al., 2012) suggest that the monitoring of NH3 from space will help validate large-scale atmospheric models and refine current modelled estimates of regional and global NH3emissions.
Advances in instrumentation, flux measurements and process understanding since
5
the early 1980s have allowed the atmospheric pollution modelling community to move from a unidirectional paradigm for NH3(fixed discrete point sources versus diffuse dry deposition everywhere else), to a dynamic bi-directional view, in which sources and sinks alternate in space and time depending on weather, pollution climate and agricul-tural management (Sutton et al., 2012). The major mechanisms and controls of NH3
10
exchange have been identified at the substrate, plant, and ecosystem scales, even if there remain substantial gaps in knowledge, but the methodologies and models cur-rently used to estimate emissions and deposition at landscape and regional scales have not all reached comparable levels of complexity. This is only partly due to compu-tational limits (CPU time), as the very detailed processes operating at very short time
15
scales might become prohibitive when run over regional and multi-annual scales. More likely, however, it is often a consequence of the lack of fine resolution, detailed input data required to run the schemes, compounded by the difficulty of turning largely het-erogeneous measurement (flux) datasets into a generalised, unified and self-consistent modelling theory.
20
1.4 Scope of the review
The state of the art of NH3 surface/atmosphere exchange (measurement and mod-elling) has been examined in a number of reviews, e.g. Sutton et al. (1993c, 1995b), Asman et al. (1998), Nemitz et al. (2001a), Hertel et al. (2006, 2012), Loubet et al. (2009a), van Pul et al. (2009), Sutton et al. (2007), Fowler et al. (2009), Wu
25
BGD
10, 5385–5497, 2013Biosphere-atmosphere ammonia
exchange
C. R. Flechard et al.
Title Page
Abstract Introduction
Conclusions References
Tables Figures
◭ ◮
◭ ◮
Back Close
Full Screen / Esc
Printer-friendly Version Interactive Discussion
Discussion
P
a
per
|
Dis
cussion
P
a
per
|
Discussion
P
a
per
|
Discussio
n
P
a
per
|
including the application of fertilizers, manures and slurry to farmland. Note that al-though NH3emissions from farmstead livestock housing and manure storage facilities represent around 20 % (and biomass burning an additional 15 %) of total emissions globally (EDGAR, 2011), these will not be considered specifically. Similarly, sea/air ex-change is not treated here, even though marine NH3emissions can be substantial, e.g.
5
30 Gg NH3-N yr−1over the EMEP grid area (Barrett, 1998).
The present paper focuses on bi-directional NH3exchange over vegetation and soils in both (semi)-natural vegetation and agricultural systems, as well as uni-directional ex-change (emission) fluxes from land-applied mineral N fertilizers and manures. A brief overview is first given of the meteorological, thermodynamic, chemical and biological
10
processes controlling NH3emission and uptake at the substrate, plant and ecosystem levels. Existing models of surface exchange are examined at the different scales from the leaf to the globe, with an emphasis on the development of canopy-scale models and their implementation at larger scales (landscape, regional). Although the concep-tualization of a model and its parameterisation (the calibration of its parameters based
15
on observations) are quite different things, in the surface exchange literature the two terms have sometimes been used interchangeably. The ultimate objective of this work is to integrate current knowledge into a common modelling framework adapted for local, regional and global scale models, and to examine the degree to which measurement and input data are available, or missing, in order to parameterise, and ultimately run,
20
surface/atmosphere exchange models at the different scales.
2 Processes controlling NH3emission and uptake in the soil/plant/atmosphere
continuum
2.1 Thermodynamic and chemical controls
At the level of each potential NH3 source or sink in the soil/vegetation system
25
BGD
10, 5385–5497, 2013Biosphere-atmosphere ammonia
exchange
C. R. Flechard et al.
Title Page
Abstract Introduction
Conclusions References
Tables Figures
◭ ◮
◭ ◮
Back Close
Full Screen / Esc
Printer-friendly Version Interactive Discussion
Discussion
P
a
per
|
Dis
cussion
P
a
per
|
Discussion
P
a
per
|
Discussio
n
P
a
per
|
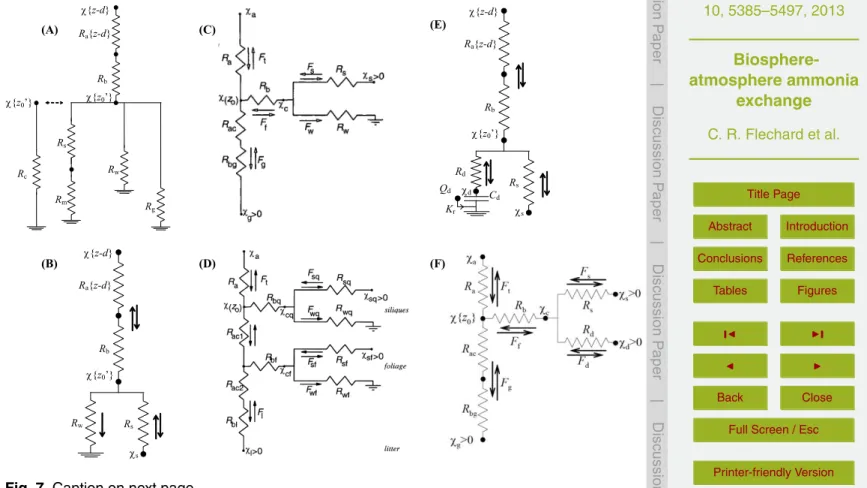
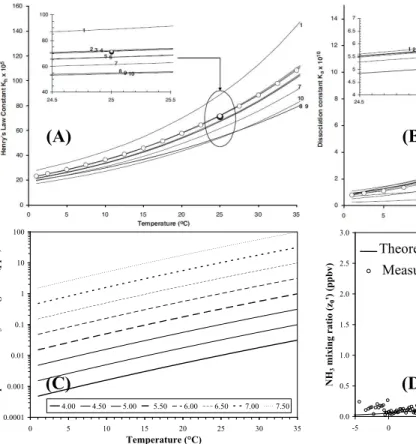
applied manure), the gaseous NH3concentration (NH3,g) in equilibrium with dissolved [NH3,aq] and [NH+4] is governed by Henry’s law (Kh) and the NH3 protonation constant (Ka) (Seinfeld and Pandis, 2006; see Montes et al., 2009, for a review of Ka and Kh
parameterisations, and Fig. 1a, b). In the context of the atmospheric exchange through stomata with the leaf apoplast, this equilibrium concentration has been called the
com-5
pensation point, here denoted χcp; the net gaseous NH3 flux to or from the air sur-rounding the substrate then depends on the concentration difference χcp−χa, where
χais the ambient NH3 concentration (Farquhar et al., 1980). This differential between surface and air concentrations can be applied for many substrates: if the concentra-tion gradient is zero then there is no net exchange flux; ifχcp> χa then NH3 emission
10
from the substrate occurs, while withχcp < χa there is a net uptake by the substrate. By convention, a positive flux denotes NH3 emission, negative indicates deposition or uptake.
2.1.1 Temperature effects and the Γratio ([NH+
4] / [H
+
])
Thermodynamics dictate that any warming of the substrate, at constant substrate pH,
15
theoretically results in a displacement of dissolved NH3 to the gas phase, promoting NH3 emission or at least opposing uptake by the substrate from the air. The relation-ship ofχcpto temperature is exponential (Seinfeld and Pandis, 2006), with a warming of 4–5 K roughly translating into a doubling of the compensation point (Fig. 1c) for a given [NH+4] / [H+] ratio in the liquid phase (Flechard and Fowler, 2008). The [NH+4] / [H+] ratio
20
is henceforth termedΓ and characterises the NH3 emission potential, normalised for temperature. Measured values of Γ have been shown to be vastly variable (up to 5 orders of magnitude difference) between various parts of plant canopies, e.g. leaf sur-face water, soil, litter, bulk leaf tissue and the apoplast, e.g. in grassland (Sutton et al., 2009b; Burkhardt et al., 2009) and in maize (Walker et al., 2013), but the differentχcp
25
BGD
10, 5385–5497, 2013Biosphere-atmosphere ammonia
exchange
C. R. Flechard et al.
Title Page
Abstract Introduction
Conclusions References
Tables Figures
◭ ◮
◭ ◮
Back Close
Full Screen / Esc
Printer-friendly Version Interactive Discussion
Discussion
P
a
per
|
Dis
cussion
P
a
per
|
Discussion
P
a
per
|
Discussio
n
P
a
per
|
In practice, it is clear that ecosystem N and NH+4 pools are ever changing and that Γ values may undergo diurnal, seasonal and annual cycles in response to weather, phenology, senescence, etc, such that the theoretical temperature response with re-spect to NH3 fluxes is not necessarily verified in the long term. Modelling approaches based on the temperature response of aΓemission potential should therefore
theoret-5
ically also deal with temporalΓdynamics in the various parts of an ecosystem.
In the atmosphere, the reversible equilibrium of the gas/aerosol
NH3/ HNO3/ NH4NO3 triad is also temperature (and relative humidity, RH) sensi-tive (Mozurkewich, 1993), with likewise a displacement of aerosol-phase NH+4 and NO−3 towards gaseous NH3and HNO3in warmer (and drier) conditions. Depending on
10
the relative mixing ratios of NH3, HNO3and NH4NO3, and on temperature and RH in the air column within and just above vegetation, gas/particle inter-conversion may alter the net NH3 flux, as exchange velocities for gas-phase NH3 and aerosol-phase NH+4 are different (Brost et al., 1988; Nemitz et al., 2004; see Sect. 2.5).
2.1.2 Surface/substrate pH and acid/base ratio
15
Substrate pH is also a major chemical control of NH3 fluxes; for a constant [NH+4] in solution the compensation point increases by a factor of 3.2 for every additional 0.5 pH unit, and by 10 for every pH unit (Fig. 1). Thus the wide range of pH values, and their temporal variations, typically encountered in plants and on other environmental sur-faces, clearly show the importance of using accurate values in models of both emission
20
from fertilizers and background bi-directional exchange. Apoplastic pH typically varies in the range 5–7 (Farquhar et al., 1980; Schjoerring et al., 1998; Hill et al., 2002; Mas-sad et al., 2008), and a range of stress factors can induce temporal variations (Felle and Hanstein, 2002). The pH of the apoplast can increase by a few tenths of a unit in drought-stressed plants (Sharp and Davies, 2009), while both NH3and CO2 can also
25
BGD
10, 5385–5497, 2013Biosphere-atmosphere ammonia
exchange
C. R. Flechard et al.
Title Page
Abstract Introduction
Conclusions References
Tables Figures
◭ ◮
◭ ◮
Back Close
Full Screen / Esc
Printer-friendly Version Interactive Discussion
Discussion
P
a
per
|
Dis
cussion
P
a
per
|
Discussion
P
a
per
|
Discussio
n
P
a
per
|
Luzula sylvatica, young leaves were found to have much higher apoplastic pH than old leaves, leading to 4–10-fold higher NH3compensation points (Hill et al., 2002).
On external leaf surfaces, the pH of rain and dew is typically acidic, in the range 3.5– 6 (Burkhardt et al., 2009; Flechard et al., 1999), but alkaline conditions may also occur in plant surface wetness, resulting from the presence of soil particles (Sutton et al.,
5
1993a; Walker et al., 2013). Also, instantaneous or chronic exposure to elevated NH3 levels is likely to raise surface pH and affect the magnitude of the surface exchange flux (Wu et al., 2009).
Jones et al. (2007) showed that the non-stomatal resistance (Rns) of moorland plants to the uptake of atmospheric NH3 increased linearly with ambient NH3 concentration
10
in the range 0–100 µg m−3. This indicates that at high ambient NH3 levels, the non-stomatal dry deposition process is self-limiting as the cuticle and other canopy surfaces may become NH3-saturated and a high pH strongly suppresses the effective NH3 sol-ubility. Such situations occur typically in the vicinity of point sources such as animal production facilities (Loubet et al., 2009a), where ambient concentrations decrease
ex-15
ponentially with distance, from typically>100 µg m−3within the nearest 50 m of animal buildings and manure storage areas down to less than 10 µg m−3 within a kilometer (Walker et al., 2008).
The concurrent dry and wet deposition of acidic atmospheric gases and aerosols contributes to the regulation of plant surface pH, and much depends on the
prevail-20
ing pollution climate, the occurrence and duration of surface wetness, and the relative abundancies of NH3(the major atmospheric base) and of atmospheric acids (Erisman and Wyers, 1993; Flechard et al., 1999). Thus plant surface (cuticle, wetness) pH is the main (if implicit) underlying mechanism that accounts for some parameterisations for non-stomatal resistance to NH3 deposition, developed in a range of publications
25
BGD
10, 5385–5497, 2013Biosphere-atmosphere ammonia
exchange
C. R. Flechard et al.
Title Page
Abstract Introduction
Conclusions References
Tables Figures
◭ ◮
◭ ◮
Back Close
Full Screen / Esc
Printer-friendly Version Interactive Discussion
Discussion
P
a
per
|
Dis
cussion
P
a
per
|
Discussion
P
a
per
|
Discussio
n
P
a
per
|
For field applied manures, the pH of cattle and pig slurries is typically in the range 7.5–8, but values down to 6.3 and up to 9.0 have been reported (Sintermann et al., 2012). This, combined with the natural variability of soil pH across agricultural land-scapes in which manures are applied to land, contributes to the large variability in fluxes and NH3 emission factors (EF) (G ´enermont and Cellier, 1997; Søgaard et al.,
5
2002; Sommer et al., 2003; Sintermann et al., 2012). It should be noted that farmers typically monitor and manage soil pH to insure it is in an optimal range for the crop being produced and models should take this into account when estimating NH3fluxes for agricultural crops.
2.2 Meteorological controls
10
Weather affects ecosystem/atmosphere NH3 exchange directly through the physical effects of wind speed, turbulence, global radiation, atmospheric stability and water (rainfall, dewfall, snowfall, evapotranspiration). The enhancement by wind speed and surface friction of NH3 volatilisation rates after slurry spreading or inorganic fertilizer application is well documented, with the effect being quantified by the aerodynamic
15
resistance (Ra) to heat and trace gas transfer (G ´enermont and Cellier, 1997; Søgaard et al., 2002; Sommer et al., 2003). After slurry spreading, the radiative heating of the surface drives the evaporation of water from deposited manure and possibly the forma-tion of a crust, which adds an addiforma-tional surface resistance (Rc) to the aerodynamic (Ra) and the laminar boundary layer (Rb) resistances to emission (Sommer et al., 2003).
20
Unstable atmospheric conditions favour convective mixing and NH3volatilisation, al-though they tend to co-occur with warm days with strong evaporation and high vapour pressure deficit (VPD), during which a slurry crust may form. Rainfall at the time of spreading tends to suppress NH3 emission by diluting thick slurry and facilitating in-filtration into the soil, where NH+4 ions adsorb to sites of cation exchange; however,
25
BGD
10, 5385–5497, 2013Biosphere-atmosphere ammonia
exchange
C. R. Flechard et al.
Title Page
Abstract Introduction
Conclusions References
Tables Figures
◭ ◮
◭ ◮
Back Close
Full Screen / Esc
Printer-friendly Version Interactive Discussion
Discussion
P
a
per
|
Dis
cussion
P
a
per
|
Discussion
P
a
per
|
Discussio
n
P
a
per
|
amended with mineral fertilizer and up to several weeks following fertilization (Walker et al., 2013), or in natural alkaline soils in arid environments, such as, e.g. the Mojave Desert (McCalley and Sparks, 2008).
The same meteorological drivers similarly impact patterns of background, bi-directional exchange. Large wind speeds and unstable conditions reduceRaand thus
5
tend to increase emissions from the canopy (upward fluxes) as well as dry deposition (downward fluxes). However, large wind speeds also increase NH3 dispersion (Lou-bet et al., 2009a) and thus tend to reduce ambient NH3 concentration levels close to point sources (Flechard and Fowler, 1998a), such that, although the exchange veloc-ity is higher (higher turbulence, lowerRa), the dry deposition flux may not be greater
10
(Flechard and Fowler, 1998b).
2.2.1 Leaf surface wetness
The control by rainfall and dewfall is more straightforward, with leaf-surface water gen-erally acting as a more efficient sink for highly water-soluble NH3than does a dry cuti-cle, and water droplets also physically blocking stomatal apertures (Zhang et al., 2003),
15
all favouring dry deposition and limiting emission by the ecosystem. Water droplets, and also thin water films formed by deliquescent particles on leaf surfaces (Burkhardt and Eiden, 1994), are often acidic and increase the affinity and sink potential of the canopy for atmospheric NH3(Flechard and Fowler, 1998b), as well as for NH3emitted by the underlying soil and leaf litter (Nemitz et al., 2000a). Burkhardt and Eiden (1994)
20
also describe a “wick” effect of microscopic water films, by which the migration of NH+4 ions between the apoplast and the external cuticle, along stomatal guard cell walls, is controlled by pH and NH+4 concentration gradients. Similarly, Sutton et al. (1995a) describe trans-cuticular fluxes of NH+4 between apoplast and leaf surface. Contrary to direct gaseous NH3 transfer through stomates, such liquid-phase mediated transfers
25
BGD
10, 5385–5497, 2013Biosphere-atmosphere ammonia
exchange
C. R. Flechard et al.
Title Page
Abstract Introduction
Conclusions References
Tables Figures
◭ ◮
◭ ◮
Back Close
Full Screen / Esc
Printer-friendly Version Interactive Discussion
Discussion
P
a
per
|
Dis
cussion
P
a
per
|
Discussion
P
a
per
|
Discussio
n
P
a
per
|
The succession of wet and dry meteorological phases, such as nocturnal/diurnal cy-cles of dew formation and evaporation, and brief showers followed by sunny spells, may lead to alternating patterns of NH3 uptake and re-emission from plant leaf sur-faces. Cases of NH3 desorption from cuticles following leaf surface water evaporation have been reported (Sutton et al., 1995c, 1998a; Flechard et al., 1999; Neirynck and
5
Ceulemans, 2008), demonstrating the reversibility of the non-stomatal uptake process. Further, recent NH3 flux measurements over maize, coupled with surface water pH observations and controlled experiments, suggest that wet leaf surfaces may actually occasionally provide a less efficient sink for NH3than dry cuticles, as a result of trans-cuticular base cation leaching and the presence of alkaline soil particles, both raising
10
the pH of surface wetness (Walker et al., 2013).
All the processes described above are dependent on prevailing meteorological condi-tions, with surface wetness being controlled by the ratio of rainfall to evapotranspiration (driven by atmospheric VPD, wind speed and net radiation), while soil particle emis-sion (eroemis-sion) is governed by wind speed, soil dryness, as well as agricultural activities,
15
e.g. tillage. Air, vegetation and soil temperatures control a host of plant physiological (Sect. 2.3), soil and microbiological processes (Sect. 2.4). Plant growth and root NH+4 intake, microbial activity, ammonification (microbiological NH+4 fixation from N2), nitri-fication (microbiological oxidation of NH+4 into NO−3), soil respiration (mineralisation of soil organic matter) and leaf litter decay, all generally increase with temperature (given
20
adequate water and nutrient supply) and regulate the dynamics of ecosystem NH+4 pools and NH3exchange fluxes.
2.3 Plant physiological controls
Vegetation may be a net source or a net sink for NH3, depending on the nitrogen status of plants and thus (indirectly) on the influx of nitrogen into the ecosystem, whether by
25
BGD
10, 5385–5497, 2013Biosphere-atmosphere ammonia
exchange
C. R. Flechard et al.
Title Page
Abstract Introduction
Conclusions References
Tables Figures
◭ ◮
◭ ◮
Back Close
Full Screen / Esc
Printer-friendly Version Interactive Discussion
Discussion
P
a
per
|
Dis
cussion
P
a
per
|
Discussion
P
a
per
|
Discussio
n
P
a
per
|
controlling the NHx status of the apoplast of green leaves (defined as the intercellular space where water and solutes can move freely), stems and inflorescences, and to some extent of senescing attached leaves.
2.3.1 The stomatal compensation point
Meyer (1973) was the first to recognize that NH3is present (as NH3,aq and NH+4) in
in-5
tercellular fluids on the cell walls of the mesophyll cells of leaves (the apoplast), so that a compensation point air concentration of NH3exists. This was later shown in measure-ments by Lemon and Van Houtte (1980) and most famously by Farquhar et al. (1980). Prior studies using dynamic chamber measurements had typically shown consistent uptake by plant leaves and a direct control by stomatal conductance (e.g.
Hutchin-10
son et al., 1972), but the NH3 concentrations applied to the chamber inlet were often much greater than typical ambient levels encountered in the field (0.1–10 µg m−3), and above the stomatal compensation point (χs), precluding emissions from the apoplast. Since then, many controlled environment studies have shown linear relationships be-tween ambient NH3(χa) concentration and the NH3flux, with a bi-directional exchange
15
switching from an emission at lowχalevels to an uptake at higherχalevels, the switch occurring atχs(Sutton et al., 1995b; Husted et al., 1996; Schjoerring et al., 1998; Hill et al., 2001).
The stomatal compensation point is the equilibrium NH3 concentration associated with the [NHx] concentration in the apoplast, which results from the balance in healthy
20
leaves of several production and consumption processes. These include: NH+4 import via the xylem; active (unidirectional) NH+4 transport into leaf cell cytoplasm and vac-uole; passive (bi-directional) NH3 transport between apoplast and cells; NH+4 assim-ilation within the cytoplasm into amino acids via the glutamine synthetase/glutamate synthetase (GS/GOGAT) cycle; and NH+4 generation by, e.g. photorespiration, nitrate
25
BGD
10, 5385–5497, 2013Biosphere-atmosphere ammonia
exchange
C. R. Flechard et al.
Title Page
Abstract Introduction
Conclusions References
Tables Figures
◭ ◮
◭ ◮
Back Close
Full Screen / Esc
Printer-friendly Version Interactive Discussion
Discussion
P
a
per
|
Dis
cussion
P
a
per
|
Discussion
P
a
per
|
Discussio
n
P
a
per
|
mutants with a reduced GS activity (Mattsson and Schjoerring, 1996), both lead to NH+4 accumulation in the apoplast and dramatic increases in stomatal NH3emissions, demonstrating the critical role of GS (and GOGAT) in avoiding NH+4 accumulation in leaf tissues and regulating NH3emission.
2.3.2 Apoplastic pH
5
It is worth noting that, as the stomatal compensation point is not simply a function of [NH+4] in the apoplast, but rather a direct function of the [NH+4] / [H+] ratio (orΓ) in the apoplast (Γs) (Sect. 2.1),χs increases exponentially with pH. Any internal physiologi-cal regulation of apoplastic [H+] that does not have a commensurate effect on [NH+4] therefore systematically affects χs and the stomatal NH3 flux. Unlike intracellular pH,
10
which must be maintained within a narrow range (7.2–7.5) to allow all plant metabolic functions to proceed, apoplastic pH is rather variable due to a fairly low passive buffer capacity (Felle and Hanstein, 2002). The necessary regulation of intracellular pH is responsible for proton transfers across the cytoplasmic membrane, leading to apoplas-tic pH changes (Massad et al., 2008). In addition, plant responses to environmental
15
stress factors such as drought have also been shown to affect apoplastic pH (Felle and Hanstein, 2002; Sharp and Davies, 2009), as do variations in ambient soluble trace gas (NH3, CO2) concentrations (Hanstein and Felle 1999). Thus small fluctuations in membrane transport, gas exchange (stomatal conductance) and intercellular mass ex-change impact apoplastic pH (Felle and Hanstein, 2002). Apoplastic pH is also believed
20
to be influenced by N nutrition (Raven, 1988), even if the effect is unclear (Massad et al., 2008). Plant species relying on NO−3 nutrition and assumed to assimilate NO−3 in the shoots tend to have higher apoplastic pH, while vegetation relying on mixed N sources (NH+4, NO−3, organic N) and more likely to favour root assimilation tend to exhibit lower apoplastic pH values (Hoffmann et al., 1992).
BGD
10, 5385–5497, 2013Biosphere-atmosphere ammonia
exchange
C. R. Flechard et al.
Title Page
Abstract Introduction
Conclusions References
Tables Figures
◭ ◮
◭ ◮
Back Close
Full Screen / Esc
Printer-friendly Version Interactive Discussion
Discussion
P
a
per
|
Dis
cussion
P
a
per
|
Discussion
P
a
per
|
Discussio
n
P
a
per
|
2.3.3 Plant nitrogen nutrition
Plant nitrogen uptake and status, development stage and species all affectΓs, resulting in diurnal and seasonal fluctuations at the ecosystem scale (Schjoerring et al., 1998; Massad et al., 2008, 2010b). The form of inorganic nitrogen (either NH+4 or NO−3) be-ing taken up by roots has been shown to impact stomatal NH3 emission significantly,
5
with emissions from NH+4-fed barley being a factor 10 higher than those from NO−3-fed plants, consistent with higher leaf tissue [NH+4] and higher xylem NH+4 concentration, given equivalent N contents of the nutrient solution (Mattsson and Schjoerring, 1996).
Such effects of N form may have consequences for spatial distributions ofΓsvalues across landscapes, since well aerated agricultural soils are generally NO−3-rich and
10
NH+4-poor, while in permanent grasslands, heathlands and mature forests the opposite situation prevails (Schjoerring et al., 1998). Even though it is often assumed that all NH+4 is assimilated in the roots prior to transport to the shoots as amino acids, some studies have shown that at least a fraction of NH+4 might be transported prior to assim-ilation (Massad et al., 2008). By contrast, upon absorption by roots, NO−3 can either be
15
reduced to NH+4 in root cells, stored in root cell vacuoles, exported via the xylem to the leaves or expelled to the outside of the root. Thus the NH+4 abundance in xylem and in the apoplast of leaves depends both on the soil [NH+4] / [NO−3] ratio and on the bal-ance of root assimilation, transport and storage in roots. Further, althoughΓsgenerally increases with increasing N supply (Mattsson and Schjoerring, 1996), and
preferen-20
tially with NH+4 supply to the roots for several plant species, the relationship between the amount of N absorbed by the roots and the compensation point is not straightfor-ward because of a possible masking effect due to apoplastic pH change (Mattsson and Schjoerring, 2002; Massad et al., 2008).
High concentrations of N and NH+4 in bulk leaf tissues are expected to result in high
25
BGD
10, 5385–5497, 2013Biosphere-atmosphere ammonia
exchange
C. R. Flechard et al.
Title Page
Abstract Introduction
Conclusions References
Tables Figures
◭ ◮
◭ ◮
Back Close
Full Screen / Esc
Printer-friendly Version Interactive Discussion
Discussion
P
a
per
|
Dis
cussion
P
a
per
|
Discussion
P
a
per
|
Discussio
n
P
a
per
|
(Husted and Schjoerring, 1995). This direct method for the determination ofΓsis based on the measurement of the leaf apoplastic NH+4 concentration and pH by means of extraction with successive infiltration and centrifugation of leaf segments (Husted and Schjoerring, 1995). The measured apoplastic NH+4 concentrations differed by almost one order of magnitude between species, while apoplastic pH values also varied from
5
6.0 to 6.9. The resulting Γs values ranged from about 30 to over 700 and correlated very strongly (linearly) to bulk leaf [NH+4], with the consequence that three out of eight grass species with the highest stomatal compensation points could behave as NH3 sources, while the remaining five species were consistent sinks throughout the 3-week measurement campaign. Such variations in stomatal NH3 emission potentials among
10
species within the same habitat demonstrate the challenge of modelling the exchange at the ecosystem scale.
Massad et al. (2010b) compiled 60 published values of Γs for non-managed (non-fertilized) ecosystem types including forests, heathlands and moorlands (average 502, range 3–5604), and 96 publishedΓsvalues for managed systems including croplands,
15
and fertilized and/or grazed grasslands (average 782, range 16–5233). In addition to data obtained using the vaccuum infiltration technique, the data included estimates by cuvette-based controlled experiments and by field-scale micrometeorological flux measurements. Massad et al. (2010b) concluded that the key driver ofΓs appears to be the total N input to the ecosystem (whether by fertilization, atmospheric deposition,
20
or both), and that Γs values were positively and exponentially related to bulk tissue [NH+4]. Fertilized agricultural ecosystems generally show higher Γs values than semi-natural vegetation, although very largeΓs values were also reported for example over polluted forest sites in The Netherlands and Belgium, which have been subjected to high nitrogen deposition loads for decades (Neirynck and Ceulemans, 2008; Wyers
25
BGD
10, 5385–5497, 2013Biosphere-atmosphere ammonia
exchange
C. R. Flechard et al.
Title Page
Abstract Introduction
Conclusions References
Tables Figures
◭ ◮
◭ ◮
Back Close
Full Screen / Esc
Printer-friendly Version Interactive Discussion
Discussion
P
a
per
|
Dis
cussion
P
a
per
|
Discussion
P
a
per
|
Discussio
n
P
a
per
|
2.3.4 Temporal variations
The apoplasticΓsratio undergoes temporal variations on seasonal (Fig. 2) and diurnal time scales. Seasonal variations are expected to occur since the assimilation, transport and turnover of nitrogen change dramatically with plant developmental stage, and the seasonal NH3 exchange pattern may vary for different types of vegetation depending
5
on which processes dominate the actual N utilization (Schjoerring et al., 1998).
In two barley (Hordeum vulgare) cultivars grown in hydroponics, Husted et al. (1996) showed a marked decrease in the NH3 stomatal compensation point in the period from tillering to anthesis, followed by an increase during senescence. In a fertilized ryegrass (Lolium perenne) pasture, van Hove et al. (2002) found that mean spring
10
and summer apoplastic [NH+4] were a factor 2–3 lower than in autumn and winter, but no distinct trend for apoplastic pH. Similarly, in a beech (Fagus sylvatica) forest, Wang et al. (2011) measured a gradual decrease of Γs from leaf expansion (June) (Γs>150) until the mid-season (August) (Γs<100), followed by an increase during late season and approaching senescence (Γs>170). Consequently, during the two
15
(early season and late season) Γs peaks, the leaves could act as an NH3 source, while during the mid-season stomatal uptake prevailed. The authors concluded that a low glutamine synthetase activity in young, emerging beech leaves as well as in senescent leaves and hence, a low capacity for NH+4 assimilation, resulted in increased concentrations of tissue and apoplastic NH+4. Cellular breakdown during senescence
20
and the associated catabolism of proteins, amino acids and chlorophyll liberates large amounts of NH+4, which is no longer assimilated and raises the NH3emission potential of plants, even before leaves drop to the litter on the ground surface (Mattsson and Schjoerring, 2003). Age-related differences in the NH3 compensation point of Luzula sylvatica were also found to be considerable (Hill et al., 2002), with both apoplastic
25
BGD
10, 5385–5497, 2013Biosphere-atmosphere ammonia
exchange
C. R. Flechard et al.
Title Page
Abstract Introduction
Conclusions References
Tables Figures
◭ ◮
◭ ◮
Back Close
Full Screen / Esc
Printer-friendly Version Interactive Discussion
Discussion
P
a
per
|
Dis
cussion
P
a
per
|
Discussion
P
a
per
|
Discussio
n
P
a
per
|
Diurnal patterns of Γs are generally less systematic than seasonal ones, even if there can be a large degree of hour-to-hour variability (Sutton et al., 2000; Herrmann et al., 2009; Flechard et al., 2010). Although diurnal cyles of NH3 exchange fluxes have been observed in, e.g. Brassica napus (Husted et al., 2000), Hordeum vulgare (Schjoerring et al., 1993) and tropical grassland (Trebs et al., 2006), with highest NH3
5
emission rates typically occurring during the daytime and low rates at night, much of the observed diurnal variability in fluxes may be attributed to the temperature effect rather than toΓs (Sutton et al., 2000; Personne et al., 2009). Reported diurnal variations in apoplastic NH+4 and H+ concentrations often do not follow any particular trend (Husted et al., 2000; van Hove et al., 2002), even if some observations in a mixed graminae
10
sward did tend to indicate higher Γs values during the day than at night (Herrmann et al., 2009), especially after the grass was cut and fertilized.
2.3.5 Fertilization effects on the apoplastic emission potential
Agricultural management (fertilization, animal grazing, grass cutting) is another source of temporal variability forΓs. A number of studies have shown that, in managed
agri-15
cultural systems, field fertilizer application results in a Γs peak during the days fol-lowing the application and usually a return to the pre-fertilization value within one to two weeks. Mattsson and Schjoerring (2002) demonstrate that leaf apoplastic NH+4 is a highly dynamic pool, closely reflecting changes in the external (e.g. root) N supply. In fertilizedLolium perenne grassland, Loubet et al. (2002) measured an increase in
20
both apoplastic [NH+4] and Γs by up to two orders of magnitude immediately follow-ing the application of ammonium nitrate fertilizer, but the effect was short-lived, lasting only two weeks (Fig. 2). Mattsson et al. (2009b) also observed a sharp (factor 10) in-crease in the apoplastic NH+4 concentration of newly emerging leaves after cutting and fertilization of mixed grassland, whereby the NH3 compensation point peaked the day
25
BGD
10, 5385–5497, 2013Biosphere-atmosphere ammonia
exchange
C. R. Flechard et al.
Title Page
Abstract Introduction
Conclusions References
Tables Figures
◭ ◮
◭ ◮
Back Close
Full Screen / Esc
Printer-friendly Version Interactive Discussion
Discussion
P
a
per
|
Dis
cussion
P
a
per
|
Discussion
P
a
per
|
Discussio
n
P
a
per
|
grass cuts and grazing have also been reported (Milford et al., 2001b ; van Hove et al., 2002; Loubet et al., 2002; Wang and Schjoerring, 2012).
2.3.6 Stomatal conductance
Another major physiological control of NH3 exchange fluxes at the leaf and plant level is the regulation of stomatal opening and conductance, through which the gaseous
ex-5
change between the sub-stomatal cavity and the atmosphere is mediated. Stomatal conductance (Gs) has long been known to be controlled by global radiation (Rg) or photosynthetically active radiation (PAR), air temperature (Ta), vapour pressure deficit (VPD), and soil water content (SWC) (Jarvis et al., 1976; Emberson et al., 2000a,b). Heat and drought stress cause stomata to close during the daytime, reducingGs,
evap-10
otranspiration, CO2 assimilation and the stomata/atmosphere transfer of trace gases including NH3. For example, NH3 flux measurements over soybean during dry sum-mer conditions showed much suppressed stomatal exchange fluxes, and the bulk of the exchange dominated by non-stomatal fluxes, due to limited soil water availabil-ity and drought affecting stomatal opening during the afternoon (Walker et al., 2006).
15
Those authors pondered whether their results were representative of soybean within their study area, but it should be stressed that such measurements are extremely valu-able to characterize NH3 exchange in dry conditions and regions of the world, since a large majority of existing field NH3 flux datasets are representative of reasonably well-watered conditions in temperate climates.
20
Further, research over the past 20–30 yr has shown the impact of rising CO2 (Ainsworth and Rogers, 2007) and O3 (Wittig et al., 2007) concentrations on stom-atal conductance, with expected reductions of Gs of the order of −20 % to −30 % for elevated CO2and−10 % to−20 % for elevated O3. Within the context of global change, such impacts onGsshould be accounted for when considering present and future
sce-25
BGD
10, 5385–5497, 2013Biosphere-atmosphere ammonia
exchange
C. R. Flechard et al.
Title Page
Abstract Introduction
Conclusions References
Tables Figures
◭ ◮
◭ ◮
Back Close
Full Screen / Esc
Printer-friendly Version Interactive Discussion
Discussion
P
a
per
|
Dis
cussion
P
a
per
|
Discussion
P
a
per
|
Discussio
n
P
a
per
|
2.4 Soil and microbial processes
Many processes within the soil profile and on the soil surface lead to an NH+4 pool be-ing present and available for exchange with the air column above the ground. Within the topsoil and particularly the root zone of any land ecosystem, the NH+4 pool is de-pleted by root absorption, by nitrification, by microbial immobilization, and by emission
5
to the atmosphere; it is replenished by atmospheric deposition, by symbiotic N2 fixa-tion (BNF) and ammonificafixa-tion, by microbial turnover, by mineralizafixa-tion of soil organic matter (SOM) and of N-containing root exudates, and by the decay of leaf litter on the ground surface. Adsorption and binding to negatively charged clay mineral and organic colloids represent a transient pool, while dilution and infiltration through the deeper soil
10
layers decrease the emission potential. In addition, in fertilized agricultural systems, the large and sporadic inputs of mineral and organic forms of N lead to sudden increases in available N and particularly NH+4, often well in excess of the instantaneous plant and microbial demand. In keeping with theΓs terminology adopted for the apoplastic [NH+4] / [H+] ratio, corresponding terms may be defined for the topsoil layer (Γsoil), for
15
the leaf litter (Γlitter), or collectively a ground layer term (Γg). Figure 3 illustrates how typical values measured forΓsoil and Γlitterfar outweigh (by 2–3 orders of magnitude) Γsvalues in fertilized cut grassland, especially during the days following the application of fertilizer.
2.4.1 Soil background emission potential
20
Ammonium and ammonia are naturally present in soils as a product of microbial turnover and soil organic matter mineralisation, while fertilization (mineral and organic) as well as grazing in grasslands both supply large quantities of reduced N to agricul-tural soils. However, soil NH+4 is depleted by root uptake during the growing season, and by nitrification in well aerated soils, while the soil NH3 emission potential (Γsoil)
25
BGD
10, 5385–5497, 2013Biosphere-atmosphere ammonia
exchange
C. R. Flechard et al.
Title Page
Abstract Introduction
Conclusions References
Tables Figures
◭ ◮
◭ ◮
Back Close
Full Screen / Esc
Printer-friendly Version Interactive Discussion
Discussion
P
a
per
|
Dis
cussion
P
a
per
|
Discussion
P
a
per
|
Discussio
n
P
a
per
|
although at that time field verification of the modelled fluxes were missing (Dawson, 1977).
In a more recent study over grassland, David et al. (2009) also identified the under-lying soil as a strong potential source, but only after the grass was cut and for a short period of time (∼1 day), and even then the soil potential emission was a factor of 3
5
lower than that of the leaf litter. However, few publications have ever shown soil below vegetation to be an ammonia source, be it below a grassland canopy in summer (Sut-ton et al., 1993b), under barley (Schjoerring et al., 1993), or oilseed rape (Nemitz et al., 2000a).
Neftel et al. (1998) actually suggested that soil must be a sink for NH3 in a triticale
10
field, since their semi-permeable membrane setup for direct measurements of NH3 concentration in the soil showed consistently low (<0.1 µg m−3) concentrations. This was despite large measured [NH+4] values in soil KCI extracts, which, accounting for the soil pH of 6.5, should have resulted in soil pore space NH3 concentrations 2 or-ders of magnitude higher than those measured. They concluded from this discrepancy
15
that the largest part of the estimated ammonium content in the soil was not in the liq-uid phase, but was instead adsorbed to solid soil particles, and thus not available for gas exchange with open porosity and the atmosphere. Similarly, Nemitz et al. (2000a) measured much lower NH3concentrations at a depth of−0.1 m within the soil than just above the leaf litter of oilseed rape, ruling out the possibility that the underlying soil may
20
have been an NH3source in that study, and pointing to the importance of substantial NH3 gradients at the air–soil–litter interface. There are altogether few reports of soil emission potentials for vegetated canopies in the literature that clearly distinguish the soil emission potential and flux from those associated with the leaf litter or the whole canopy (see Massad et al., 2010b for a review).
25
2.4.2 Soil emissions after fertilizer and manure application
BGD
10, 5385–5497, 2013Biosphere-atmosphere ammonia
exchange
C. R. Flechard et al.
Title Page
Abstract Introduction
Conclusions References
Tables Figures
◭ ◮
◭ ◮
Back Close
Full Screen / Esc
Printer-friendly Version Interactive Discussion
Discussion
P
a
per
|
Dis
cussion
P
a
per
|
Discussion
P
a
per
|
Discussio
n
P
a
per
|
2002; Meyers et al., 2006; Sintermann et al., 2012). At the European scale, the land spreading of organic manures is believed to contribute around 30–40 % of total NH3 emissions (Sintermann et al., 2012, and references therein). Values of Γsoil typically increase by one or several orders of magnitude after slurry spreading (Flechard et al., 2010). Although Fig. 3 indicates that Γlitter was a factor of 10 higher than Γsoil in the
5
grassland system in Sutton et al. (2009b), even after fertilization, this study dealt with mineral fertilizer, and the situation is quite different for organic manures. A dominant mechanism of NH3 loss to the atmosphere is the hydrolysis of urea and/or uric acid present in large quantities in animal wastes, i.e. urine, slurries and farm yard manures, by the urease enzyme present in the excreted faeces and also in the soil. This leads to
10
large concentrations of dissolved NHxand thus a high pH, promoting NH3volatilisation from the liquid phase. Urea hydrolysis also produces dissolved inorganic carbon, and the subsequent volatilisation of CO2 increases pH, while NH3 volatilisation decreases pH and is in principle self-limiting.
Apart from meteorological effects (Sect. 2.2), the most important processes
control-15
ling NH3 volatilisation are the ion production and buffering processes controlling the pH of the slurry/soil liquid, the solid chemistry that determines precipitation of NH+4 to slurry dry matter, the physical processes controlling the movement of slurry liquid into and within the soil, the interaction of slurry liquid with soil cation exchange capacity (CEC) (Sommer et al., 2003; Genermont and Cellier, 1997). Note that the method of
20
field application (splash plate, trailing hose, trailing shoe, soil injection) is also expected to make a difference, with “low emission” application techniques being promoted in a number of countries to abate field losses (Sintermann et al., 2012; Carozzi et al., 2013).
Soil pH is expected to be a critical parameter controlling the magnitude of the
per-25
BGD
10, 5385–5497, 2013Biosphere-atmosphere ammonia
exchange
C. R. Flechard et al.
Title Page
Abstract Introduction
Conclusions References
Tables Figures
◭ ◮
◭ ◮
Back Close
Full Screen / Esc
Printer-friendly Version Interactive Discussion
Discussion
P
a
per
|
Dis
cussion
P
a
per
|
Discussion
P
a
per
|
Discussio
n
P
a
per
|
losses from surface applied fertilizer and manures, as incomplete mixing may typically occur. Thus when and where soil pH affects the flux is a very complex question.
Soil microbial nitrification of the applied manure or fertilizer NH+4 depletes the NHx pool and thus may potentially limit the NH3emission potential in the days following field spreading. Whether nitrification significantly reduces NH3emission factors depends on
5
nitrification rates, which have been shown to be extremely variable. For example Felber et al. (2012) measured very fast conversion of applied NH+4 from cattle slurry to NO−3 in top soil (0–10 cm) of grassland, with most of the NH+4 being nitrified within 2 days. By contrast, Laubach et al. (2012) found that nitrification proceeded more slowly in grassland fertilized with cattle urine, as soil [NH+4] only decreased by half over a week,
10
although here soil [NH+4] was roughly a factor of 50 higher than in the study by Felber et al. (2012). Such variability highlights the need to give nitrification proper considera-tion in models of NH3volatilisation.
Emissions from synthetic fertilizers depend on the form of inorganic N applied but are typically smaller per unit added N than from manures. Emission from urea-based
15
compounds are larger than from ammonium nitrate fertilizers, which do not raise soil solution pH. The use of urease inhibitors has been shown to reduce and delay NH3 volatilisation from urea in a number of field trials, including in a fertilized maize field, in which Walker et al. (2013) detected two distinct emission pulses spread over one month.
20
Despite extensive trials with a large literature over the last 25 yr and good funda-mental understanding of NH3 losses from field-applied manures and fertilizers (e.g. Søgaard et al. (2002) and the Ammonia Loss from Field-applied Animal Manure – AL-FAM – database), there remain substantial uncertainties in field-scale NH3 fluxes and the associated emission factors (EF). Sintermann et al. (2012) compiled and reviewed
25
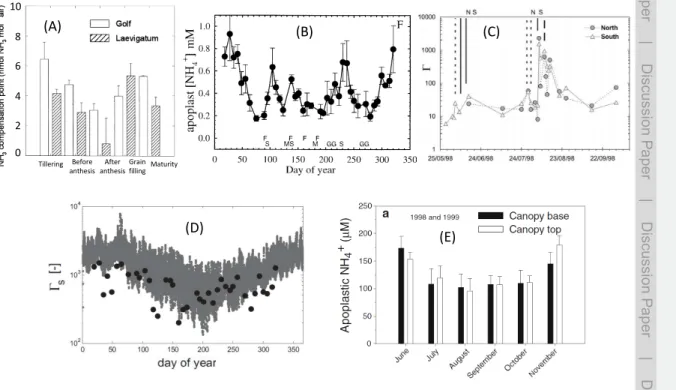
![Fig. 3. Time course of estimated Γ values (ratio of [NH + 4 ] / [H + ]) in different compartments of a mixed grassland ecosystem (from Sutton et al., 2009b)](https://thumb-eu.123doks.com/thumbv2/123dok_br/18201242.333511/107.918.99.622.142.429/course-estimated-values-different-compartments-grassland-ecosystem-sutton.webp)