www.ann-geophys.net/27/1213/2009/
© Author(s) 2009. This work is distributed under the Creative Commons Attribution 3.0 License.
Annales
Geophysicae
Mass analysis of charged aerosol particles in NLC and PMSE
during the ECOMA/MASS campaign
S. Robertson1, M. Hor´anyi1, S. Knappmiller1, Z. Sternovsky1, R. Holzworth2, M. Shimogawa2, M. Friedrich3,
K. Torkar4, J. Gumbel5, L. Megner5, G. Baumgarten6, R. Latteck6, M. Rapp6, U.-P. Hoppe7, and M. E. Hervig8 1Laboratory for Atmospheric and Space Physics, University of Colorado, Boulder, CO 80309, USA
2Earth and Space Sciences, University of Washington, Seattle, WA 98195 USA
3Institute of Communication Networks and Satellite Communications, Graz University of Technology, 8010 Graz, Austria 4Space Research Institute, Austrian Academy of Sciences, 8042 Graz, Austria
5Department of Meteorology, Stockholm University, 10691 Stockholm, Sweden 6Leibniz Institute for Atmospheric Physics, 18225 K¨uhlungsborn, Germany 7Norwegian Defence Research Establishment (FFI), 2027 Kjeller, Norway 8GATS, Inc., Driggs, Idaho, 83422, USA
Received: 20 October 2008 – Revised: 21 January 2009 – Accepted: 4 February 2009 – Published: 12 March 2009
Abstract. MASS (Mesospheric Aerosol Sampling Spec-trometer) is a multichannel mass spectrometer for charged aerosol particles, which was flown from the Andøya Rocket Range, Norway, through NLC and PMSE on 3 August 2007 and through PMSE on 6 August 2007. The eight-channel analyzers provided for the first time simultaneous measure-ments of the charge density residing on aerosol particles in four mass ranges, corresponding to ice particles with radii <0.5 nm (including ions), 0.5–1 nm, 1–2 nm, and>3 nm (ap-proximately). Positive and negative particles were recorded on separate channels. Faraday rotation measurements pro-vided electron density and a means of checking charge den-sity measurements made by the spectrometer. Additional complementary measurements were made by rocket-borne dust impact detectors, electric field booms, a photometer and ground-based radar and lidar. The MASS data from the first flight showed negative charge number densities of 1500– 3000 cm−3for particles with radii>3 nm from 83–88 km ap-proximately coincident with PMSE observed by the ALWIN radar and NLC observed by the ALOMAR lidar. For parti-cles in the 1–2 nm range, number densities of positive and negative charge were similar in magnitude (∼2000 cm−3) and for smaller particles, 0.5–1 nm in radius, positive charge was dominant. The occurrence of positive charge on the aerosol particles of the smallest size and predominately nega-tive charge on the particles of largest size suggests that
nucle-Correspondence to:S. Knappmiller ([email protected])
ation occurs on positive condensation nuclei and is followed by collection of negative charge during subsequent growth to larger size. Faraday rotation measurements show a bite-out in electron density that increases the time for positive aerosol particles to be neutralized and charged negatively. The larger particles (>3 nm) are observed throughout the NLC region, 83–88 km, and the smaller particles are observed primarily at the high end of the range, 86–88 km. The second flight into PMSE alone at 84–88 km, found only small number den-sities (∼500 cm−3) of particles>3 nm in a narrow altitude range, 86.5–87.5 km. Both positive (∼2000 cm−3) and nega-tive (∼4500 cm−3) particles with radii 1–2 nm were detected from 85–87.5 km.
Keywords. Atmospheric composition and structure (Aerosols and particles; Cloud physics and chemistry) – Ionosphere (Polar ionosphere)
1 Introduction
density arising from atmospheric turbulence. Modulation at the Bragg scale results in enhanced radar backscatter called Polar Mesosphere Summer Echoes (PMSE). These radar ob-servations can arise from particles smaller than those respon-sible for NLC. PMSE show that icy aerosol particles occur more frequently than NLC and over a wider range of altitudes (Rapp and L¨ubken, 2004). The particles may capture suffi-cient numbers of electrons to cause reductions in electron density called “bite-outs” that were observed by rocket-borne plasma probes and in Faraday rotation data (Pedersen et al., 1970; Ulwick et al., 1988; Croskey et al., 2004). Ion mass spectrometers have also measured reductions in ion density when NLC are present (Balsiger et al., 1996).
The ice particles that grow to become NLC are sufficiently large to be seen by optical scattering methods: lidars (von Cossart et al., 1999), satellite-borne cameras (DeLand et al., 2006; Russell et al., 2008), and rocket-borne photometers (Gumbel et al., 2001). Ice particles have recently been de-tected by optical extinction using a satellite-borne limb scan-ner (Gordley et al., 2008; Hervig et al., 2009). Analysis of scattering data of visible NLCs typically finds the character-istic sizes in the range 20–100 nm with number densities of order 100 cm−3(e.g. Baumgarten et al., 2008). Much less is known about the subvisual aerosol particles, although these have a significantly larger number density. The detection of these particles by rocket-borne instruments is made possible through the collection of the charge they carry. If the number density of aerosol particles is much less than the plasma den-sity, the attachment of electrons to aerosol particles occurs at a much higher rate than the attachment of ions, thus the num-ber density of aerosol particles with negative charge greatly exceed the number density with positive charge (Rapp and L¨ubken, 2001). If the number density of aerosol particles is sufficient to deplete the electron density, then the relative probability of collecting ions is increased.
Unicharged ice particles have been detected by particle im-pact detectors (Zadorozhny et al., 1997). Havnes et al. (1996) flew a Faraday cup through NLC and found negative parti-cles but also positive partiparti-cles in number densities too large to be accounted for by the standard plasma charging model. Positive particles have also been observed by detectors of dif-ferent designs (Blix et al., 2003; Smiley et al., 2003) and in the absence of NLC conditions (Gelinas et al., 1998; Rapp et al., 2005; Amyx et al., 2008). The possibility of photo-electric charging has been considered (Havnes et al., 1990; Rapp and L¨ubken, 1999), but this would require a reduction of the work function of ice by easily-ionized impurities such as sodium. Recent experiments show that this reduction oc-curs in the laboratory but the usual concentration of Na is too small to account for observations in the mesosphere (Von-drak et al., 2006a, b). In a single-channel instrument that collects the net charge of aerosol particles the detection of a large number of negative particles (for example) can mask the detection of positive particles.
The aerodynamic flow around a rocket payload may carry the smallest particles around the detector (Rapp et al., 2005; Hedin et al., 2007; Amyx et al., 2008). An alternate detec-tor design, the Gerdien condenser, is open at the bottom and allows passage of air through the instrument. There is an upper bound on mass that can be varied by scanning the col-lector voltage (Croskey et al., 2001), but the scanning results in a loss of altitude resolution. The number density of the charged fraction of the aerosol particles has been deduced from the data of these charge-collecting instruments and is of order 103cm−3, which is much greater than the number densities of visible NLC particles. Recently, the uncharged aerosol particles (including meteoritic particles) have been detected by instruments on a payload carrying a flashlamp for active photoioinization (Rapp and Strelnikova, 2008).
We present data from two flights of rocket-borne mul-tichannel mass analyzers for charged aerosol particles that were flown into PMSE and NLC on 3 August 2007 (MASS1) and into PMSE alone on 6 August 2007 (MASS2). The flights were part of the ECOMA/MASS campaign that com-bined three rocket flights, ground-based measurements by li-dar and rali-dar, and observations by the AIM (Aeronomy of Ice in the Mesosphere) satellite (Russell et al., 2008). The two MASS payloads carried the Mesospheric Aerosol Sam-pling Spectrometer (MASS), which is a multichannel mass analyzer that simultaneously collects both the positive and negative charge residing on aerosol particles (Knappmiller et al., 2008). The spectrometer has four pairs of collecting sur-faces contained within the instrument housing for four ranges of particle size. The analyzer uses electrostatic deflection so that particles of different sizes are collected on different pairs of plates, with one of the pair collecting positive particles and the other collecting negative particles. Air passes through the instrument continuously, thus aerodynamics has only a small mass-selective effect.
number densities of sufficiently-large meteoric particles that are too low to account for the number densities of charged aerosol particles (Megner et al., 2006, 2008; Bardeen et al., 2008). Section 6 is a short summary and conclusion.
2 The MASS payloads
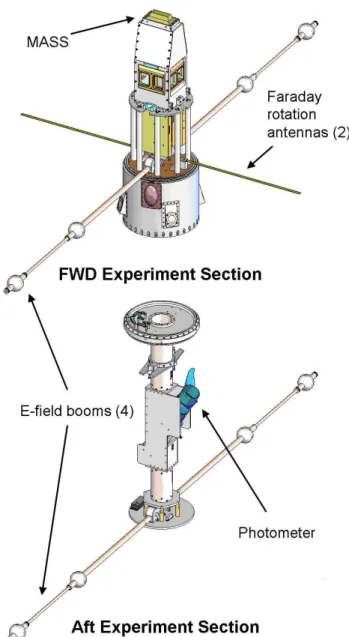
The two MASS payloads, Fig. 1, were practically identical. Each had four instruments: a MASS analyzer, fore and aft electric field booms (e.g. Holzworth and Goldberg, 2004), a photometer (Gumbel and Witt, 2001), and an antenna pair for Faraday rotation measurements of electron density (Jacobsen and Friedrich, 1979). The attitude control system (ACS) and telemetry were located between the fore and aft experimental sections. The ACS was programmed to adjust the spin rate to 2 Hz (above 80 km) and to keep the rocket pointed in the ram direction from 75–95 km on the upleg and downleg so that aerosol particles entered the MASS analyzer with velocity vectors parallel to the instrument axis. Post-flight analysis of data indicated that the pointing error was less than 1 degree. The telemetry operated with an amplitude resolution of 12 bits and at a 1.1 kHz sampling rate corresponding to an alti-tude resolution of approximately 0.9 m. The MASS analyzer data were smoothed to reduce high frequency noise using a Gaussian window function having a width of 10 ms.
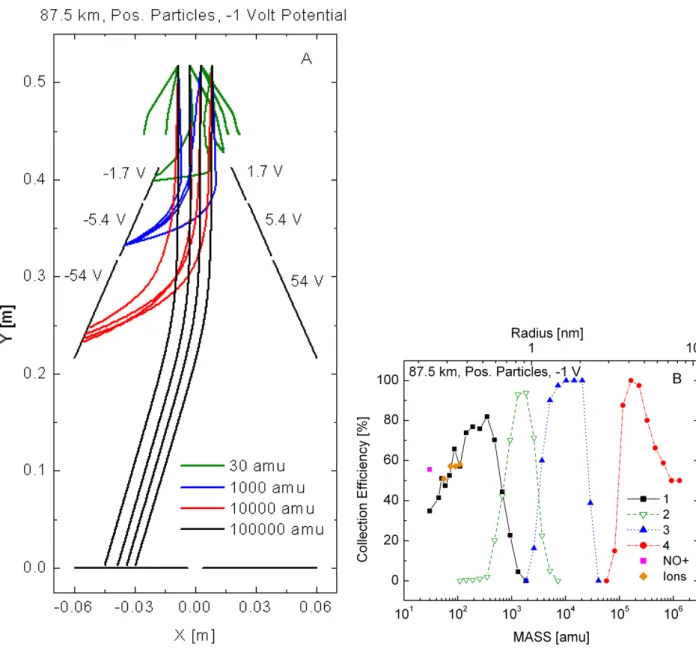
The MASS instrument (Knappmiller et al., 2008) is an electrostatic mass analyzer for nanometer-sized charged aerosol particles that is mounted at the top of the rocket pay-load. The instrument uses the electrostatic force to deflect the charged particles so that their charge is deposited on a set of collection plates with bias voltages. On one side of the analyzer are three negatively-biased graphite plates for col-lection of positive particles and on the opposite side there are three positively-biased plates for negative particles (Fig. 2a). The bias voltages on the first three pairs of plates are±1.7 V,
±5.4 V and±54 V. An additional pair of unbiased plates col-lects the largest particles with small deflection. Deflecting these particles would require voltages sufficiently large for a risk of electrical breakdown. The positive and negative aerosol particles are thus sorted into mass bins with radii in the ranges<0.5 nm, 0.5–1 nm, 1–2 nm, and>3 nm (approxi-mately). The radius is found from the mass by assuming that the particles are spherical and have the density of water ice (931 kg/m3).
The collection efficiency as a function of mass for each of the collection plates, Fig. 2a, is found for atmospheric conditions at 2.5 km intervals from 80 to 90 km using a de-tailed three-dimensional numerical simulation, which calcu-lates the trajectories of the charged aerosol particles. The temperatures and densities are taken from L¨ubken (1999). The collection efficiencies from the simulations are summa-rized in Table 1 for the altitudes of 80 and 90 km that bracket the PMSE region. Collection efficiency curves for 87.5 km (near to the location of the highest density of
nanometer-Fig. 1. Engineering drawing of the MASS payloads consisting of
the forward (FWD) experimental section and the aft experimental section. The diameter of the rocket skin is 36 cm. The electric field booms span 3 m tip-to-tip when fully deployed and their vertical separation is also 3 m.
Fig. 2. (A)Plots of simulated trajectories of charged ice particles within the MASS instrument. At least 4 trajectories are plotted for each of the 4 particle masses. The trajectories are terminated if they hit an interior surface or if they leave the sampled air volume before entering the instrument. The assumed payload potential is−1 V.(B)Sensitivity curves from the numerical simulations that show the relative sensitivity of each channel as a function of mass at 87.5 km. Particles with radii 2–3 nm are deflected toward the air exit windows and thus do not fall on a collector plate, leaving a gap near 25 000 amu in the collected range of mass. The filled diamond symbols labeled “Ions” is for the proton hydrates with masses 55, 73, 91, and 109 amu and the magenta square is for the NO+ion.
aerosol particles from the equations of motion using (1) the force of the electrostatic field assuming unit charge on the aerosol particle and (2) the impulsive changes to the parti-cles’ velocity vector caused by random collisions with air molecules. The number density, temperature, and flow ve-locity of the air and the electric field are used as inputs to the trajectory modeling code. Trajectories are found for 35 logarithmically-spaced masses from 30 to 1.3×10⁶amu. The trajectories are started 82 mm above the opening in an area
sufficiently larger than the slit to allow scattering both into and out of the sampled volume of air. Additional (preflight) sensitivity curves for vacuum conditions were obtained ex-perimentally using an ion source. Details of the flow simula-tions and particle trajectory calculasimula-tions are given in Knapp-miller et al. (2008).
Table 1. Ranges of masses detected by each of the eight MASS channels calculated for atmospheric conditions at 80 km and 90 km. Columns 2 and 3 are with no assumed rocket potential. Columns 3 and 4 are with an assumed potential of−1 V (Knappmiller et al., 2008). The range listed is the range for which the collection effi-ciency for the channel exceeds half the maximum for that channel.
Channel 80 km 90 km 80 km−1 V 90 km−1 V
number [amu] [amu] [amu] [amu]
1+ <200 70–800 <300 35–600 1− <200 70–800 <250 200–900
2+ 200–1500 800–3000 180–1500 600–3000 2− 200–1500 800–3000 160–1500 900–3000
3+ 1500–30 000 3000–25 000 1500–30 000 3000–25 000 3− 1500–30 000 3000–25 000 1600–22 000 3000–28 000
4+ >50 000 >85 000 >95 000 >80 000 4− >50 000 >85 000 >90 000 >90 000
radius of a nitrogen molecule (Dushman, 1962) because ni-trogen is the dominant neutral species. The cross section be-ing that for a solid sphere is poor for particles below a few hundred amu in mass where collisions are better described by quantum mechanics than by classical mechanics. For the mass 30 amu corresponding to NO+ ions, additional sim-ulations were done using measured cross sections for col-lisions of NO+ with N2 molecules (Viehland and Mason, 1995). This cross section is velocity dependent and the value used (2.1×10⁻¹⁵cm2) is for a typical relative velocity for the collisions in the simulations. For masses 55, 73, 91, and 109 amu, corresponding to the proton hydrates H+[H2O]n withn=3, 4, 5, and 6, simulations were done with cross sec-tions from Sternovsky et al. (2001). The collection efficien-cies could easily be in error by 20% because of uncertainties in cross sections. The error is greater if the particles are fluffy aggregates that have an effective collision cross section dif-ferent from that indicated by their mass.
The nominal mass range collected by each plate is affected in flight by the payload charging potential and by the colli-sion frequency of the aerosol particles with air molecules, which changes with altitude. The effect of a higher collision frequency is to widen the range of masses collected by each plate as particles are scattered into and out of the flow field. The effect of collisions is largest for the smallest masses at lower altitudes where the atmospheric density is the largest (Knappmiller et al., 2008). Measurements of the charging potentials of rockets in the mesosphere indicate values of ap-proximately−1 volt (Friedrich et al., 1997). The payload did not carry a Langmuir probe biased for electron density measurement because electron collection by a probe often results in the payload being several volts negative (e.g. Strel-nikova et al., 2009). The expected payload potential is non-negligible in comparison with the bias potentials on the first two pairs of collection plates. Simulations were done with and without−1 volt on the payload for both positive and
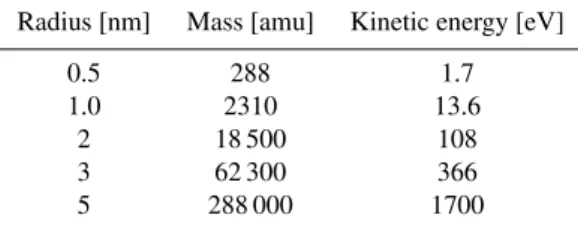
neg-Table 2.Kinetic energy as a function of radius and mass for aerosol
particles of ice. A velocity of 1 km/s is assumed.
Radius [nm] Mass [amu] Kinetic energy [eV]
0.5 288 1.7
1.0 2310 13.6
2 18 500 108
3 62 300 366
5 288 000 1700
ative aerosol particles to evaluate its effect on the sensitivity curves. The payload potential effect is found to be dependent upon the collision frequency. At 80 km a payload potential of−1 V has negligible effect on particles with either sign of charge because the incoming particles are prevented by col-lisions from being significantly accelerated by the change in potential above the entrance slit. However, at 90 km the pay-load potential retards negatively charged aerosols limiting the collection of particles below∼200 amu and it accelerates the positive aerosols enhancing their collection between 200 and 900 amu. The range of masses collected by each MASS channel are listed in Table 1 with and without a rocket poten-tial of−1 V. The primary source of uncertainty in the range of masses collected is from the uncertainty in the payload potential. Table 2 shows the energies in electron volts with which aerosol particles enter the instrument as a function of radius and mass. The effect of a−1 V rocket potential on a singly charged particle is small for an incident particle en-ergy of∼7 eV or more which applies to particles with radii greater than ∼0.75 nm (∼900 amu). Simulations for elec-trons were not done, however, it can be inferred from the trajectories of the lightest negative particles that (1) electron collection is prevented by a potential of−1 V in the absence of collisions and (2) that without the charging potential the high thermal velocity of electrons would carry a large frac-tion into the walls of the entrance slit.
The current flowing to a collection plate is of the order of 1 nA and is measured by an electrometer. The collected cur-rentI is related to the number density of charge byI=fnqvA
the cross section of the dominate ion species NO+at 90 km where the air density is lower. At a typical rocket speed of 1 km/s, a current of 1 nA corresponds to a charge number density of 2340 cm−3forf=1.0.
The data quality may be affected by the occurrence of spu-rious currents from two sources. The first is photoemission from the collecting surfaces caused by solar ultraviolet ra-diation. This effect is minimized by having the collection surfaces within an enclosure and by having graphite collec-tion surfaces which have a low photoelectron yield (Feuer-bacher and Fitton, 1972). The second effect is the generation of charged fragments created by the impact of ice particles that has been observed in laboratory experiments (Vostrikov et al., 1987, 1988, 1997; Andersson and Pettersson, 1997) and proposed as an explanation for some signals from rocket-borne instruments (Havnes and Næsheim, 2007). Charge generation is largest for the aerosol particles with the great-est mass. The upper collecting surfaces within the MASS instrument slope away from the slit opening so that the par-ticles incident on each plate are only the charged parpar-ticles in the desired mass range. Spurious charge generation would be most likely for the fourth pair of plates at the bottom of the instrument that receive the heaviest charged aerosol particles and the undeflected neutral particles. Below, in Sect. 3.5 it is argued that these spurious currents are absent.
3 MASS1 flight data
Data from the MASS instrument were obtained on the upleg and downleg of each flight. The data for MASS1 are pre-sented in this section and the data for MASS2 are prepre-sented in Sect. 4. Within each section, the conditions at launch are described and then the data for upleg and downleg are pre-sented in order of increasing mass. The lowest-mass chan-nels collecting positive and negative charge are labeled 1+ and 1−, respectively, and the highest mass channels are 4+ and 4−. Three checks are made on the data quality. First, in Sect. 3.2, the positive ion density from the channel 1+ (positive ions) is compared to the electron density in regions where they are expected to be nearly equal. Second, signals are examined in Sect. 3.5 to find if there is evidence for the creation of charge by impacts of neutral particles. Third, in Sect. 5.1 the sum of the positive and negative charge densi-ties is examined to determine if the sum is consistent with quasineutrality.
3.1 Launch conditions for MASS1
The launches were made from the Andøya Rocket Range (69◦N, 16◦E), Norway, which is collocated with the ALO-MAR observatory. Launch decisions were aided by ground-based data from the ALWIN radar (Latteck et al., 1999) and the ALOMAR RMR lidar (von Zahn et al., 2000). A launch window in the first two weeks of August was selected to be
both within the NLC season and to have a low solar eleva-tion angle near local midnight to minimize solar ultraviolet radiation that may affect instruments. It was also desired to maximize scientific return by having launches as near in time as possible to the ECOMA3 rocket launch (Rapp et al., 2009) and having in situ measurements during the operating period of the AIM satellite launched in April 2007.
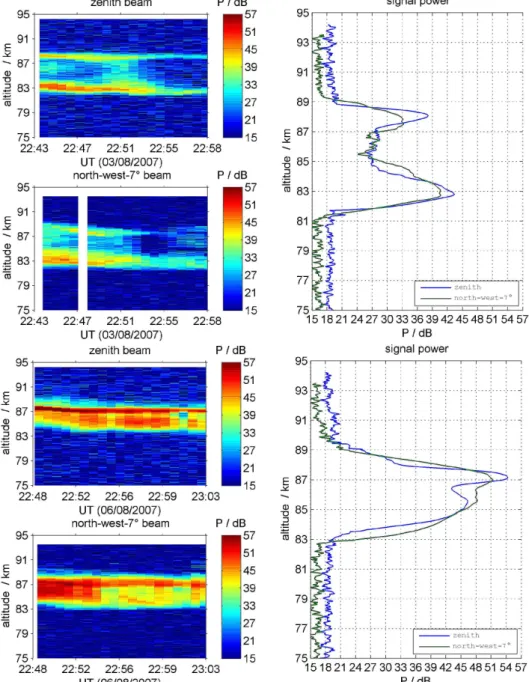
MASS1 (NASA designation 41.069) was launched on 3 August 2007 and reached an apogee of 133.3 km. Prepara-tions for launch were started at 17:00 UTC during a strong PMSE observed with the ALWIN radar and were suspended for several hours when the PMSE became weak. The count-down was resumed when the PMSE strengthened, Fig. 3, and the launch occurred at 22:51:20 UTC. The solar zenith angle was 93.2 degrees. The rocket velocity dropped from 1106 m/s at 80 km to 1018 m/s at 90 km. The PMSE showed a double structure with peaks at 83 and 88 km, which is com-mon (Hoffmann et al., 2005). Approximately 5 min before the launch the ALOMAR RMR lidar, Fig. 4, showed a weak NLC at 82–84 km with a peak backscatter coefficient of only 3.3×10⁻¹⁰ (m sr)−1 at 82.8 km. At the launch time, lidar measurements were not possible due to tropospheric clouds. Further details of the ground-based measurements are re-ported in Baumgarten et al. (2009).
3.2 Channels 1+ and 1−, ion and electron densities
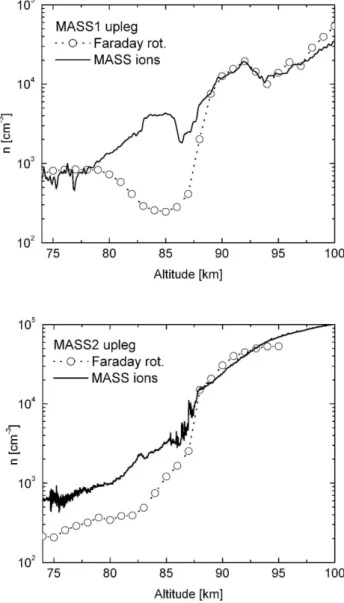
The Faraday rotation measurement, Fig. 5, provides electron density as well as a means of checking charge densities mea-sured by the MASS instrument. The Faraday rotation data show a bite-out in electron density in the altitude range 78– 90 km that is closely coincident with the PMSE indicating that the electrons have been scavenged by the aerosol parti-cles. The upper limit of the electron density bite-out closely agrees with that of the reflected power measured by the AL-WIN radar, the bite-out signature at the lower boundary of the radar echo at 81 km is less pronounced. This is primarily because of the uncertainty of the wave propagation electron densities at that height due to the large collision frequency (Friedrich et al., 2009). But also the normalization factor to convert the ion current to ion density is an extrapolation from higher altitudes and makes ion densities somewhat uncertain at 80 km. The electron densities during both MASS flights are about average considering solar zenith angle, season and concurrent riometer absorption. The large electron density bite-out occurs in about 20% of PMSE events (Blix et al., 2003).
Fig. 3.Upper panel: ALWIN radar data for the 15 min period nearest the launch of MASS1. Lower panel: ALWIN radar data for the 15 min period nearest the launch of MASS2.
negative ions, the positive ion density obtained from chan-nel 1+ of the MASS instrument should be equal to the elec-tron density from Faraday rotation. The data from channel 1+ for the lightest positive particles are plotted together with the electron density for 74–100 km in Fig. 5a. The densities are nearly equal from 90–100 km. The positive charge den-sity is found using the collection efficiency off=0.64 taken from the calculations made for NO+at 90 km. The NO+ion has been found to be the most abundant ion in this altitude range by rocket-borne mass spectrometers (e.g. Bragin and
Shamakhov, 1982; Krankowsky et al., 1987). Negative ions are negligible at these altitudes (e.g. Thomas and Bowman, 1985).
Fig. 4. Aerosol backscatter coefficients (green) measured by the ALOMAR RMR-Lidar during MASS1 (left panel) and MASS2 (right) panel from the lidar system looking close to the rocket tra-jectory. During MASS1 the integration time was reduced to 1 min, while during MASS2 14 min integration time was used to detect the weak NLC (note the different scaling on the abscissa). The red lines indicate the 1-sigma measurement uncertainty.
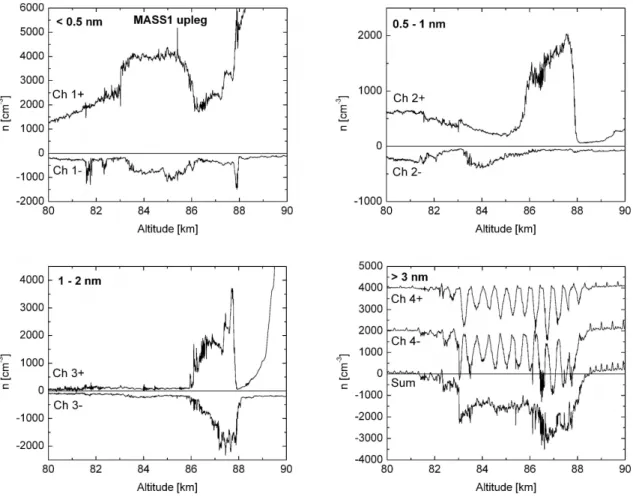
ions) are most affected by the rocket charging potential. The signal from channel 1−is small, indicating negative charge densities below∼1000 cm−3. Electron collection is clearly suppressed because there is negligible negative charge col-lection (≤500 cm−3)in the region 88–90 km where Faraday rotation indicates electron densities approaching 5000 cm−3. Channel 1+ collecting positive charge increases smoothly with altitude below 83 km and above 88 km. The region 83– 86 km shows a local enhancement and 86–88 km shows a local deficit relative to the smooth increase. The deficit at 86–88 km overlaps with an enhancement in positive charge density on the channels 2+ and 3+ for larger mass (note the different vertical scales) and together these data indicate a shift of the positive charge onto particles of greater mass at 86–88 km.
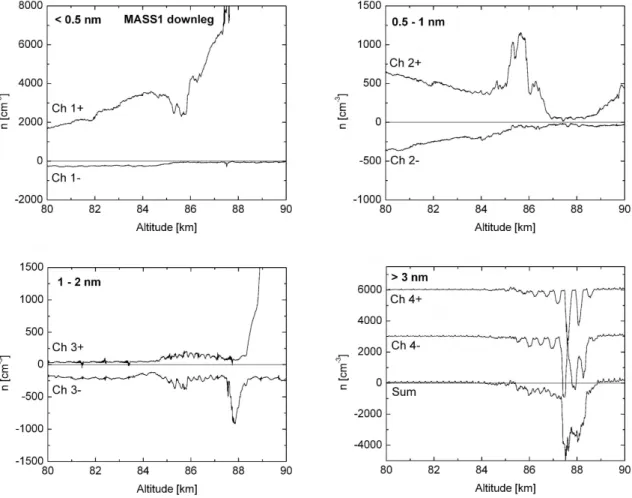
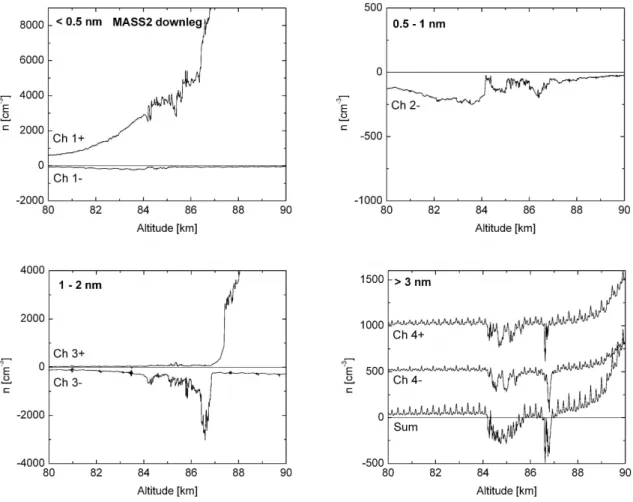
The downleg data for MASS1 are plotted in Fig. 7. Sig-nals identical to those on the upleg are not expected because the sampled volume at PMSE altitude is displaced horizon-tally by about 90 km from the volume sampled on the upleg and the PMSE was highly variable. Inspection of all MASS channels shows that the heaviest particles, channels 4, are seen in a more limited range (87–89 km) than on the upleg. For channel 1+ collecting positive charge, there is a smooth increase to a density of about 1.2×104cm−3which is compa-rable to the density recorded on the upleg. The signal shows a reduction in density at 85–86 km that is similar to the reduc-tion at 86–88 km seen on the upleg. Channel 1−shows only 200 cm−3, indicating that negative ions in the range 200– 900 amu (approximately) are nearly absent.
Fig. 5.The electron density from Faraday rotation for MASS1
(up-per panel) and MASS2 (lower panel) are plotted with the positive ion density indicated by MASS analyzer channel 1+ for the light-est positive particles. In the data analysis for the MASS channel, a collection efficiency of 0.64 is used from the simulations with−1 V payload potential for NO+ at 90 km.
3.3 Channels 2+ and 2−(0.5–1.0 nm, nominally)
Fig. 6.Data from the 8 channels of the MASS instrument for the upleg of the first flight. Channels 4+ and 4−are offset from zero for clarity and their sum is plotted correctly.
indication on channel 2−of a corresponding layer of nega-tive aerosol particles. However, there may be light neganega-tive ions (less than 200 amu, depending on altitude) that are not collected because of the payload charging potential.
On the downleg of MASS1, Fig. 7, channel 2+ shows a positive charge layer at 85–86 km with a peak density of about 1200 cm−3. Particles of this size were seen at 86– 88 km on the upleg. As on the upleg, channel 2−shows no structure indicating a negative charge layer.
3.4 Channels 3+ and 3−(1–2 nm, nominally)
Channels 3+ and 3− both indicate a charge layer span-ning 86–88 km on the upleg. The charge density is about 2000 cm−3 for both signs of charge. The signal for these channels turns off abruptly at the same altitude as the signals for channel 2+. The third pair of collecting plates has the largest bias potentials, ±54 V, which are the largest poten-tials in the instrument. The simultaneous occurrence of pos-itive and negative particles raises the question of enhanced coagulation of particles with opposite signs of charge. Jensen and Thomas (1991) have shown that this effect is small. The
channel collecting positive charge saturates at about 90 km altitude and remains saturated to about the same altitude on the downleg, Fig. 7. This saturation is probably due to a flux of positive ions through the air exit windows, which are covered by a screen mesh biased at−10 V. The mesh is de-signed to rebel electrons and collect light ions eliminating a collection of charged particles through the air exit windows (Knappmiller et al., 2008). However, the effective cross sec-tion of the collecting wires decreases with increasing tem-perature. This increases the probability that the ions will pass through the air exit windows and be collected by the 3+ channel above the mesopause.
Fig. 7.Data from the 8 channels of the MASS instrument for the downleg of the first flight. Channels 4+ and 4−are offset from zero for clarity and their sum is plotted correctly.
3.5 Channels 4+ and 4−(>3 nm, nominally)
The data from channels 4+ and 4− are shown both sepa-rately (with offsets) and summed in Fig. 6. The summa-tion removes modulasumma-tion at the rocket rotasumma-tion frequency. The charge number density has a maximum value near 3000 cm−3and the net charge is negative. There is an abrupt onset of particle collection at 83 km that is the location of the lowest peak in the radar data and the location of NLC seen in the lidar. The peak in the charge density at 86–88 km is near the peak at 88 km seen in the radar data and is near a secondary peak at 86 km seen in the lidar data. Particles with radii greater than 10 nm may be multiply charged so the num-ber density of particles may be less than the numnum-ber density of charge.
The signals from channels 4+ and 4−are oscillatory with a frequency of∼2 Hz and are out of phase. The rocket rotation frequency is 2 Hz, thus the oscillations are presumed to be caused by the incoming particles having a velocity vector that is not precisely aligned with the rocket axis. The origin of the modulation is likely to be a wind transverse to the rocket tra-jectory. The amplitude of the modulation of the signal by the
rocket rotation is approximately 100%. The stream of parti-cles entering the opening is 28 mm in width and the distance from the opening to the bottom plates is 44.7 cm. There is a 7 mm gap between the two plates, thus if the stream is unde-flected and remains 28 mm in width, 10.5 mm of the stream falls on each plate. A deflection of 10.5 mm is then suffi-cient to remove the signal from the plate and create a 100% modulation. This deflection is 2.3% of the instrument height, indicating that a wind transverse to the rocket trajectory of
∼23 m/s is sufficient to cause the modulation. This wind ve-locity is well within the range from ground-based measure-ments (Singer and Latteck, 2009).
these particles sufficiently to significantly modulate collec-tion. Thus the depth of the modulation indicates that these signals are primarily from particles with radii>7 nm. Small deflections are insufficient to separate particles with positive and negative charge, thus for channels 4 there may be posi-tively charged particles hidden by the signal from the more numerous negative particles.
Channels 4+ and 4−on the downleg of MASS1 are also shown in Fig. 7. As on the upleg, there is modulation of the signals by the rocket rotation. The negatively charged aerosols again fall about equally on the two bottom plates indicating a small deflection requiring radii >7 nm. The net charge number density reaches about−4000 cm−3from 87.5–88.5 km. On the upleg, these largest particles were de-tected over a wider range of altitudes, 82–88 km.
It is possible for neutral aerosol particles of ice to break into charged fragments and thereby create a false signal. Channels 4+ and 4−receive the heaviest charged particles as well as the undeflected neutral particles, thus for these plates the probability of spurious charge generation is greatest. If the neutral particles deposit negative charge on these plates, then fragments leaving the plates must carry an equal posi-tive charge that could be detected. Channels 3+ and 3−have the largest electrical bias (±54 V) and thus are most likely to collect spurious charge generated within the instrument. The flight data show signals from impacts of heavy charged aerosols on channels 4 with a sharp rise at 83 km. The sig-nals on channels 3 show no onset of signal until 86 km in-dicating that at least from 83 to 86 km the charge collected on the fourth pair of collection plates generates no charged fragments that are collected by the third pair of plates. For other channels, there is no consistent correlations between channels that would indicate spurious current generation.
4 MASS2 flight data
4.1 Launch conditions
MASS2 (NASA designation 41.070) was launched 6 August 2007 at 22:56:00 UTC and reached an apogee of 131.6 km. The rocket velocity dropped from 1077 m/s at 80 km to 985 m/s at 90 km. The solar zenith angle was 94.3 degrees. The ALWIN radar, Fig. 3b, showed PMSE extending from 83 to 89 km with a peak at 87 km. The ALOMAR RMR lidar, Fig. 4b, showed only a very weak scattering from aerosol particles with a peak backscatter coefficient of only 0.11±0.02×10⁻¹⁰(m sr)−1at 83 km which is about 40 times lower than the level used for statistical investigation of NLC (Fiedler et al., 2009).
4.2 Electron density
The Faraday rotation data for electron density, Fig. 5b, show a nearly monotonic increase with altitude and there is no in-dication of a bite-out as was observed on the first flight. From
88–95 km, the positive ion density is near to the electron den-sity. Faraday rotation data were not obtained above 95 km for MASS2. A significant difference between the MASS1 data and MASS2 data is the absence of a bite-out for MASS2. At 87 km the ALWIN radar peak coincides with the sharp change in the electron and ion density. The edges of the PMSE, however, do not coincide with any details in the elec-tron or ion densities. The discrepancies between elecelec-tron and ion densities below 87 km are again attributed to uncertainty of wave propagation due to a large collision frequency and the uncertainty in the collection efficiency of the ions.
4.3 Channels 1–4
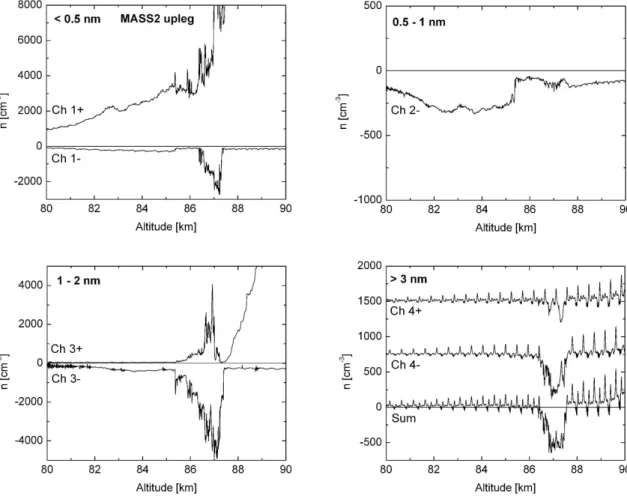
The MASS instruments channels for the upleg and downleg of MASS2 are shown in Figs. 8 and 9, respectively. Chan-nel 2+ gave zero signal during the entire flight indicating a malfunction. If the signal was lost from an open circuit to telemetry, the MASS instrument operated normally on the other channels. If the connection to the collection plate failed, then the bias voltage did not appear on the collection plate and the deflection of the particles was changed. The greatest deflection voltage is from the voltage on the third pair of deflection plates which operated normally, thus the signals on channels 3 and 4 would have only a small change in the range of detected mass if the−5.4 V bias on channel 2+ was absent. Channels 1+ and 1−gave signals which ap-pear to be unaffected.
Channel 1+ indicates above 87 km a smoothly increasing positive ion density that is consistent with electron densities from Faraday rotation (see Fig. 5). Near 87 km there is a su-perimposed charge layer that is incrementally∼5000 cm−3 (Fig. 8). The channel 1−data show a charge layer between 86 and 88 km. These are in the mass range 200–900 amu at 90 km if the payload potential is−1 V (see Table 1). The channel 2−data show negative aerosol particles similar in density to those seen by MASS1 and with a similar reduc-tion in density above 86 km. In the channel 3+ data, the number density is near 2000 cm−3with a narrow spike that reaches 4000 cm−3. The density of these positive particles falls abruptly at 87 km coincident with an abrupt rise from channel 1+ collecting the lightest positive particles, thus in-dicating a shift of positive charge to particles of lower mass. In the channel 3−data, the number density reaches a maxi-mum near 5000 cm−3, which is larger than the number seen in the NLC conditions of the first flight. These particles ex-tend to lower altitude than the larger >3 nm particles. A significant difference from MASS1 is the much lower den-sity of the largest particles recorded by channels 4+ and 4−,
Fig. 8.Data from 7 of the 8 channels of the MASS instrument for the upleg of the second flight. Channels 4+ and 4−are offset from zero and their sum is plotted correctly. Channels 4 appear noisy because the vertical scale spans a smaller range than in Figs. 6 and 7.
smaller particles are most likely responsible for the PMSE observed at the time of launch.
On the downleg, Fig. 9, the indications of charge layers are smaller in magnitude and vertical extent. Channel 1−for the lightest negative aerosol particles shows negligible signal. Channels 3−for particles nominally 1–2 nm shows a max-imum of∼3000 cm−3 in a narrow charge layer at 86.5 km. Channel 4−shows a much smaller number density similar to that seen on the upleg, but narrower in extent. Indications of positive charge layers are absent in Channel 1+. Channel 3+ saturates above∼88 km on the upleg and downleg of both flights, which is presumed to be “leakage” of ions into the instrument through the air exit windows.
5 Discussion
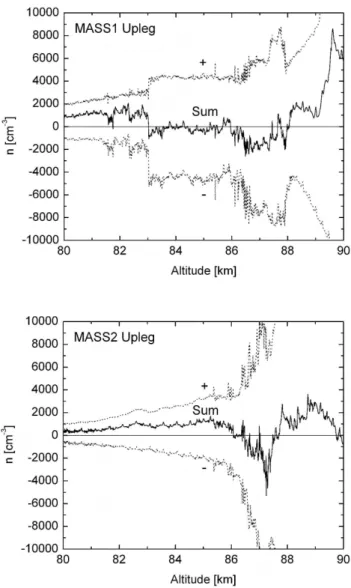
5.1 Quasineutrality check for MASS1 and MASS2
The sum of the charge densities from all MASS channels should be zero if all charged species are collected. The col-lection of electrons is prevented by the rocket potential. Thus a zero sum is only expected with the inclusion of the electron
Fig. 9.Data from 7 of the 8 channels of the MASS instrument for the downleg of the second flight. Channels 4+ and 4−are offset from zero and their sum is plotted correctly.
channel of the MASS instrument begins to saturate, possi-bly due to the collection of positive ions through the air exit windows. At this point, the sum of the signals diverges from quasineutrality.
In the MASS2 upleg the sum of all negative and posi-tive densities yields nearly a zero net charge collection until 86 km where the signal begins to go negative. The overall positive signal below 86 km is a result of the MASS2 instru-ment missing small negatively charged particles or from the Faraday rotation underestimating the electron density. The sum becoming negative at 86 km may be due to the missing channel 2+ signal which was significant in the cloud layer on the MASS1 flight. Above 89 km, the signal is again affected by the saturation of channel 3+.
5.2 Positive ions
Channel 1+ collects light molecular ions and cluster ions and thus the data from this channel should be consistent with pre-vious data from rocket-borne ion mass spectrometers. The instruments have shown that the dominant light ions are NO+ and O+2 in the absence of NLC (Kopp and Herrmann, 1984).
Depletion of positive ions has been observed within NLC (Balsiger et al., 1996) and is seen at 86–88 km in the Chan-nel 1+ data for the MASS1 upleg. In NLC conditions, a tran-sition height is observed at about 90 km (Kopp et al., 1985; Bj¨orn et al., 1985). Below this transition, the dominant pos-itive ions are the cluster ions H+(H2O)nwithn=1–20 being in the range detectable by the ion mass spectrometers. In the MASS1 data, there is a ledge at 88 km in channels 2–4 that we interpret to be this transition. The increase in the chan-nel 1+ signal at 88 km could be from the reappearance of molecular ions, however, this channel is also sensitive to the smaller cluster ions.
5.3 Negative species
Fig. 10. These plots show, for the upleg and downleg of MASS1 and MASS2, the sum of the channels with positive signals (+), the sum of the channels with negative signals (−), and the sum of all channels (sum). A zero sum is consistent with all charges having been collected, which is the nearly the case for MASS1 upleg from 83 to 86 km.
1982 as a part of the CAMP (Cold Arctic Mesopause Project) campaign. The mass cutoff could be scanned from 0 to 473 amu. The negative ions with mass below 100 amu were attributed to negative molecular ions. The small signals that are seen from 83–86 km on channel 1−may be due to the light negative ions seen previously by the negative ion mass spectrometer. The assumed negative rocket potential results in a mass threshold for the first channel that changes from
∼30 amu at 80 km to ∼200 amu at 90 km. Above 78 km, masses greater than 473 amu were dominant in the data from the negative ion mass spectrometer and it was suggested that these might be meteoric smoke particles. Mass analyzers de-termine only the charge-to-mass ratio and cannot distinguish
between NLC particles and smoke particles. Thus it is diffi-cult to unambiguously identify negative meteoric smoke par-ticles in NLC regions.
5.4 Positive charge on the smallest particles
The MASS instrument data show that the heaviest particles (seen by channels 4) have net negative charge. Channels 2 and 3 for lighter particles show that at 85–88 km positively charged particles are present (with the exception of MASS2 downleg data). In this section we discuss the processes and scenarios that can result in positive charge on the smallest particles and negative charge on the largest particles.
The measurement of significant numbers of positively charged aerosol particles of any size is unexpected from the theory of aerosol charging in plasma. In the absence of bite-out conditions, aerosol particles have a rate of electron at-tachment that is much higher than the rate of ion attach-ment. Aerosol particles below about 10 nm in radius primar-ily make transitions between havingZ=0 andZ=−1, where Zis the number of elementary charges. The low rate for ion collection relative to that for electrons results in the time in theZ=−1 state being orders of magnitude longer than the time in theZ=0 state, and the stateZ=+1 lifetime is negli-gible, relatively. For particles greater than 10 nm in radius, multiple charging is possible and the most probable charge is more negative thanZ=−1 (Rapp and L¨ubken, 2001). Thus the occurrence of positive charge layers must have an ex-planation outside the usual theoretical framework of charge equilibrium.
The first possibility is that the positive charge on small particles is due to suppressed electron collection. The charg-ing of aerosol particles by ion capture is possible under very strong bite-out conditions when essentially no free elec-trons are present to neutralize the positive charge (Rapp and L¨ubken, 2001). In the MASS1 data, however, there is an abundance of>3 nm negatively charged particles coexisting with the smaller positive ones. The ions are much more likely to attach to larger negative aerosol particles than to small neutral ones. Thus the size dependence of the observed charge distribution is not consistent with plasma charging.
The second possibility is enhancement of photoelectron emission. The photoelectron charging rate of a particle with radiusris calculated from
Rph(r)=π r2 Z
Q(r, λ)F (λ)Y (λ)dλ, (1)
1999). Vondrak et al. (2006a, b) have shown by laboratory experiments that a minor contamination of ice by Na can en-hance the photoelectric effect by orders of magnitude and re-duce the work function from 8.7 eV to about 2.3 eV. An upper estimate of the photoelectron emission rate can be calculated by including the solar spectrum up to λ=540 nm (2.3 eV) and choosing Y=1 for all wavelengths. The latter choice means that all photons with energy above the work function that interact with the particle will induce photoelectron emis-sion. Because of the small size parameter,α=2π r/λ≪1, the Rayleigh scattering cross section,
Q(r, α)=π r28 3α
4 m2−1 m2+2
!2
, (2)
is used in Eq. (1). Parameterm=1.31 is the refractive in-dex of water ice. The photoelectron emission rate calculated for a solar cycle minimum condition is Rph≈9×10⁻⁵s−1 forr=1 nm particle, which is much lower than the electron capture rate. The two charging rates become comparable atr=2 nm particle radius only with strong bite-out condi-tions in which 99% of the electrons attached to aerosol par-ticles. We conclude that photoelectron emission is likely not playing a significant role in the positive charge observed on small particles (channels 2+ and 3+) for the following rea-sons. First, the photoemission rate is too small to charge particles 1 nm or smaller in size, even with a lowering of the work function. Second, the Rayleigh scattering cross sec-tion increases strongly with size and the large particles rather than the small ones would be charged positively. Third, the number density of Na necessary to lower the work function is very small relative to the water vapor. This means that only a small fraction of 0.5–2 nm aerosol particles can be contam-inated by Na and have a lowered work function.
It has been reported that the yield of photoelectron emis-sion from nanometer sized particles may be increased by two orders of magnitude over the yield from a planar surface (Schmidt-Ott et al., 1980), however, this effect has been ex-plained as a plasmon resonance that occurs only for highly-conducting metallic particles and films (Tsang et al., 1991).
The third possibility for the positive particles is that the particles grew from positive condensation nuclei (Arnold, 1980; Turco et al., 1982; Sugiyama, 1994, 1995; Gumbel et al., 2003). In this case, small molecular ions or cluster ions act as the condensation nuclei. As the particles grow they are neutralized (Z=0) by electron capture and later charge neg-atively (Z=−1) by collecting an additional electron. This scenario can explain the occurrence of positively charged aerosol particles in the smallest size ranges and negative par-ticles at the largest sizes. The requirement for this to occur is that the positively charged particles have time to grow to the observed size (1–2 nm) before being neutralized. The growth rate for a highly supersaturated water vapor is given by
(Hes-Fig. 11.The size of the positive aerosol particle when it is
neutral-ized by capturing an electron as a function of electron density. The solid line for a charging model with only the Coulomb force and the dotted line is for a model with both the Coulomb force and the dipole force.
stvedt, 1969) ∂r
∂t ∼= F
ρ
m
2π kT 1/2
wP , (3)
whereF=0.83 is the condensation ratio for water vapor,ρis the specific weight of ice,mis the mass of water molecules, wis the water mixing ratio andP is the pressure at the al-titude of interest. The rate of electron capture by the singly charged positive particle is (Natanson, 1960)
Re(r)∼=π r2neve q2 4π ε0rkT
, (4)
whereneis the free electron density andve=√8kT /π meis the electron average speed. As the particle grows the proba-bility of capturing an electron is increasing. The characteris-tic neutralization timeτcan be calculated from the condition
τ Z
0
R (r (t )) dt=1. (5)
Fig. 12.SOFIE observations on 3 August 2007 nearest to the MASS1 flight, 20:35 UTC at 71.3◦N, 30.4◦E (left panel) and at 22:12 UTC at 71.3◦N, 6.3◦E (right panel). Horizontal dotted lines indicateZtop,Zmax, andZbotdetermined from H20(ice).
for the neutralized particle to continue to growth is that it have the critical radius for condensation (∼0.5 nm) (Megner and Gumbel, 2009; Gumbel and Megner, 2009). Figure 11 shows that positive nuclei can grow to critical size provided that there is a strong bite-out that reduces the electron density to about 100 cm−3. Additional modeling is needed to show that the transition from an initial state with high electron den-sity to one of low electron denden-sity can occur.
An alternate scenario for nucleation is that it occurs on me-teoritic smoke particles. Recent modeling of meteoric smoke production and circulation shows that the smoke particles are carried away from the summer pole by circulation (Megner et al., 2006, 2008; Bardeen et al., 2008). Models for con-densation require a minimum particle radius near 0.5 nm for typical conditions (Keesee, 1989; Megner et al., 2008; Gum-bel and Megner, 2009; Winkler et al., 2008). Circulation models indicate that nanometer-sized meteoric condensation nuclei are likely to have summer densities of order 1 cm−3 which is far too low to account for the charged fraction of
nanometer-sized particles observed by rocket-borne probes. Meteoritic particles should charge negatively because of the larger thermal velocity of electrons, thus if these were the condensation nuclei the smallest particles should have neg-ative charge and growth on these would not account for the observation of positively charged particles.
5.5 Photometer data and the altitude dependence of particle size
from∼81 to∼88 km. The cloud penetrated by the rocket showed three distinct peaks of comparable brightness, with the highest at∼86 km. This structure is thus broader than any NLC previously reported by in situ measurements. The photometer measurements on MASS2 showed no NLC at the point of passage. In addition to the exact altitude range of the NLC, the photometer measurement provides an optical anal-ysis of cloud particle sizes through the angular dependence of the scattering signal, i.e. the scattering phase function (Gum-bel and Witt, 2001). Results from this analysis are discussed by Megner et al. (2009).
5.6 Comparison with SOFIE limb scans
The SOFIE (Solar Occultation for Ice Experiment) instru-ment on the AIM satellite measures atmospheric extinction at eleven wavelengths from 0.330 to 5.01µm, in addition to temperature and the abundance of five gaseous species (O3, H2O, CO2, CH4, and NO) (Gordley et al., 2008). SOFIE multi-wavelength ice extinction measurements are used to determine ice mass density, particle shape, effective radius, and the parameters of a Gaussian particle size distribution (Hervig et al., 2009). The infrared ice extinction is propor-tional to the cube of the particle radius and is thus a direct measure of ice volume density. The field of view is 1.6 km vertically and 4.3 km horizontally, and the sample volume length is ∼290 km along the limb view. The two SOFIE limb scans nearest to MASS1 launch on 3 August were taken at 71.3◦N, 30.4◦E (20:35 UTC) and 71.3◦N, 6.3◦E (22:12 UTC), and the two nearest to the MASS2 launch on 6 August were taken at 72.0◦N, 22.6◦E (21:02 UTC) and 72.0◦N, 358.4◦E (22:39 UTC). SOFIE observations of wa-ter vapor and the gas phase equivalent H2O contained in the ice phase, H2O(ice), are shown in Fig. 12 for profiles near Andøya on 3 August, where altitudes of the ice layer top (Ztop), bottom (Zbot), and peak H2O(ice) (Zmax) are indicated. These observations indicate bright NLCs, with H2O(ice) from 5 to 6 ppmv. Ice particle effective radii ranged from 25–50 nm atZmax, with the largest particles occurring belowZmax. Existence of the largest ice particles belowZmax is consistent with the lidar observations of Baumgarten and Fiedler (2008). The 6 August observations (Fig. 13) indi-cate more tenuous NLCs than on 3 August, with less than
∼2 ppmv H2O contained in the ice phase. The ice extinc-tions on 6 August were too low to produce a useable signal in the near-infrared channels of the instrument, and thus par-ticle size could not be retrieved.
The SOFIE data and the rocket data are not within a com-mon volume, the PMSE data for the two dates are highly vari-able, and the data from the MASS instrument differs on upleg and downleg. Thus a comparison between the rocket data and SOFIE is only marginally justified. The MASS instrument data channels 4+ and 4−have signals from the largest ra-dius particles that are most responsible for extinction. These channels show on the upleg for 3 August the presence of ice
Fig. 13. SOFIE observations on 6 August 2007 nearest to the
MASS2 flight, 21:02 UTC at 72.0◦N, 22.6◦E (top graph) and 22:39 UTC, at 72.0◦N, 358.4◦E (bottom graph). Horizontal dot-ted lines indicateZtop,Zmax, andZbotdetermined from H20(ice).
particles with density∼3000 cm−3in the altitude range 83– 88 km which is near to the range of ice determined by optical extinction on the 22:12 UTC overpass.
6 Summary and conclusion
by positive ions or cluster ions being the condensation nu-clei and subsequent collection of electrons after growth to a radius of 1–2 nm. This scenario requires the reduction in electron density to∼100 cm−3in order to lengthen the time for positive charge to be neutralized by electron collection. A reduction of this order is observed in the data from the Faraday rotation instrument. Additional modeling including time-dependence of the aerosol particle charge is needed to show how the observed charge distribution could evolve from an initial state without the bite-out.
Acknowledgements. The authors acknowledge support from the Suborbital Program of the National Aeronautics and Space Admin-istration (NASA), the Wallops Flight Facility of NASA, the Andøya Rocket Range, and the Austrian Science Fund.
Topical Editor C. Jacobi thanks A. M. Zadorozhny and another anonymous referee for their help in evaluating this paper.
References
Amyx, K., Sternovsky, Z., Knappmiller, S., Robertson, S., Hor´anyi, M., and Gumbel, J.: In-situ measurement of smoke particles in the wintertime polar mesosphere between 80 and 85 km altitude, J. Atmos. Sol. Terr. Phys., 70, 61–70, 2008.
Andersson, P. U. and Pettersson, J. B. C.: Ionization of water clus-ters by collision with graphite surfaces, Z. Phys. D, 41, 57–62, 1997.
Arnold, F.: Ion-induced nucleation of atmospheric water vapor at the mesosphere, Planet. Space Sci., 28, 1003–1009, 1980. Balsiger, F., Kopp, E., Friedrich, M., Torkar, K. M., W¨alchi, U., and
Witt, G.: Positive ion depletion in a noctilucent cloud, Geophys. Res. Lett., 23(1), 93–96, 1996.
Bardeen, C. G., Toon, O. B., Jensen, E. J., Marsh, D. R., and Harvey, V. L.: Numerical simulations of the three-dimensional distribu-tion of meteoric dust in the mesosphere and upper stratosphere, J. Geophys. Res. 113, D17202, doi:10.1029/2007JD009515, 2008. Baumgarten, G. and Fiedler, J.: Vertical structure of particle proper-ties and water content in noctilucent clouds, Geophys. Res. Lett., 35, L10811, doi:10.1029/2007GL033084, 2008.
Baumgarten, G., Fiedler, J., L¨ubken, F.-J., and von Cossart, G.: Particle properties and water content of noctilucent clouds and their interannual variation, J. Geophys. Res., 113, D06203, doi:10.1029/2007JD008884, 2008.
Baumgarten, G., Fiedler, J., Fricke, K. H., Gerding, M., Hervig, M., Hoffmann, P., M¨uller, N., Pautet, P.-D., Rapp, M., Robert, C., Rusch, D., von Savigny, C., and Singer, W.: The noctilucent cloud (NLC) display during the ECOMA/MASS sounding rocket flights on 3 August 2007: morphology on global to local scales, Ann. Geophys., 27, 953–965, 2009,
http://www.ann-geophys.net/27/953/2009/.
Bird, G. A.: Molecular Gas Dynamics and the Direct simulation of Gas Flows, Oxford University Press, New York, 1994.
Bj¨orn, L. G., Kopp, E., Hermann, U., Eberhardt, P., Dickinson, P. H. G., Mackinnon, D. J., Arnold, F., Witt, G., Lundin, A., and Jenk-ins, D. B.: Heavy ionospheric ions in the formation process of noctilucent clouds, J. Geophys. Res., 90(D5), 7985–798l, 1985. Blix, T. A., Bekkeng, J. K., Latteck, R., L¨ubken, F.-J., Rapp,
M., Sch¨och, A., Singer, W., Smiley, B., and Strelnikov, B.:
Rocket probing of PMSE and NLC – Results from the recent MIDAS/MACWAVE campaign, Adv. Space Res., 31(9), 2061– 2067, 2003.
Bragin, Yu. A. and Shamakhov, B. F.: Direct studies of heavy pos-itive ions (1–2000 amu) in the upper mesosphere, Kosmicheskie Issledovaniya, 20, 644–645, 1982 (in Russian).
Croskey, C. L., Mitchell, J. D., Friedrich, M., Torkar, K. M., Hoppe, U.-P., and Goldberg, R. A.: Electrical structure of PMSE and NLC regions during the DROPPS program, Geophys. Res. Lett., 28, 1427–1430, 2001.
Croskey, C. L., Mitchell, J. D., Goldberg, R. A., Blix, T. A., Rapp, M., Latteck, R., Friedrich, M., and Smiley, B.: Coordi-nated investigation of plasma and neutral density fluctuations and particles during the MacWAVE/MIDAS summer 2002 program, Geophys. Res. Lett., 31, L24S08, doi:10.1029/2004GL020169, 2004.
DeLand, M. T., Shettle, E. P., Thomas, G. E., and Olivero, J. J.: A quarter-century of satellite polar mesospheric cloud observa-tions, J. Atmos. Sol. Terr. Phys., 68, 9–29, 2006.
Dushman, S.: Scientific Foundations of Vacuum Technique, Wiley, New York, second edition, 1962.
Fiedler, J., Baumgarten, G., and Lubken, F.-J.: NLC observations during one solar cycle above ALOMAR, J. Atmos. Sol. Terr. Phys., doi:10.1016/j.jastp.2008.11.010, in press, 2009.
Feuerbacher, B. and Fitton, B.: Experimental investigation of pho-toemission from satellite surface materials, J. Appl. Phys., 43, 1563–1572, 1972.
Friedrich, M., Torkar, K. M., Goldberg, R. A., Mitchell, J. D., Croskey, C. L., and Lehmacher, G.: Comparison of plasma probes in the lower ionosphere, Proc. 13th ESA Symposium on European Rocket and Balloon Programmes and Related Re-search, ESA SP-397, 381–386, 1997.
Friedrich, M., Torkar, K. M., Singer, W., Strelnikova, I., Rapp, M., and Robertson, S.: Signatures of mesospheric particles in iono-spheric data, Ann. Geophys., 27, 823–829, 2009,
http://www.ann-geophys.net/27/823/2009/.
Gelinas, L. J., Lynch, K. A., Kelley, M. C., Collins, S., Baker, S., Zhou, Q., and Friedman, J. S.: First observation of meteoric charged dust in the tropical mesosphere, Geophys. Res. Lett., 25, 4047–4050, 1998,
Goertz, C. K.: Dusty plasmas in the solar system, Rev. Geophys., 27(2), 271–292, 1989.
Gordley, L. L., Hervig, M. E., Fish, C., Russell, J. M., Bailey, S., Cook, J., Hansen, S., Shumway, A., Paxton, G., Deaver, L., Mar-shall, T., Burton, J., Magill, B., Brown, C., Thompson, E., and Kemp, J.: The solar occultation for ice experiment, J. Atmos. Sol. Terr. Phys., doi:10.1016/j.jastp.2008.07.012, in press, 2008. Gumbel, J.: Aerodynamic influences on atmospheric in situ mea-surements from sounding rockets, J. Geophys. Res., 106(A6), 10553–10563, 2001.
Gumbel, J. and Megner, L.: Charged meteoric smoke as ice nuclei in the mesosphere: Part 1 – A review of basic concepts, J. Atmos. Sol. Terr. Phys., submitted, 2009.
Gumbel, J. and Witt, G.: Rocket-borne photometry of NLC particle populations, Adv. Space Res., 28(7), 1053–1058, 2001. Gumbel, J., Stegman, J., Murtagh, D. P., and Witt, G.: Scattering
phase functions and particle sizes in noctilucent clouds, Geo-phys. Res. Lett., 28(8), 1415–1418, 2001.
M.: Influences of ice particles on the ion chemistry of the polar summer mesosphere, J. Geophys. Res., 108(D8), 8436, doi:10.1029/2002JD002413, 2003.
Havnes, O. and Næsheim, L. I.: On the secondary charging effects and structure of mesospheric dust particles impacting on rocket probes, Ann. Geophys., 25, 623–637, 2007,
http://www.ann-geophys.net/25/623/2007/.
Havnes, O., de Angelis, U., Bingham, R., Goertz, C. K., Morfill, G. E., and Tsytovich, V.: On the role of dust in the summer mesopause, J. Atmos. Sol. Terr. Phys., 52, 637–643, 1990. Havnes, O., Trøim, J., Blix, T., Mortensen, W., Næsheim, L. I.,
Thrane, E., and Tønneson, T.: First detection of charged dust par-ticles in the Earth’s mesosphere, J. Geophys. Res., 101, 10839– 10847, 1996.
Hedin, J., Gumbel, J., and Rapp, M.: On the efficiency of rocket-borne particle detection in the mesosphere, Atmos. Chem. Phys., 7, 3701–3711, 2007,
http://www.atmos-chem-phys.net/7/3701/2007/.
Hervig, M. E., Gordley, L. L., Stevens, M. H., Russell, J. M., Bai-ley, S. M., and Baumgarten, G.: Interpretation of SOFIE PMC measurements: Cloud identification and derivation of mass den-sity, particle shape, and particle size, J. Atmos. Sol. Terr. Phys., doi:10.1016/j.jastp.2008.07.009, in press, 2009.
Hesstvedt, E.: Nucleation and growth of noctilucent cloud particles, Space Res., 9, 170–174, 1969.
Hoffmann, P., Rapp, M., Serafimovich, A., and Latteck, R.: On the occurrence and formation of multiple layers of polar mesosphere summer echoes, Geophys. Res. Lett., 32, L05812, doi:10.1029/2004GL021409, 2005.
Holzworth, R. H. and Goldberg, R. A.: Electric field measure-ments in noctilucent clouds, J. Geophys. Res., 109, D16203, doi:10.1029/2003JD004468, 2004.
Hunten, D. M., Turco, R. P., and Toon, O. B.: Smoke and dust particles of meteoric origin in the mesosphere and stratosphere, J. Atmos. Sci., 37, 1342–1357, 1980.
Jacobsen, T. A. and Friedrich, M.: Electron density measurements in the lower D-region, J. Atmos. Terr. Phys., 41, 1195–1200, 1979.
Jensen, E. and Thomas, G. E.: Charging of mesospheric particles: implications of electron density and particle coagulation, J. Geo-phys. Res., 96, 18603–18615, 1991.
Keesee, R. G.: Nucleation and particle formation in the upper at-mosphere, J. Geophys. Res., 94, 14683–14692, 1989
Knappmiller, S., Sternovsky, Z., Robertson, S., and Friedrich, M.: A rocket-borne mass analyzer for charged aerosol par-ticles in the mesosphere, Rev. Sci. Instrum., 79, 104502, doi:10.1063/1.2999580, 2008.
Kopp, E. and Herrmann, U.: Ion composition in the lower iono-sphere, Ann. Geophys., 2(1), 83–94, 1984.
Kopp, E., Eberhardt, P., Herrmann, U., and Bj¨orn, L. G.: Postive ion composition of the high-latitude summer D region with noc-tilucent clouds, J. Geophys. Res., 90, 13041–13053, 1985. Krankowsky, D., L¨ammerzahl, P., G¨otzelmann, A., Friedrich, M.,
and Torkar, K. M.: Positive ion composition in the lower iono-sphere at high latitudes during MAP/WINE, J. Atmos. Terr. Phys.. 49(7/8), 809–818, 1987.
Latteck, R., Singer, W., and Bardey, H.: The ALWIN MST radar – Technical design and performances, in: Proceedings of the 14th ESA Symposium on European Rocket and Ballon Programmes
and Related Research, ESA SP-437, 179–184, 1999.
L¨ubken, F.-J.: Thermal structure of the arctic summer mesosphere, J. Geophys. Res., 104, 9135–9149, 1999.
Megner, L. and Gumbel, J.: Charged meteoric particles as ice nuclei in the mesosphere: Part 2 – A feasibility study, J. Atmos. Sol. Terr. Phys., submitted, 2009.
Megner, L., Rapp, M., and Gumbel, J.: Distribution of meteoric smoke – sensitivity to microphysical properties and atmospheric conditions, Atmos. Chem. Phys., 6, 4415–4426, 2006,
http://www.atmos-chem-phys.net/6/4415/2006/.
Megner, L., Gumbel, J., Rapp, M., and Siskind, D. E.: Reduced meteoric smoke particle density at the summer pole – Implica-tions for mesospheric ice particle nucleation, Adv. Space Res., 41, 41–49, 2008.
Megner, L., Khaplanov, M., Baumgarten, G., Gumbel, J., Stegman, J., Strelnikov, B., and Robertson, S.: Large mesospheric ice par-ticles at exceptionally high altitudes, Ann. Geophys., 27, 943– 951, 2009, http://www.ann-geophys.net/27/943/2009/.
Natanson, G. L.: On the theory of charging of a microscopic aerosol particles as a result of capture of gas ions, Zh. Tekh. Fiz., 30(5), 573–588, 1960 (English Translation: Sov. Phys. Tech. Phys. 5, 538–551, 1960).
Pedersen, A., Tr¨oim, J., and Kane, J. A.: Rocket measurements showing removal of electrons above the mesopause in summer at high latitude, Planet. Space Sci., 18, 945–947, 1970.
Rapp, M. and L¨ubken, F.-J.: Modelling of positively charged aerosols in the polar summer mesopause region, Earth Planets Space, 51, 799–807, 1999.
Rapp, M. and L¨ubken, F.-J.: Modelling of particle charging in the polar summer mesosphere: Part 1 – General results, J. Atmos. Sol. Terr. Phys., 63, 759–770, 2001.
Rapp, M. and L¨ubken, F.-J.: Polar mesosphere summer echoes (PMSE): Review of observations and current understanding, At-mos. Chem. Phys., 4, 2601–2633, 2004,
http://www.atmos-chem-phys.net/4/2601/2004/.
Rapp, M. and Strelnikova, I.: Measurements of meteor smoke particles during the ECOMA-2006 campaign: 1. Particle de-tection by active photoionization, J. Atmos. Sol. Terr. Phys., doi:10.1016/j.jastp.2008.06.002, in press, 2008.
Rapp, M., Hedin, J., Strelnikova, I., Friedrich, M., Gumbel, J., and L¨ubken, F.-J.: Observations of positively charged nanoparti-cles in the nighttime polar mesosphere, Geophys. Res. Lett., 32, L23821, doi:10.1029/2005GL024676, 2005.
Rapp, M., Strelnikova, I., Strelnikov, B., Latteck, R., Baumgarten, G., Li, Q., Megner, L., Gumbel, J., Friedrich, M., Hoppe, U.-P., and Robertson, S.: First in situ measurement of the vertical distribution of ice volume in a mesospheric ice cloud during the ECOMA/MASS rocket-campaign, Ann. Geophys., 27, 755–766, 2009, http://www.ann-geophys.net/27/755/2009/.
Robertson, S. and Sternovsky, Z.: Effect of the induced-dipole force on the charging of aerosol particles, Phys. Plasmas, 15, 040702, doi:10.1063/1.2907162, 2008.
Robertson, S., Smiley, B., Hor´anyi, M., Sternovsky, Z., Gumbel, J., and Stegman, J.: Rocket-borne probes for charged ionospheric aerosol particles, IEEE Trans. Plasma Sci., 32, 716–723, 2004. Russell III, J. M., Bailey, S. M., Hor´anyi, M., Gordley, L. L., Rusch,
Ice in the Mesosphere (AIM): Overview and early science re-sults, J. Atmos. Sol. Terr. Phys., in press, 2008.
Schmidt-Ott, A., Schurtenberger, P., and Siegman, H. C.: Enormous yield of photoelectron emission from small particles, Phys. Rev. Lett., 45, 1284–1287, 1980.
Schulte, P. and Arnold, F.: Detection of upper atmospheric nega-tively charged microclusters by a rocket-borne mass spectrome-ter, Geophys. Res. Lett., 19(23), 2297–2300, 1992.
Smiley, B., Robertson, S., Hor´anyi, M., Blix, T., Rapp, M., Latteck, R., and Gumbel, J.: Measurement of posi-tively and negaposi-tively charged particles inside PMSEs during MIDAS/SOLSTICE 2001, J. Geophys. Res. 108(D8) 8444, doi:10.1029/2002JD002425, 2003.
Sternovsky, Z., Hor´anyi, M., and Robertson, S.: Collision cross sections of small water clusters, Phys. Rev. A, 64, 023203, doi:10.1103/PhysRevA.64.023203, 2001.
Strelnikova, I., Rapp, M., Strelnikov, B., Baumgarten, G., Brattli, A., Svenes, K., Hoppe, U.-P., Friedrich, M., Gumbel, J., and Williams, B. P.: Measurements of meteor smoke particles dur-ing the ECOMA-2006 campaign: 2. results, J. Atmos. Sol. Terr. Phys., doi:10.1016/j.jastp.2008.07.011, in press, 2009.
Sugiyama, T.: Ion recombination and growth of ice particles in noc-tilucent clouds, J. Geophys. Res. 99(A3), 3915–3929, 1994. Sugiyama, T.: Ionic nucleation of ice particles in noctilucent clouds,
in: The Upper Mesosphere and Lower Thermosphere: A Review of Experiment and Theory, Geophysical Monograph, 87, Ameri-can Geophysical Union, Washington, D.C., 209–214, 1995. Thomas, L. and Bowman, M. R.: Model studies of the D-region
negative-ion composition during day-time and night-time, J. At-mos. Sol. Terr. Phys., 47, 547–556, 1985.
Tsang, T., Srinivasan-Rao, T., and Fischer, J.: Surface-plasmon field-enhanced multiphoton photoelectric emission from metal films, Phys. Rev. B, 43(11), 8870–8878, 1991.
Turco, R. P., Toon, O. B., Whitten, R. C., Keesee, R. G., and Hol-lenbach, D.: Noctilucent clouds: Simulation studies of their gen-esis properties and global influences, Planet. Space Sci., 30(11), 1147–1181, 1982.
Ulwick, J. C., Baker, K. D., Kelley, M. C., Balsley, B. B., and Ecklund, W. L.: Comparison of simultaneous MST radar and electron density probe measurements during STATE, J. Geophys. Res., 93(D6), 6989–7000, 1988.
Viehland, L. A. and Mason, E. A.: Transport Properties of gaseous ions over a wide energy range: IV, Atomic Data and Nuclear Data Tables, 60, 37–95, 1995.
von Cossart, G., Fiedler, J., and von Zahn, U.: Size distributions of NLC particles as determined from 3-color observations of NLC by ground-based lidar, Geophys. Res. Lett., 26(11), 1513–1516, 1999.
von Zahn, U., von Cossart, G., Fiedler, J., Fricke, K. H., Nelke, G., Baumgarten, G., Rees, D., Hauchecorne, A., and Adolfsen, K.: The ALOMAR Rayleigh/Mie/Raman lidar: objectives, configu-ration, and performance, Ann. Geophys., 18, 815–833, 2000, http://www.ann-geophys.net/18/815/2000/.
Vondrak, T., Plane, J. M. C., and Meech, S. R.: Photoemission from sodium on ice: A mechanism for positive and negative charge coexistence in the mesosphere, J. Phys. Chem. B, 110, 3860– 3863, 2006a.
Vondrak, T., Plane, J. M. C., and Meech, S. R.: Influence of submonolayer sodium adsorption on the photoemission of the Cu(111)/water ice surface, J. Chem. Phys., 125, 224702, doi:10.1063/1.2397675, 2006b.
Vostrikov, A. A., Dubov, D. Yu., and Predtechenskiy, M. R.: Ion-ization of water clusters by surface collision, Chem. Phys. Lett. 139, 124–128, 1987.
Vostrikov, A. A., Dubov, D. Yu., and Predtechenskii, M. R.: For-mation of charged particles in collisions of water clusters with a surface, Sov. Phys. Tech. Phys. 33, 1153–1158, 1988.
Vostrikov, A. A., Zadorozhny, A. M., Dubov, D. Yu., Witt, G., Kaza-kova, I. V., Bragin, O. A., Kazakov, V. G., Kikhtenko, V. N., Tyutin, A. A.: Ionization of water clusters by collision with sur-face, Z. Phys. D, 40, 542–545, 1997.
Winkler, P. M., Steiner, G., Vrtala, A., Vehkam¨aki, H., Noppel, M., Lehtinen, K. E. J., Reischl, G. P., Wagner, P. E., and Kul-mala, M.: Heterogeneous nucleation experiments bridging the scale from molecular ion clusters to nanoparticles, Science, 319, 1374–1377, 2008.