ACPD
11, 11911–11937, 2011Analysis of the formation of fog and
haze in North China Plain (NCP)
J. Quan et al.
Title Page
Abstract Introduction
Conclusions References
Tables Figures
◭ ◮
◭ ◮
Back Close
Full Screen / Esc
Printer-friendly Version
Interactive Discussion
Discussion
P
a
per
|
Dis
cussion
P
a
per
|
Discussion
P
a
per
|
Discussio
n
P
a
per
|
Atmos. Chem. Phys. Discuss., 11, 11911–11937, 2011 www.atmos-chem-phys-discuss.net/11/11911/2011/ doi:10.5194/acpd-11-11911-2011
© Author(s) 2011. CC Attribution 3.0 License.
Atmospheric Chemistry and Physics Discussions
This discussion paper is/has been under review for the journal Atmospheric Chemistry and Physics (ACP). Please refer to the corresponding final paper in ACP if available.
Analysis of the formation of fog and haze
in North China Plain (NCP)
J. Quan1,2, Q. Zhang1, H. He1, J. Liu1, M. Huang1, and H. Jin1
1
Beijing Weather Modification Office, Beijing, China
2
Institude of Urban Meteorology, CMA, Beijing, China
Received: 14 March 2011 – Accepted: 19 March 2011 – Published: 18 April 2011
Correspondence to: Q. Zhang (zqxxm [email protected])
ACPD
11, 11911–11937, 2011Analysis of the formation of fog and
haze in North China Plain (NCP)
J. Quan et al.
Title Page
Abstract Introduction
Conclusions References
Tables Figures
◭ ◮
◭ ◮
Back Close
Full Screen / Esc
Printer-friendly Version
Interactive Discussion
Discussion
P
a
per
|
Dis
cussion
P
a
per
|
Discussion
P
a
per
|
Discussio
n
P
a
per
|
Abstract
North China Plain (NCP) is one of the most populated and polluted regions in China. During the recent years, haze and fog occur frequently and cause severely low visibility in this region. In order to better understand the impact of aerosol particles on the formation of haze and fog, a long-term record of haze and fog occurrences in the past
5
56 years (from 1954–2009) over NCP is analyzed. The results show that there are rapid changes in the occurrences of haze and fog over NCP. The occurrences of haze and fog were low during 1970–1980, and reached a maximum during 1981–1998. After 1999, the occurrences of haze and fog slightly decreased. There was a nonlinear relationship between the occurrences of haze and fog. When the occurrence of haze was lower
10
than 40 days yr−1, the occurrence of fog was strongly proportional to the occurrence of haze. However, when the occurrence of haze was high (larger than 75 days yr−1), the occurrence of fog was not sensitive to the occurrence of haze. In order to better understand the relationship between the occurrences of haze and fog as well as the effect of aerosol particles on the formation of haze and fog, an in-situ field experiment
15
was conducted during a period with a mixed occurrence of haze and fog. The analysis of the experiment suggests that there were considerably high aerosol concentrations during the measurement period, with an averaged aerosol number concentration of 24 000 cm−3. The measurement also shows that a large amount of aerosol particles can act as condensation nuclei to enhance the formation of fog droplets. As a result,
20
a large amount of fog droplets (>1000 cm−3
) with small size in radius (5–6 µm) were observed during the fog period, resulting in extremely low visibility (less than 100 m).
1 Introduction
North China Plain (NCP) is located in northern coast China, and is surrounded by Taihang Mountains (at the west of NCP), Yanshan Mountains (at the north of NCP),
25
ACPD
11, 11911–11937, 2011Analysis of the formation of fog and
haze in North China Plain (NCP)
J. Quan et al.
Title Page
Abstract Introduction
Conclusions References
Tables Figures
◭ ◮
◭ ◮
Back Close
Full Screen / Esc
Printer-friendly Version
Interactive Discussion
Discussion
P
a
per
|
Dis
cussion
P
a
per
|
Discussion
P
a
per
|
Discussio
n
P
a
per
|
polluted regions in China. During the recent years, the rapid economical development has resulted in heavy atmospheric aerosol loadings in this region (Bian et al., 2007; Han et al., 2009; Tie et al., 2009; Zhang et al., 2006). The high aerosol concentrations induce severely environmental and climate problems. For example, aerosols have a direct effect for radiative forcing because they scatter (Charlson et al., 1987, 1992;
5
Tegen et al., 2000) and absorb (Ramanathan and Vogelmann, 1997; Ramanathan et al., 2001; Jacobson, 2001) solar and infrared radiation in the atmosphere. In addition to the climate effect, aerosols also affect human health and visibility (Tie et al., 2009; Wu et al., 2005; Deng et al., 2008). Moreover, aerosol particles can act as cloud condensation nuclei (CCN) to affect the formation of cloud and fog.
10
In this study, a long-term trend of haze and fog (from 1954 to 2009) in the NCP region is analyzed. In addition to the trend analysis, a field experiment was conducted during an extreme low visibility period (from 5 November to 8 November 2008) in NCP. In order to better understand the characteristics of haze and fog in the NCP region, meteorological parameters, the size distributions and number concentrations of aerosol
15
particles and fog droplets were simultaneously measured during the experiment. Both the trend data and the experiment result provide valuable information to study several important characteristics of haze and fog, including; (1) the evolution of haze and fog occurrences in the past 56 years; (2) the relationship between the occurrences of haze and fog; (3) the impact of aerosol particles on the formation of haze and fog; and (4) the
20
impact of haze and fog on visibility.
The paper is organized as the following way. In Sect. 2, we show the analysis of the long-term haze and fog trends. In Sect. 3, we describe the field experiment, including the instruments and the results of the experiment.
2 A long-term trend of haze and fog in NCP 25
ACPD
11, 11911–11937, 2011Analysis of the formation of fog and
haze in North China Plain (NCP)
J. Quan et al.
Title Page
Abstract Introduction
Conclusions References
Tables Figures
◭ ◮
◭ ◮
Back Close
Full Screen / Esc
Printer-friendly Version
Interactive Discussion
Discussion
P
a
per
|
Dis
cussion
P
a
per
|
Discussion
P
a
per
|
Discussio
n
P
a
per
|
the observations of visibility and relative humidity (RH) and the method suggested by Vautard et al. (2009) and Wu (2006). According to their suggestion, haze events occur when the following conditions are satisfied, i.e., visibility≤5 km and RH<95%. Under such conditions, the concentrations of aerosol particles, especially fine particles, are generally high (Deng et al., 2008). For the occurrence of fog, the following conditions
5
need to be satisfied, i.e., visibility≤2 km and RH≥95%. They also explain that the current instruments of RH have at least 5% low-bias to accurately measure the value of RH when the value of RH≥95%. As a result, the≥95% measurement of RH often
implies that the saturation of water vapors (RH≥100%) may occur in the atmosphere. Based on the above definitions, a long-term record of haze and fog occurrences are
10
obtained in 16 measurement stations in the NCP region (see Fig. 1). These 16 mea-surement sites are classified into 8 urban and 8 rural sites (see Fig. 2). In general, the urban sites are located inside cities with higher aerosol emissions, and the rural sites are located outside of cities with lower aerosol emissions.
Figure 2 shows that the long-term variations of haze and fog occurrences between
15
the urban and the rural sites were very different, mainly resulting from the different situations of economical development in different sites. For these urban sites (Beijing, – BJ, Shijiazhuang – SJZ, Baoding – BD, and Jinan – JN), they are located in relatively large cities, and the rapid economical development started from the late 1970s. As a result, there was a rapid increase in the occurrence of haze (OHAZ) from the late
20
of 1970s to the early of 2000s. During this period, OHAZ increased from 20–50 to 150–200 days yr−1. At the Tanggu (TG) site (urban), the increase of OHAZ occurred from the early 2000s (when this region became a special economical zone) to the present, indicating that the timing of economical development plays important roles for OHAZ. Other urban sites (Xingtai – XT, Weihai – WH, and Langfang – LF) are located
25
ACPD
11, 11911–11937, 2011Analysis of the formation of fog and
haze in North China Plain (NCP)
J. Quan et al.
Title Page
Abstract Introduction
Conclusions References
Tables Figures
◭ ◮
◭ ◮
Back Close
Full Screen / Esc
Printer-friendly Version
Interactive Discussion
Discussion
P
a
per
|
Dis
cussion
P
a
per
|
Discussion
P
a
per
|
Discussio
n
P
a
per
|
On average, the evolution of OHAZ at the urban sites can be categorized to 4 pe-riods (shown in Fig. 3). Between 1954 and 1970, the OHAZ days were very low (31.3±22.9 days yr−1), indicating that there was generally good visibility over NCP during this period. This period is defined as period-1. Between 1971 and 1980, the OHAZ days rapidly increased, reaching to 103.3±90.2 days yr−1 in 1980. This
5
is a transition period from good visibility to poor visibility in NCP, which is defined as period-2. Between 1981 and 1998, the OHAZ days remained in a constant high value (100.5±78.1 days yr−1), which is defined as period-3. Finally, between 1999 and 2009, the OHAZ days slowly decreased, falling to 52.3±28.8 days yr−1in 2009, which is de-fined as period-4.
10
The OHAZ days at the rural sites were lower than the values at the urban sites and had a time lag compared to the evolution at the urban sites. For example, before 1980, the OHAZ days remained in a constant value (18.9±8.7 days yr−1), which was lower
than values at the urban sites (38.8±30.7 days yr−1). At the rural sites, the OHAZ
days started to increase in 1980s rather than 1970s at the urban sites. For example,
15
between 1980 and 1985, the OHAZ days increased from 30.2±17.8 to 65.1±22.5
days/year. After 1985, the OHAZ days remained 52.3±25.3 days yr−1.
Previous studies suggested that OHAZ is closely correlated to the concentrations of aerosol particles. For example, according to the study by Deng et al. (2008), the aerosol particle concentrations in large cities of China increased rapidly from 1970s,
20
and the rapid increase in aerosol particles produced the increase in the OHAZ days. Because part of aerosol particles can also act as condensation nuclei of fog droplets, therefore the increase of aerosol particles concentration could affect of the microphys-ical characteristic of fog droplets.
Figure 3 shows also the evolution of the occurrence of fog (OFOG) days at both
25
ACPD
11, 11911–11937, 2011Analysis of the formation of fog and
haze in North China Plain (NCP)
J. Quan et al.
Title Page
Abstract Introduction
Conclusions References
Tables Figures
◭ ◮
◭ ◮
Back Close
Full Screen / Esc
Printer-friendly Version
Interactive Discussion
Discussion
P
a
per
|
Dis
cussion
P
a
per
|
Discussion
P
a
per
|
Discussio
n
P
a
per
|
remained in a constant high value (12.5±6.3 days yr−1). Finally, between 2003 and 2009, the OFOG days decreased slowly, falling to 7.6±5.6 days yr−1 in 2009. The
OFOG days at rural sites were similar to the evolution at the urban sites, excepting that there was no decreasing tendency after 2003. Figure 3 illustrates that there is a similarity between the trends of OHAZ and OFOG, showing the influence of aerosol
5
particles to the formation of both haze and fog.
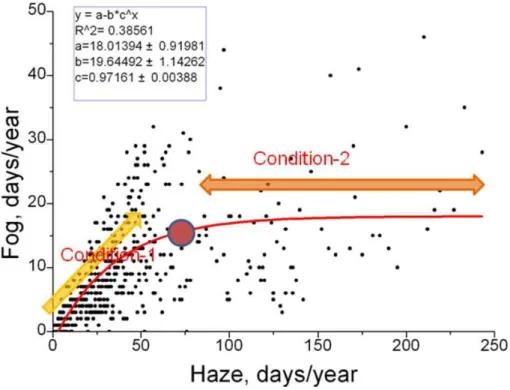
The detailed relationship between OHAZ and OFOG shows in Fig. 4. The result indicates that there was a nonlinearity relationship between the OHAZ and OFOG days. When the OHAZ days are lower than 75 days yr−1 (a crucial value), the OFOG days are strongly dependent upon the OHAZ days, suggesting a strong impact of aerosol
10
particles on the formation of fog (Condition-1). When the OHAZ days exceed to this crucial value, the OFOG days are not sensitive to the OHAZ days.
This analysis shows that aerosol particles may have important impacts on both the haze and fog formation, leading to change in the visibility over NCP. However, the above analysis only highlights a statistical result. The detailed physical processes
15
which control the interaction between aerosol particles and the OHAZ/OFOG days cannot be provided by the above analysis. In order to better understand the detailed information regarding the impact of aerosol particles on the formation of haze and fog, a field measurement was conducted and the results are analyzed.
3 Analysis of experiment (a case study) 20
3.1 Instruments of the experiment
Several instruments were deployed during the field experiment at Wuqing (WQ) (39.4◦lat and 117.05◦lon), which is located in the NCP between the two Megacities of Beijing and Tianjin. The field study, focusing on microphysical characteristics of aerosol particles and fog droplets, were carried out from November to December 2009. The
25
ACPD
11, 11911–11937, 2011Analysis of the formation of fog and
haze in North China Plain (NCP)
J. Quan et al.
Title Page
Abstract Introduction
Conclusions References
Tables Figures
◭ ◮
◭ ◮
Back Close
Full Screen / Esc
Printer-friendly Version
Interactive Discussion
Discussion
P
a
per
|
Dis
cussion
P
a
per
|
Discussion
P
a
per
|
Discussio
n
P
a
per
|
meteorological parameters (ambient air temperature –T, relative humidity – RH, and air pressure –P), and visibility.
The ambient aerosol sample passes through a silica gel diffusion drier, maintain-ing a relative humidity (RH) below 40%. The aerosol sample is then led into the air-conditioned measurement container with a temperature around 20◦C. For fog droplet,
5
it is observed at ambient atmosphere.
The aerosol number distribution in different size bins (10–662 nm) were obtained by a Scanning Mobility Particle Sizer (SMPS, Model 3936, TSI, USA) with a time resolu-tion of five minutes. The SMPS consist mainly of Differential Mobility Analyzer (DMA, Model 3081) and Condensation Particle Counter (CPC, Model 3772). The DMA sheath
10
and sample flows were 3 lpm and 0.3 lpm, respectively.
Fog number size distributions (2–32 µm) were obtained by Droplet Measurement Technology (DMT) of fog measuring device (FMD; FM-100). The LWC of fog is calcu-lated on the volume concentration of fog droplets observed by FM-100. The structure of fog is obtained by Microwave radiometers (MP-3000A) from Radiometrics Corporation.
15
3.2 Background of meteorological conditions during experiment
A dense fog/haze event occurred over the NCP region between 5 November and 8 November 2009, producing extremely poor visibility. The measured data during this event is intensively studied (as a case study). During the event, both fog and haze occurred, and a cascade formation of fog appeared. Based on the durations of fog
20
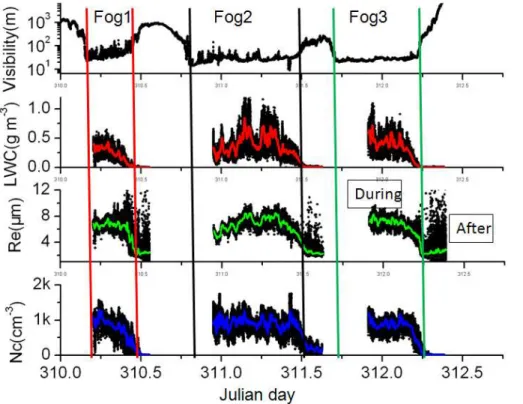
occurrence in the event, three fog periods are found according to the observed relative humidity (RH), ambient temperature, fog liquid water content (LWC), and the range of visibility. The first fog period (Fog-1) occurred from 03:45 to 10:42, 6 November. The second fog period (Fog-2) appeared from 19:10, 6 November to 12:27, 7 November, and the third fog period (Fog-3) occurred from 16:29, 7 November to 05:40, 8
Novem-25
ACPD
11, 11911–11937, 2011Analysis of the formation of fog and
haze in North China Plain (NCP)
J. Quan et al.
Title Page
Abstract Introduction
Conclusions References
Tables Figures
◭ ◮
◭ ◮
Back Close
Full Screen / Esc
Printer-friendly Version
Interactive Discussion
Discussion
P
a
per
|
Dis
cussion
P
a
per
|
Discussion
P
a
per
|
Discussio
n
P
a
per
|
system moved out of the NCP region, and the wind speed increased to about 4 m s−1 at the end of the event. The averaged surface temperature was low (6.8±3.4◦) during
the event. At the end of the event, it increased to about 15◦, and the visibility range significantly increased.
Although the visibility is considerably low (with an averaged visibility of 414 m) during
5
the entire duration of the event, the visibility during the 3 fog periods was significantly lower than the average visibility of the event. For example, during the 1, Fog-2, and Fog-3 periods, the visibilities were only 85, 30, and 27 m, respectively. There was lack of measurement of RH during the Fog-3 period. As a result, the RH values were only available during the Fog-1 and Fog-2 periods, with RH values of 95–96%.
10
With accounting for about 4–5% low bias of the RH due to the shortage of the in-struments (Guo et al., 1994), the RH during the Fog-1 and Fog-2 periods should be considered to reach to a super-saturation point, leading to the formation of fogs. In addition to relative humidity, during the 3 fog periods, the visibility was rapidly (in a time scale of 2 min) reduced from 345 to 36, 199 to 56, and 187 to 42 m, respectively
15
at the beginning of the fog events. The LWC appeared during the fog periods, with averaged values of 0.201±0.145, 0.308±0.224, and 0.294±0.216 g m−3 during the 3 fog periods, respectively. The number concentrations (Nc) of fog droplets were about 715±352, 782±331, and 683±368 cm−3during the Fog-1, Fog-2, and Fog-3 periods, respectively.
20
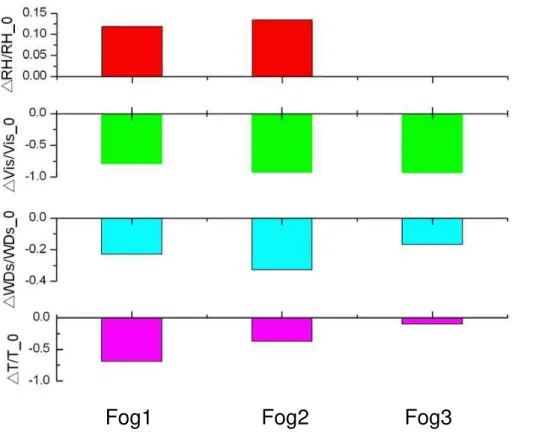
In order to analyze the causes of the 3 fogs, the anomalies of the visibility, surface temperature, relative humidity, and surface wind speed to the averaged values of the fog/haze event (5 November to 8 November) during the three fog periods are calculated and shown in Fig. 6. The result indicates that during the 3 fog periods, the surface temperature was lower by 69%, 37%, and 10% than average temperature, and the
25
ACPD
11, 11911–11937, 2011Analysis of the formation of fog and
haze in North China Plain (NCP)
J. Quan et al.
Title Page
Abstract Introduction
Conclusions References
Tables Figures
◭ ◮
◭ ◮
Back Close
Full Screen / Esc
Printer-friendly Version
Interactive Discussion
Discussion
P
a
per
|
Dis
cussion
P
a
per
|
Discussion
P
a
per
|
Discussio
n
P
a
per
|
A noticeable condition during the fog periods is that there were extremely high aerosol loadings during the measurement period. For example, averaged number and mass concentrations of aerosol were 24 000 cm−3 and 160 µg m−3(with aerosol diam-eter of 10–662 nm), respectively. These values are about 10 times higher than that of four European cities (Puustinen et al., 2007), and could lead to heavy haze event and
5
enhancement of fog formation (Deng et al., 2008; Zhang et al., 2011).
3.3 Characteristics of fog droplets
The above analysis shows that under high aerosol condition, the formation of fogs was frequently occurred, indicating that the high aerosol loadings have important effects on the formation of fog. In order to study the role of heavy aerosol loading on fog
10
formation, the detailed microphysical information of fog droplets is analyzed. The cloud condensation nuclei (CCN) were also observation by DMT CCN counter during the field experiment, the detailed information of the instrument is described by Deng et al. (2011). The measured CCN number concentration (Nc) was about 6600 cm−3(with a supersatuation of 0.2%), indicating the aerosol number concentration (Na) (about
15
24 000 cm−3) was about 3 times higher than the CCN particles, which can provide enough condensation nuclei for the formation of fog droplets.
Figure 7 shows the Nc and effective radium (Re) versus LWC in the three fog events. It shows that the Nc and Re of fog droplets increase with the enhancement of LWC. For example, the averaged values of Re and Nc are 6.1 µm and 769 cm−3 when LWC
20
is 0.2 g m−3, while their values increase to 7.8 µm and 1054 cm−3when LWC increases to 0.6 g m−3. The detailed distribution of droplet size provides more information during different stages of fog periods. Figure 8 shows that during the middle stage of Fog-2 (from 03:00 to 08:00, 7 November), for the droplet size of 5 µm (radium), dNc/dlogD reached a maximum value of 1300 cm−3µm−1. The value of dNc/dlogD was then
25
ACPD
11, 11911–11937, 2011Analysis of the formation of fog and
haze in North China Plain (NCP)
J. Quan et al.
Title Page
Abstract Introduction
Conclusions References
Tables Figures
◭ ◮
◭ ◮
Back Close
Full Screen / Esc
Printer-friendly Version
Interactive Discussion
Discussion
P
a
per
|
Dis
cussion
P
a
per
|
Discussion
P
a
per
|
Discussio
n
P
a
per
|
significantly decreased due to the faster gravity settling. For instance, for the size of droplet of 12 µm, the value of dNc/dlogD was 250 cm−3µ m−1 at the middle stage, but it was rapidly decreased to 20 cm−3µm−1at the late stage of Fog-2. However, for the size of droplet of 2–4 µm which the gravity settling velocity is significantly smaller than the large droplets, the values of Nc were remained the same values compared with the
5
values at the middle stage, indicating that gravity settling of droplets plays important roles when the radius of droplets are larger than 5 µm.
In order to analyze the influence of heavy aerosol loading on the microphysical in-formation of fog droplets, we compare our result with that of Gultepe et al. (2009), who analyzed the measurement in Toronto, Canada. In their observation, the Nc of fog
10
droplet is only about 100 cm−3, the Re reached 15 µm as LWC is 0.2 g m−3. While in our observation, the Nc of fog droplet is about 1000 cm−3, the Re is just about 6 µm as LWC is 0.2 g m−3. The above analysis indicated that heavy aerosol loading in NCP results in the high number concentration of small fog droplets. Because the size of droplet affects their resident time in the atmosphere, the high aerosol concentration in
15
NCP could cause longer duration of fog event. Based on observed microphysical infor-mation of fog droplets, the resident time (Td) of fog droplets due to gravity settlement velocity is calculated. During the Fog-2 period, with measured Re value and assumed height of fog layer of 1500 m, the calculated Td is about 40 h, while the cool air for main-taining the formation of fog is about 6–8 h. As a result, the evaporated water vapors
20
were mostly suspended in the atmosphere, and formed fog again when temperature decreased. The above analysis suggested that the large amount of aerosol particles in NCP tend to increase number concentration of fog droplets, but decrease their size. As a result, the fog droplets suspend in a longer time in the atmosphere, causing a longer duration of fog event or a cascade formation of fogs.
25
Effect of fog and aerosol on visibility
ACPD
11, 11911–11937, 2011Analysis of the formation of fog and
haze in North China Plain (NCP)
J. Quan et al.
Title Page
Abstract Introduction
Conclusions References
Tables Figures
◭ ◮
◭ ◮
Back Close
Full Screen / Esc
Printer-friendly Version
Interactive Discussion
Discussion
P
a
per
|
Dis
cussion
P
a
per
|
Discussion
P
a
per
|
Discussio
n
P
a
per
|
fog droplets and aerosol particles. The method for calculating the range of visibility is as the follows (Deng et al., 2008):
VIS = 3.912/β (1)
whereβrepresents total optical extinction coefficient due to cloud droplets and aerosol particles. The impacts of gas phase molecules on visibility include Rayleigh scattering
5
of air, and the absorptions of O3, NO2, and SO2 of solar radiation are small compared with the droplets and particles under heavy aerosol loading conditions. As a result, their effects on visibility are ignored in this study (Deng et al., 2008).
Figure 9 shows the calculated visibility during the Fog-1 period based upon the mea-sured concentrations of fog droplets and aerosol particles. The result shows that the
10
measured visibility was extremely low (30 to 60 m) during the Fog-1 period. In order to estimate the individual contributions of fog droplets and aerosol particles to the mea-sured low visibility, the individual contribution of fog droplets and aerosol particles to the range of visibility is calculated according to Eq. (1). For example, with consid-ering the solo effect of aerosol particles on visibility, the calculated visibility ranges
15
from 300–600 m with considering the hygroscopic growth of aerosols (the rate of hy-groscopic growth from Yan et al., 2009). Although the visibility is very low due to the heavy aerosol loadings, the calculated values are significantly higher than the mea-sured result (30–60 m). The calculated visibility also shows that the visibility has a slightly decrease trend from the beginning of the fog (600 m) to the end of the fog
20
(300 m), while the observed visibility has an increase trend from the beginning of the fog (30 m) to the end of the fog (60 m). Both the inconsistencies (range and trend of visibility) suggest that the measured extreme low visibility (less than 100 m) cannot be resulted only from aerosol particles. When the effect of fog droplets are taken into account for the calculation of visibility, the calculated visibility is fairly consistent to the
25
ACPD
11, 11911–11937, 2011Analysis of the formation of fog and
haze in North China Plain (NCP)
J. Quan et al.
Title Page
Abstract Introduction
Conclusions References
Tables Figures
◭ ◮
◭ ◮
Back Close
Full Screen / Esc
Printer-friendly Version
Interactive Discussion
Discussion
P
a
per
|
Dis
cussion
P
a
per
|
Discussion
P
a
per
|
Discussio
n
P
a
per
|
Figure 10 illustrates the effect of hygroscopic growth of aerosols on visibility. During the event, there was several haze periods which occurred before or after the forma-tion of the 3 fog periods. During these haze periods (non-fog periods), heavy aerosol loadings played important roles for the reduction of visibility due to the scattering and absorbing properties of aerosol particles (Charlson et al., 1987; Jacobson, 2001; Deng
5
et al., 2008). In addition to the direct radiative effect on visibility by dry aerosol particles, the hygroscopic growth of aerosol particles also play an important role in controlling the calculation of visibility. The hydrophilic aerosol particles (such as sulfate, sea salt, etc) increase the size of particles by absorbing water vapor (Tie et al., 2005) to become larger size particles. As a result, the larger particles enhance the scattering of
sun-10
light, and lead to higher reduction of visibility. Figure 10 shows that prior the Fog-1 period, the measured visibility ranged from 600 to 1500 m. The humidity ranged from 55 to 85% during the period. At the beginning of the period (from 12:00 to 12:40, 5 November), the humidity was relatively low (55 to 65%), and the visibility was rela-tively high (1200–1500 m). By contrast, at the end of the period (from 12:40 to 24:00,
15
5 November), the humidity was rapidly increased from 60 to 80%, and the visibility was significantly decreased from 1500 to several hundred meters. This result suggests that under heavy aerosol conditions, the hygroscopic growth of aerosols significantly affected the measured visibility. In order to quantify the individual contributions of the concentrations of aerosol particles (in dry state) and the hygroscopic growth of aerosol
20
particles to the range of visibility, two calculations of the hygroscopic growth of aerosol particles with different humidity were conducted. The first calculation used a fixed hu-midity (40%). In this case, the variability of the calculated visibility was only determined by the variability of aerosol concentrations. The calculated visibility in this case is con-sistently higher than the measured value (see Fig. 10). For example, the averaged
25
ACPD
11, 11911–11937, 2011Analysis of the formation of fog and
haze in North China Plain (NCP)
J. Quan et al.
Title Page
Abstract Introduction
Conclusions References
Tables Figures
◭ ◮
◭ ◮
Back Close
Full Screen / Esc
Printer-friendly Version
Interactive Discussion
Discussion
P
a
per
|
Dis
cussion
P
a
per
|
Discussion
P
a
per
|
Discussio
n
P
a
per
|
of visibility was not determined by the aerosol variations, and was mainly due to the strong variation of humidity. In the second calculation, when the measured humidity was taken into account for the calculation, the calculated visibility was closed to the measured values, especially at the end of the period, in which the relative humidity was high (around 80%). For example, the averaged visibility of the calculation at the
5
end period (from 16:13 to 24:00, 5 November) is about 1044 m compared with the mea-sured value of 1200 m. This calculation suggests that hygroscopicity of aerosols plays important roles for the reduction of visibility, especially during heavy aerosol loading conditions. However, at the beginning of the period, the calculated visibility was higher than the measured value. The calculated visibility was generally higher than 2000 m,
10
while the measured value ranged from 1200 to 1500 m. This calculation indicates that the rate of hygroscopicity suggested by Yan et al. (2009) is underestimated under low humidity condition (less than 60%) and is consistent to the measurement under high humidity condition (greater than 60%).
4 Summary 15
The NCP region is one of the regions with very heavy aerosol loadings, and haze and fog events are frequently occurred in this region. In this study, a long-term trend of fog and haze over the NCP region during the past 56 years is analyzed to study the effect of aerosol loadings on the formations of haze and fog, especially under high aerosol loadings. In order to understand the detailed interaction between aerosol particles and
20
the formations of haze and fog, a field measurement was conducted and measured result is analyzed in this study. During the experiment, a dense fog/haze event was occurred over the NCP region between 5 November to 8 November 2009, producing extremely low visibility. The in-suite measurement of meteorological parameters (such as surface winds, temperature, relative humidity, etc.) and microphysical parameters
25
ACPD
11, 11911–11937, 2011Analysis of the formation of fog and
haze in North China Plain (NCP)
J. Quan et al.
Title Page
Abstract Introduction
Conclusions References
Tables Figures
◭ ◮
◭ ◮
Back Close
Full Screen / Esc
Printer-friendly Version
Interactive Discussion
Discussion
P
a
per
|
Dis
cussion
P
a
per
|
Discussion
P
a
per
|
Discussio
n
P
a
per
|
particles and fog droplets) were measured and analyzed. The results are summarized as the follows:
1. The haze day occurrence over the NCP region in the past 56 years experienced a rapidly transition period. For example, before 1970, the haze days remained in a constant value (20–30 days yr−1), and the haze days started to increase in 1980.
5
After 1980, the haze days remained a high values 50–100 days yr−1.
2. There was a nonlinear relationship between the occurrences of haze and fog. When the haze day occurrences were lower than 40 days yr−1, the occurrences of fog was strongly proportional to the occurrences of haze day. By contrast, when the haze day occurrences were very high, the occurrences of fog were not
sen-10
sitive to the occurrences of haze. For example, when the haze day occurrences were larger than 75 days yr−1, the occurrences of fog were remained a near con-stant value (20 days yr−1).
3. The aerosol loading has the potential to affect the Td of fog by change the Nc and Re of fog droplets. With the increasing of aerosol concentration, the Nc of
15
fog droplets will increase and the Re will decrease correspondingly, which will lead to longer Td of fog. Therefore the occurrence of fog events will increase with the increases of aerosol concentration until it can provide enough condensation nuclei for fog droplets formation.
4. During the fog periods, the visibility was strongly affected by the occurrences of
20
fog droplets, which produced extremely low visibility (less than 100 m). However, during the haze period, the hygroscopic of aerosols played an important role for the reduction of visibility, especially during heavy aerosol loading conditions. The calculated visibility with the hygroscopic growth of aerosol is consistent with mea-sured visibility when relative humidity is high (60–80%). However, the calculated
25
ACPD
11, 11911–11937, 2011Analysis of the formation of fog and
haze in North China Plain (NCP)
J. Quan et al.
Title Page
Abstract Introduction
Conclusions References
Tables Figures
◭ ◮
◭ ◮
Back Close
Full Screen / Esc
Printer-friendly Version
Interactive Discussion
Discussion
P
a
per
|
Dis
cussion
P
a
per
|
Discussion
P
a
per
|
Discussio
n
P
a
per
|
Acknowledgements. This research is partially supported by National Natural Science
Foun-dation of China (NSFC) under Grant No. 40905060; The National Basic Research Pro-gram of China (2011CB403401); China Meteorological Administration (CMA) under Grant No. GYHY200806001-4. The project of scientific and technological new star of Beijing un-der Grant No. 2010B029; The National Center for Atmospheric Research is sponsored by the
5
National Science Foundation.
References
Bian, H., Han, S. Q., Tie, X., Shun, M. L., and Liu, A. X.: Evidence of impact of aerosols on surface ozone concentration: a case study in Tianjin, China, Atmos. Environ., 41, 4672– 4681, 2007.
10
Charlson, R. J., Lovelock, J. E., Andreae, M. O., and Warren, S. G.: Oceanic phytoplankton, atmospheric sulfur, cloud albedo and climate, Nature, 326, 655–661, 1987.
Charlson, R. J., Schwartz, S. E., Hales, J. M., Cess, R. D. J., Coakley, A., Hansen, J. E., and Hofmann, D. J.: Climate forcing by anthropogenic aerosol, Science, 255, 423–430, 1992. Deng, X. J., Tie, X., Wu, D., Zhou, X. J., Tan, H. B., Li, F., and Jiang, C.: Long-term trend
15
of visibility and its characterizations in the Pearl River Delta Region (PRD), China, Atmos. Environ., 42, 1424–1435, 2008.
Deng, Z. Z., Zhao, C. S., Ma, N., Liu, P. F., Ran, L., Xu, W. Y., Chen, J., Liang, Z., Liang, S., Huang, M. Y., Ma, X. C., Zhang, Q., Quan, J. N., Yan, P., Henning, S., Mildenberger, K., Sommerhage, E., Sch ¨afer, M., Stratmann, F., and Wiedensohler, A.: Size-resolved and bulk
20
activation properties of aerosols in the North China plain: the importance of aerosol size distribution in the prediction of CCN number concentration, Atmos. Chem. Phys. Discuss., 11, 1333–1366, doi:10.5194/acpd-11-1333-2011, 2011.
Ginoux, P., Chin, M., Tegen, I., Prospero, J. M., Holben, B., Dubovik, O., and Lin, S. J.: Sources and distributions of dust aerosols simulated with the GOCART model, J. Geophys. Res., 106,
25
20255–20273, 2001.
ACPD
11, 11911–11937, 2011Analysis of the formation of fog and
haze in North China Plain (NCP)
J. Quan et al.
Title Page
Abstract Introduction
Conclusions References
Tables Figures
◭ ◮
◭ ◮
Back Close
Full Screen / Esc
Printer-friendly Version
Interactive Discussion
Discussion
P
a
per
|
Dis
cussion
P
a
per
|
Discussion
P
a
per
|
Discussio
n
P
a
per
|
Guo, X., Zheng, S., and Wang, J.: Field tests and measurement accuracy of automatic weather stations (AWS), J. Appl. Meteorol., 5(22), 176–183, 1994.
Han, S. Q., Bian, H., Tie, X., Xie, Y., Sun, M., and Liu, A.: Impact measurements of nocturnal planetary boundary layer on urban air pollutants: from a 250-m tower over Tianjin, China, J. Hazard. Mater., 162, 264–269, 2009.
5
Jacobson, M. Z.: Strong radiative heating due to the mixing state of black carbon in atmospheric aerosols, Nature, 409, 695–697, 2001.
Puustinen, A., H ¨ameri, K., Pekkanen, J., Kulmala, M., de Hartog, J., Meliefste, K., ten Brink, H., Kos, G., Katsouyanni, K., Karakatsani, A., Kotronarou, A., Kavouras, I., Meddings, C., Thomas, S., Harrison, R., Ayres, J. G., van der Zee, S., and Hoek, G.: Spatial variation of
10
particle number and mass over four European cities, Atmos Environ., 41, 6622–6636, 2007. Ramanathan, V. and Vogelmann, A. M.: Greenhouse effect, atmospheric solar absorption, and
the Earth’s radiation budget: from the Arrhenius-Lanely era to the 1990s, Ambio, 26(1), 38– 46, 1997.
Ramanathan, V., Crutzen, P. J., and Kiehl, J. T.: Aerocols, climate, and the hydrological cycle,
15
Science, 294, 2119–2124, 2001.
Takacs, L. L., Molod, A., and Wang, T.: Documentation of the Goddard Earth Observing System (GEOS) General Circulation Model-Version 1: Technical report series on global modeling and data assimilation NASA Tech. Memo., 104606, 1, 100 pp., 1994.
Tegen, I., Koch, D., Lacis, A. A., and Sato, M.: Trends in tropospheric aerosol loads and
cor-20
responding impact on direct radiative forcing between 1950 and 1990: a model study, J. Geophys. Res., 105, 26971–26990, 2000.
Tie, X., Madronich, S., Walters, S., Edwards, D. P., Ginoux, P., Mahowald, N., Zhang, R. Y., Lou, C., and Brasseur, G.: Assessment of the global impact of aerosols on tropospheric oxidants, J. Geophys. Res., 110, D03204, doi:10.1029/2004JD005359, 2005.
25
Tie, X., Brasseur, G., Zhao, C., Granier, C., Massie, S., Qin, Y., Wang, P. C., Wang, G. L., and Yang, P. C.: Chemical characterization of air pollution in Eastern China and the Eastern United States, Atmos. Environ., 40, 2607–2625, 2006.
Tie, X., Wu, D., and Brasseur, G.: Lung Cancer Mortality and Exposure to Atmospheric Aerosol Particles in Guangzhou, China, Atmos. Environ., 43, 2375–2377, 2009.
30
Vautard R., Yiou, P., and Oldenborgh, G.: Decline of fog, mist and haze in Europe over the past 30 years, Nat. Geosci., 2, 115–119, doi:10.1038/NGEO414, 2009.
ACPD
11, 11911–11937, 2011Analysis of the formation of fog and
haze in North China Plain (NCP)
J. Quan et al.
Title Page
Abstract Introduction
Conclusions References
Tables Figures
◭ ◮
◭ ◮
Back Close
Full Screen / Esc
Printer-friendly Version
Interactive Discussion
Discussion
P
a
per
|
Dis
cussion
P
a
per
|
Discussion
P
a
per
|
Discussio
n
P
a
per
|
Wu, D., Tie, X., Li, C. C., Ying, Z. M., Lau, A. K., Huang, J., Deng, X. J., and Bi, X. Y.: An extremely low visibility event over the Guangzhou region: a case study, Atmos. Environ., 39, 6568–6577, 2005.
Yan, P., Pan, X., Tang, J., Zhou, X., Zhang, R., and Zeng, L.: Hygroscopic growth of aerosol scattering coefficient: A comparative analysis between urban and suburban sites at winter in
5
Beijing, Particuology, 7, 50–60, 2009.
Zhang, Q., Ma, X., Tie, X., Huang, M., and Zhao, C.: Vertical Distributions of Aerosols under Different Weather Conditions: Analysis of In-situ Aircraft Measurements in Beijing, China, Atmos. Environ., 43, 5526–5535, 2009.
Zhang, Q., Quan, J., Tie, X., Huang, M., and Ma, X.: Impact Aerosol Particles on Cloud
For-10
ACPD
11, 11911–11937, 2011Analysis of the formation of fog and
haze in North China Plain (NCP)
J. Quan et al.
Title Page
Abstract Introduction
Conclusions References
Tables Figures
◭ ◮
◭ ◮
Back Close
Full Screen / Esc
Printer-friendly Version
Interactive Discussion
Discussion
P
a
per
|
Dis
cussion
P
a
per
|
Discussion
P
a
per
|
Discussio
n
P
a
per
|
Fig. 1.The topographic map of NCP and the location of visibility observation sites, and location
of the 16 measurement sites (black – rural; white – urban).
ACPD
11, 11911–11937, 2011Analysis of the formation of fog and
haze in North China Plain (NCP)
J. Quan et al.
Title Page
Abstract Introduction
Conclusions References
Tables Figures
◭ ◮
◭ ◮
Back Close
Full Screen / Esc
Printer-friendly Version
Interactive Discussion
Discussion
P
a
per
|
Dis
cussion
P
a
per
|
Discussion
P
a
per
|
Discussio
n
P
a
per
|
Fig. 2.The occurrences of haze (black lines) and fog (red lines) over NCP during 1954–2009.
ACPD
11, 11911–11937, 2011Analysis of the formation of fog and
haze in North China Plain (NCP)
J. Quan et al.
Title Page
Abstract Introduction
Conclusions References
Tables Figures
◭ ◮
◭ ◮
Back Close
Full Screen / Esc
Printer-friendly Version
Interactive Discussion
Discussion
P
a
per
|
Dis
cussion
P
a
per
|
Discussion
P
a
per
|
Discussio
n
P
a
per
|
Fig. 3. Evolution of average haze day occurrences at urban sites(A)and rural sites (C), and
average fog day occurrences at urban sites(B)and rural sites (D)over the NCP region, the bars is standard deviation.
ACPD
11, 11911–11937, 2011Analysis of the formation of fog and
haze in North China Plain (NCP)
J. Quan et al.
Title Page
Abstract Introduction
Conclusions References
Tables Figures
◭ ◮
◭ ◮
Back Close
Full Screen / Esc
Printer-friendly Version
Interactive Discussion
Discussion
P
a
per
|
Dis
cussion
P
a
per
|
Discussion
P
a
per
|
Discussio
n
P
a
per
|
Fig. 4.The correlation between averaged fog and haze day occurrences.
ACPD
11, 11911–11937, 2011Analysis of the formation of fog and
haze in North China Plain (NCP)
J. Quan et al.
Title Page
Abstract Introduction
Conclusions References
Tables Figures
◭ ◮
◭ ◮
Back Close
Full Screen / Esc
Printer-friendly Version
Interactive Discussion
Discussion
P
a
per
|
Dis
cussion
P
a
per
|
Discussion
P
a
per
|
Discussio
n
P
a
per
|
Fig. 5. The characteristics of fog droplets, including fog droplet number concentration (Nc),
effective radius (Re), and liquid water content (LWC).
ACPD
11, 11911–11937, 2011Analysis of the formation of fog and
haze in North China Plain (NCP)
J. Quan et al.
Title Page
Abstract Introduction
Conclusions References
Tables Figures
◭ ◮
◭ ◮
Back Close
Full Screen / Esc
Printer-friendly Version
Interactive Discussion
Discussion
P
a
per
|
Dis
cussion
P
a
per
|
Discussion
P
a
per
|
Discussio
n
P
a
per
|
Fog1 Fog2
Fog3
Fig. 6.The anomalies of the visibility, surface temperature, relative humidity, and surface wind
speed during the three fog period to the averaged value of the event.
ACPD
11, 11911–11937, 2011Analysis of the formation of fog and
haze in North China Plain (NCP)
J. Quan et al.
Title Page
Abstract Introduction
Conclusions References
Tables Figures
◭ ◮
◭ ◮
Back Close
Full Screen / Esc
Printer-friendly Version
Interactive Discussion
Discussion
P
a
per
|
Dis
cussion
P
a
per
|
Discussion
P
a
per
|
Discussio
n
P
a
per
|
8
8
Fig. 7.The Nc and effective radium (Re) versus LWC in the three fog events.
ACPD
11, 11911–11937, 2011Analysis of the formation of fog and
haze in North China Plain (NCP)
J. Quan et al.
Title Page
Abstract Introduction
Conclusions References
Tables Figures
◭ ◮
◭ ◮
Back Close
Full Screen / Esc
Printer-friendly Version
Interactive Discussion
Discussion
P
a
per
|
Dis
cussion
P
a
per
|
Discussion
P
a
per
|
Discussio
n
P
a
per
|
Fig. 9. The calculated visibility during the Fog-1 period based upon the measured
concentra-tions of fog droplets and aerosol particles.
ACPD
11, 11911–11937, 2011Analysis of the formation of fog and
haze in North China Plain (NCP)
J. Quan et al.
Title Page
Abstract Introduction
Conclusions References
Tables Figures
◭ ◮
◭ ◮
Back Close
Full Screen / Esc
Printer-friendly Version
Interactive Discussion
Discussion
P
a
per
|
Dis
cussion
P
a
per
|
Discussion
P
a
per
|
Discussio
n
P
a
per
|
Fig. 10. The calculated visibility prior the Fog-1 period based upon the measured