BGD
5, 3409–3432, 2008Model of carbon flow for mineralizing
microorganism
L. L. Robbins et al.
Title Page
Abstract Introduction
Conclusions References
Tables Figures
◭ ◮
◭ ◮
Back Close
Full Screen / Esc
Printer-friendly Version
Interactive Discussion Biogeosciences Discuss., 5, 3409–3432, 2008
www.biogeosciences-discuss.net/5/3409/2008/ © Author(s) 2008. This work is distributed under the Creative Commons Attribution 3.0 License.
Biogeosciences Discussions
Biogeosciences Discussionsis the access reviewed discussion forum ofBiogeosciences
Carbonate precipitation by the
thermophilic archaeon
Archaeoglobus
fulgidus
: a model of carbon flow for an
ancient microorganism
L. L. Robbins1, K. A. Van Cleave1, and P. Ostrom2
1
US Geological Survey, St. Petersburg, FL, USA
2
Department of Zoology, Michigan State University, East Lansing, MI, USA Received: 10 July 2008 – Accepted: 18 July 2008 – Published: 28 August 2008 Correspondence to: L. L. Robbins (lrobbins@usgs.gov)
BGD
5, 3409–3432, 2008Model of carbon flow for mineralizing
microorganism
L. L. Robbins et al.
Title Page
Abstract Introduction
Conclusions References
Tables Figures
◭ ◮
◭ ◮
Back Close
Full Screen / Esc
Printer-friendly Version
Interactive Discussion
Abstract
Microbial carbonate precipitation experiments were conducted using the archaeon bac-teria Archaeoglobus fulgidus to determine chemical and isotopic fractionation of or-ganic and inoror-ganic carbon into mineral phases. Carbonate precipitation was induced in two different experiments usingA. fulgidusto determine the relative abundance of
or-5
ganically derived carbon incorporated into carbonate minerals as well as to define any distinct phases or patterns that could be attributed to the precipitation process. One experiment used a medium containing13C-depleted organic carbon and13C-enriched inorganic carbon, and the other used a14C-labeled organic carbon source. Results in-dicated that 0.9–24.8% organic carbon was incorporated into carbonates precipitated
10
byA. fulgidus and that this process was mediated primarily by pH and CO2 emission from cells. Data showed that the carbon in the CO2produced from this microorganism
is incorporated into carbonates and that the rate at which precipitation occurs and the dynamics of the carbonate precipitation process are strongly mediated by the specific steps involved in the biochemical process for lactate oxidation byA. fulgidus.
15
1 Introduction
It has long been recognized that microbes are capable of influencing mineralization processes, but the significant magnitude of microbial calcification in sediment deposi-tion is only recently being realized. The difficulty in recognizing biogenic versus abio-genic minerals has been, in part, often due to similarities in morphologies and lack of
20
unambiguous biomarkers. Understanding how cellular physiology affects calcification processes is one critical way of developing reliable geochemical tools for identification of microbial biomarkers in carbonates. Microbial influences on carbonate precipitation include a variety of processes, such as the inhibition of extracellular carbonate nucle-ation via biologically produced molecules, the enhancement of carbonate precipitnucle-ation
25
BGD
5, 3409–3432, 2008Model of carbon flow for mineralizing
microorganism
L. L. Robbins et al.
Title Page
Abstract Introduction
Conclusions References
Tables Figures
◭ ◮
◭ ◮
Back Close
Full Screen / Esc
Printer-friendly Version
Interactive Discussion through the uptake or release of metabolic products (Sumner, 1997). For heterotrophic
bacteria, nutritional conditions are a major factor in the relationships between crystals and bacteria (Castanier et al., 1999). The precipitation of carbonates has been demon-strated to occur on the cell surfaces of heterotrophic marine bacteria under both aero-bic and anaeroaero-bic, agitated and non-agitated laboratory conditions, and at pHs ranging
5
between 6.9 and 8.7 (Krumbein, 1974). Carbonate precipitation using a hyperther-mophilic archaeon was demonstrated by Robbins et al. (1999) and Van Cleave (2003). Archaeons are thought to be one of the most ancient forms of life to exist on Earth, appearing during the Archaean Era around 3.9 billion years ago. Recently, het-erotrophic Archaea were found to dominate the sedimentary subsurface ecosystems
10
offPeru (Biddle et al., 2006). These findings highlight how much is still to be learned about microbial processes in sediments.
Our experiments used Archaeoglobus fulgidus, a strictly anaerobic, hyperther-mophillic archaeon which grows at temperatures between 60–95◦C and at a pH range
of 5.5–7.5, with optimal growth occurring at 83◦C and pH of 6.9 (Stetter, 1988). Ar-15
chaeoglobus fulgidus grows chemolithoheterotrophically through dissimilatory sulfate reduction and the complete oxidation of lactate to CO2. Archaeoglobus fulgidus also fixes CO2 in the presence of H2 (Stetter, 1988). Significant for potentially influencing
mineral precipitation by acting as a template, A. fulgidus cells consist of an S-layer composed of glycoprotein subunits in hexagonal array (Stetter, 1988).
20
Precipitation experiments using carbon isotopes were performed using Ar-chaeoglobus fulgidusto construct a model for the production of carbonates and car-bon transfer to the mineral phase. Of interest were the questions of whether microbially produced organic carbon and CO2derived from microbial metabolism are incorporated
into the crystal, and if so, to what extent. In these experiments, carbonate precipitation
25
BGD
5, 3409–3432, 2008Model of carbon flow for mineralizing
microorganism
L. L. Robbins et al.
Title Page
Abstract Introduction
Conclusions References
Tables Figures
◭ ◮
◭ ◮
Back Close
Full Screen / Esc
Printer-friendly Version
Interactive Discussion whether CO2evolved from the oxidation of lactate byA. fulgiduswas incorporated into
precipitated carbonate minerals and helped to define distinct phases or patterns at-tributed to the precipitation process. This information provides insight into how closely linked the carbon cycle is coupled between microbial metabolism and mineral precipi-tation processes and provides some insight into mineral biomarkers.
5
2 Materials and methods
2.1 Culturing ofArchaeoglobus fulgidus
One-milliliter aliquots of A. fulgidus cells obtained from the Deutsche Sammlung von Mikroorganismen und Zellkulturen GmbH (DSMZ German Collection of Microorgan-isms) were added to serum bottles containing 100 ml of A. fulgidus medium (Van
10
Cleave, 2003) in 1-ml aliquots and incubated at 83◦C for 5 days. SYBR Gold
nu-cleic acid gel stain obtained from Molecular Probes™ was used to stain cells for direct counts. Cell concentrations of cultures in stationary phase after a 5-day incubation period ranged from 4.60×10⁷to 8.89×10⁸cells ml−1.
2.2 Carbonate precipitation and isotope fractionation experiment
15
Precipitation medium (Van Cleave, 2003), created to facilitate precipitation of carbon-ate byA. fulgidus, was made using lactic acid with aδ13C value of−22%, 99.9%13
C-labeled sodium bicarbonate, and 99.9%13C-labeled CO2. The medium was added in
500 ml aliquots to two 500 ml serum bottles pre-flushed with N2gas. The medium was subsequently reduced by adding 0.25 g of cysteine HCl to each serum bottle. Each
20
serum bottle was gassed with13CO2to adjust the pH to 6.9. Approximately 1000 ml
ofA. fulgidusculture was centrifuged anaerobically under N2gas in twenty 50-ml cen-trifuge tubes for 15 min at 16 000×G. The supernatant was discarded from each tube,
BGD
5, 3409–3432, 2008Model of carbon flow for mineralizing
microorganism
L. L. Robbins et al.
Title Page
Abstract Introduction
Conclusions References
Tables Figures
◭ ◮
◭ ◮
Back Close
Full Screen / Esc
Printer-friendly Version
Interactive Discussion immediately re-centrifuged. The supernatant was discarded from each tube, and the
pellets were suspended in the reduced precipitation medium present in the two 500-ml serum bottles (10 pellets per bottle). The bottles containing the medium and cells were vortexed for 30 s. One hundred milliliter aliquots of medium containing the cells were added to ten 100 ml serum bottles, pre-flushed with nitrogen. The bottles were then
5
incubated at 83◦C. A single serum bottle was removed from the incubator at 0, 1, 2, 3,
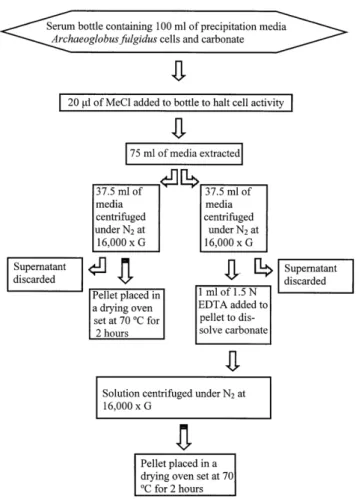
4, 8, 12, 16, 20, and 24 h. Approximately 1 ml of medium and cells was extracted from the serum bottle for each time step, filtered though a 0.022µm filter, and 2-ml of deion-ized water filtered, to remove any residual medium. The filter was then coated with gold palladium and analyzed using a Hitachi S-3500N scanning electron microscope
10
(SEM). Carbonate and organic material was retrieved from each serum bottle accord-ing to the steps outlined in Fig. 1. Samples were then analyzed for13C values using a Thermo Finnigan Delta PLUS XL mass spectrometer. For pellets of combined organic material and carbonate, 20 to 40µg of sample were used for each mass spectrometer analysis. For each pellet of organic material alone, 80 to 150µg of sample was used
15
for each mass spectrometer analysis. Cell counts were performed for each time step using a direct-count method with SYBR Gold staining.
The biomass, calculated using a 310 fg Cµm−3 conversion factor (Fry, 1990), for
each sample ranged from 2.07×10¹⁰to 3.03×10⁹fg C. The percentage of carbonate C
and the percentage of organic C in sample OC for each time interval were determined
20
using Eqs. (1) and (2).
δ13Csample=f1δ13C1+f2δ13C2 (1)
f1+f2=1 (2)
where δ13Csample=value for OC, f1=fraction of organic C in OC (unknown),
δ13C1=value for organic C in OC f2=fraction of carbonate C (unknown) in OC, and 25
δ13C2=value for carbonate C in OC.
The value of 1−f1was assigned for f2. The averageδ 13
BGD
5, 3409–3432, 2008Model of carbon flow for mineralizing
microorganism
L. L. Robbins et al.
Title Page
Abstract Introduction
Conclusions References
Tables Figures
◭ ◮
◭ ◮
Back Close
Full Screen / Esc
Printer-friendly Version
Interactive Discussion
13
C-labeled sodium bicarbonate and 99.9%13C-labeled CO2 was used for δ 13
C2 for
each time step. The biomass for each time step was calculated using Eq. (3):
Biomass=(π/4)d2(1−d /3)×(cells/ml×ml of culture) (Fry, 1990). (3)
The value fordrepresents the average diameter ofA. fulgiduscells for each time step. The diameter for each cell was measured from SEM images of cells captured at each
5
time step.
2.3 14C experiment
In order to determine whether CO2 evolved from the oxidation of lactate by
A. fulgidus was incorporated into precipitated carbonate minerals, experiments were conducted using [3-14C] lactic acid as the primary source of carbon for the archaeon.
10
Archeoglobus fulgidus cells (1-ml aliquots) were added to serum bottles containing 100 ml ofA. fulgidusmedium and incubated at 83◦C for 5 days. Two-hundred milliliters
of two separate A. fulgidus cultures (1 and 2) in stationary phase were centrifuged anaerobically under N2gas in separate centrifuge tubes at 16 000×G for 15 min. The
only difference between cultures 1 and 2 was cell count. The supernatant was
dis-15
carded and the remaining microbial pellets were re-suspended into eight separate 100-ml serum bottles containing reducedA. fulgidus culture medium minus the yeast extract and sodium lactate components. Four of the bottles contained cells from cul-ture 1, and four of the bottles contained cells from culcul-ture 2. Fifteen microliters of 57 mCi/mmol [3-14C] lactic acid were added to each 100-ml bottle. The serum bottles
20
were incubated for 4 days at 83◦C. Following the 4-day incubation period, each bottle
was spiked with an additional 7.5µl of 57 mCi/mmol14C-labelled lactic acid and incu-bated for an additional 3 h. Following the second incubation period, the four serum bottles containing cells from culture 1 had a cell concentration of 1.27×10⁷cells ml−1,
whereas the four serum bottles containing the cells from culture 2 had a cell count of
25
1.09×10⁸cells ml−1. The media and cells were then centrifuged anaerobically under
BGD
5, 3409–3432, 2008Model of carbon flow for mineralizing
microorganism
L. L. Robbins et al.
Title Page
Abstract Introduction
Conclusions References
Tables Figures
◭ ◮
◭ ◮
Back Close
Full Screen / Esc
Printer-friendly Version
Interactive Discussion 16 000×G for 15 min. The supernatant was discarded and each microbial pellet was
rinsed in 15 ml of precipitation medium to remove any excess extracellular14C and re-centrifuged anaerobically at 16 000×G for 15 min. The supernatant was discarded from
each tube, and the remaining microbial pellets were re-suspended into four separate 100-ml serum bottles (two pellets for each 100-ml bottle) containing 100 ml of reduced
5
precipitation medium. The two bottles containing cells from culture 1 (samples A and B) had a cell count of 2.36×10⁷cells ml−1, whereas the two bottles containing cells
from culture 2 (samples C and D) had a cell count of 1.26×10⁸cells ml−1. Samples A
and B were incubated at 83◦C for 200 h, and samples C and D were incubated at 83◦C
for 96 h. Every 8 h, a 1-ml aliquot was taken from each bottle and added to a
scintilla-10
tion vial. Ten milliliters of LCD cocktail was added, vortexed for 30 s, and subsequently analyzed using a TM Analytic 6891 Delta 300 liquid scintillation counter. Each vial was analyzed five times for 30 s.
3 Results
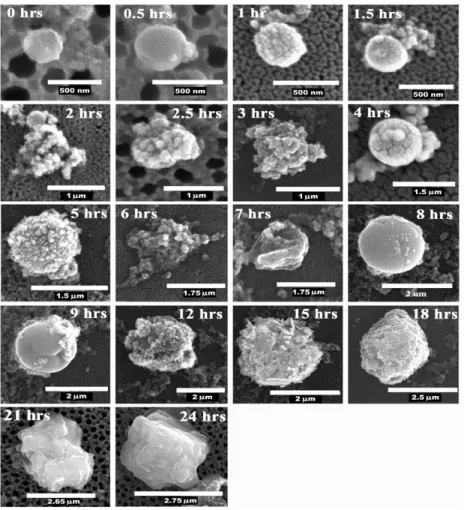
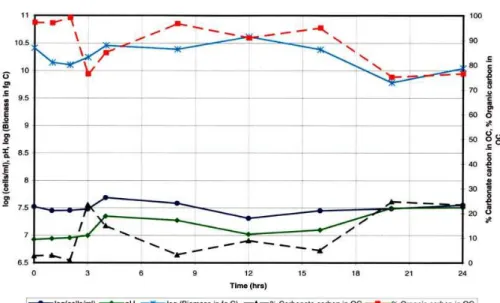
Figure 2 shows time-lapsed SEM images of the precipitation of carbonate by
Ar-15
chaeoglobus fulgiduscells over a 24-h period. From the onset of precipitation at 0 h to the final image captured after 24 h, the total size of cells and associated carbonate crystals increased from 250 nm in diameter to roughly 2.75µm in diameter. Cell counts, average cell diameter, pH measurements, and calculated biomass for each time step over the 24-h duration of the experiment are reported in Table 1. Also shown in Table 1
20
are the δ13C value for the organics+carbonate pellet (OC) and the pellet composed only of organics (O) as well as the percentage of organics and percentage of carbon-ate in the OC sample. The overall pH of the medium increased by 0.59 over the 24-h time period. Cell counts ranged from 2.77×10⁷to 3.60×10⁷cells/ml for each time step.
The average cell diameter ofA. fulgidus cells for each time step ranged from 230 nm
25
BGD
5, 3409–3432, 2008Model of carbon flow for mineralizing
microorganism
L. L. Robbins et al.
Title Page
Abstract Introduction
Conclusions References
Tables Figures
◭ ◮
◭ ◮
Back Close
Full Screen / Esc
Printer-friendly Version
Interactive Discussion percentage of organic C in OC, and the pH of the medium over a 24-h period. Between
12 and 24 h, there is a negative correlation between the pH of the medium and the per-centage of organic C in OC (r=−0.997) and a positive correlation between the pH and
the percentage of carbonate C in OC (r=0.997), indicating that precipitation is driven by the pH of the medium.
5
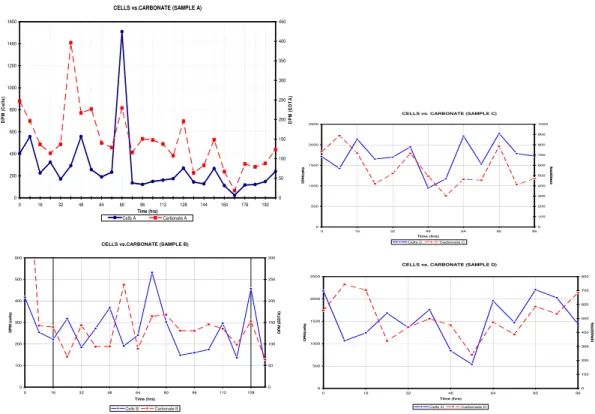
Figure 4 shows the14C values, in disintegrations per minute (DPM), of the medium, cells, and carbonate for samples A, B, C, and D. Disintegration per minute values for the carbonate were above background14C levels for all four samples and showed distinct maximum values and minimum values. Values (DPM) for the total (supernatant, cells and carbonate) and the supernatant for samples A and B were significantly higher than
10
the values for cells and carbonate, whereas DPM values for the total (supernatant, cells, and carbonate) were significantly higher than the values for cells, carbonate, and supernatant for samples C and D.
Carbonate, cell, supernatant, and total (cells, carbonate, and supernatant) values in Fig. 4 for samples A, B, C, and D show distinct patterns. These patterns were
15
separated into three separate phases (I, II, and III). Phase I was characterized by cell, carbonate, total, and supernatant trends which were not in step with each other. During phase I, when the DPM values of cells and/or carbonate mineral were increasing or at a maximum, one or both supernatant values and the total were decreasing or at a minimum and vice versa. Phase I occurred for sample A (Fig. 4) between 16 and 56 h,
20
64 and 72 h, and 88 and 120 h, and 136 and 160 h; for sample B (Fig. 4) between 16 and 80 h, 104 and 112 h, and 136 and 160 h; for sample C (Fig. 4) between 0 and 16 h, 40 and 56 h, and 80–96 h; and for sample D (Fig. 4) between 0 and 32 h, 80 and 96 h, and 40–52 h. Phase II was characterized by cell, carbonate, supernatant, and total (cells, carbonate, and supernatant) and supernatant trends, which were all
25
BGD
5, 3409–3432, 2008Model of carbon flow for mineralizing
microorganism
L. L. Robbins et al.
Title Page
Abstract Introduction
Conclusions References
Tables Figures
◭ ◮
◭ ◮
Back Close
Full Screen / Esc
Printer-friendly Version
Interactive Discussion were matched and total (cells, carbonate, and supernatant) and supernatant trends,
which were matched. However, the two pairs were not in phase with each other. In other words, when cell and carbonate trends increased or were at a maximum, total and supernatant trends decreased or were at a minimum and vice versa. In Fig. 4, phase III occurred for sample A between 72 and 88 h and 128 and 136 h; for sample
5
B between 96 and 104 h; for sample C between 32 and 40 h and 56 and 72 h; and for sample D between 32 and 40 h and 72 and 88 h.
The three different phases (I, II, and III) observed in samples A, B, C, and D for the precipitation of14C carbonates occurred in a specific sequential order which is present in all four samples. At some point during the microbial-precipitation process, phase I,
10
phase II, phase III, and phase I occurred in consecutive order for samples A, B, C, D. This sequence occurred between 88 and 144 h for sample A (Fig. 4), between 16 and 112 h for sample B (Fig. 4), between 0 and 56 h for sample C (Fig. 4) and between 40 and 96 h in sample D (Fig. 4).
4 Discussion
15
These experiments demonstrate thatArchaeoglobus fulgidus plays a role in the cipitation of carbonate minerals and that a biological fingerprint is imparted on pre-cipitated carbonate minerals through the incorporation of carbon in the form of CO2.
Results of 14C experiments indicate that the process that A. fulgidus uses to incor-porate CO2 within the mineral phase occurs as it gains energy through dissimilatory
20
sulfate-reduction and the oxidization of lactate to CO2(Stetter, 1988), according to the
following equation (M ¨oller-Zinkhan and Thauer, 1990):
CH3CHOHCOO−+1.5SO2−
4 +4H+→3CO2+1.5H2S+3H2O (4)
The oxidation of lactate to 3CO2 proceeds via an acetyl-CoA/carbon monoxide de-hydrogenase pathway, in which the second step is catalyzed by pyruvate: ferredoxin
25
BGD
5, 3409–3432, 2008Model of carbon flow for mineralizing
microorganism
L. L. Robbins et al.
Title Page
Abstract Introduction
Conclusions References
Tables Figures
◭ ◮
◭ ◮
Back Close
Full Screen / Esc
Printer-friendly Version
Interactive Discussion M ¨oller-Zinkhan and Thauer (1990) performed experiments with [2-14C] pyruvate,
[3−14C] pyruvate, and 14CO2 to determine the distribution of carbon during lactate
oxidation byA. fulgidus. It was determined that [2−14C] pyruvate became
decarboxy-lated to [1−14C] acetyl CoA, while [3−14C] pyruvate produced [2−14C] acetyl CoA and
released14CO2. When the assay was performed in the presence of 12
CO2, the acetyl 5
CoA underwent an isotopic exchange with outside 12CO2, releasing 14
C atoms and incorporating12C atoms into the methyl and carbonyl groups.
When the assay was performed by M ¨oller-Zinkhan and Thauer (1990) in the pres-ence of14CO2,
14
C-carbon atoms were exchanged with the acetyl CoA-carbon atoms and were incorporated into the methyl and carbonyl group in a specific ratio of 23%
10
to 76%. The carbonyl group from the [1−14C] acetyl CoA was converted to 14CO2,
indicating that 76% of the carbon incorporated into the acetyl CoA through isotopic ex-change was released as a gas. No14CO2was evolved during the conversion of [3−14C
] pyruvate to [2−14C] acetyl CoA, indicating that the methyl group was not oxidized to
CO2during this step. 15
Our experiments using [3−14C] lactic acid determined that CO2 evolved from the
oxidation of lactate byA. fulgiduswas concomitantly incorporated into carbonate min-erals. The M ¨oller-Zinkhan and Thauer (1990) model was also used to help explain the dynamics of any salient patterns specific to the carbonate-precipitation cycle.
4.1 Model for carbonate precipitation – and incorporation of carbon into carbonate
20
One of the most important contributions of microorganisms to mineral precipitation is their role in catalyzing nucleation. It has been suggested that a microorganism in a saturated solution serves as a foreign solid that becomes a foundation or template for the development of nuclei (Fortin et al., 1997). The cell envelope ofArchaeoglobus fulgidus consists of glycoprotein subunits forming an layer (Stetter, 1988). The
S-25
BGD
5, 3409–3432, 2008Model of carbon flow for mineralizing
microorganism
L. L. Robbins et al.
Title Page
Abstract Introduction
Conclusions References
Tables Figures
◭ ◮
◭ ◮
Back Close
Full Screen / Esc
Printer-friendly Version
Interactive Discussion exposed, identical reactive sites between carboxyl groups at the end of amino acids,
to which divalent cations, Fe2+, Mg2+, Ca2+, Mn2+, Pb2attach. The metal ions remain attached to the outer cell and form ionic bonds with CO2−
3 anions, resulting in carbonate
mineral formation.
Our observations of carbonate precipitation onA. fulgidus cells for the first hour of
5
induction experiments show the first solid-carbonate products to appear on the surface of the cells as patches, later to extend and coalesce to form a cocoon-like covering (Fig. 2) and are in close agreement with that of Castanier et al. (1999). These obser-vations agree with the hypothesis proposed by Coleman (1993) that initial spheroidal carbonate formation is succeeded by a stage wherein the locus of precipitation moves
10
beyond the previous boundary both laterally and vertically. However, the SEM images in Fig. 2 show that this phenomenon occurs a second time between 4 and 8 h and be-gins a third time after 8 h. After 12 h, carbonate formation no longer occurs in smooth, uniform sheets, but begins to form rapidly and sporadically. After 18 h, perfectly sym-metrical, spheroidal carbonate shapes are no longer abundant, and the carbonates
15
begin to take on the shapes of well-defined crystals that have reached sizes as large as 2.75µm. This may indicate that between 9 and 15 h the majority of carbonate pre-cipitation has become regulated by strictly inorganic processes, which would explain the transition from smooth symmetrical spheroids to almost angular crystals.
Figure 2 shows a step-wise progression of carbonate precipitation on the microbial
20
cells, representing the most prevalent form of carbonate-covered cell present at that specific time step as well as the first appearance of that form in large numbers. After a 24-h period, four different forms of cells covered in carbonate (present throughout the 24-h precipitation sequence), including cells in the initial stages of carbonate nu-cleation, are present together in one small locality. This indicates that the rate of
micro-25
bial precipitation occurs heterogeneously throughout the medium. Scanning Electron Microscopy of the carbonates precipitated by A. fulgidus cells after four days shows aggregates of individual calcified cells, and well-defined carbonate crystals growing off
BGD
5, 3409–3432, 2008Model of carbon flow for mineralizing
microorganism
L. L. Robbins et al.
Title Page
Abstract Introduction
Conclusions References
Tables Figures
◭ ◮
◭ ◮
Back Close
Full Screen / Esc
Printer-friendly Version
Interactive Discussion shown here) similar to biomineral aggregates observed by Castanier et al. (1999).
The calculated values for the percentage of organic C and the percentage of carbon-ate C present in each OC pellet for each time step (Table 1) correlcarbon-ate well with the SEM images in Fig. 2. The fraction of carbonate is extremely small for the first two hours, making up less than 0.008 of the sample at 2 h. The small percentage of carbonate C
5
is representative of the small-scale nucleation seen in Fig. 2. An even smaller percent-age of carbonate present at 2 h most likely represents the onset of metabolic activity byA. fulgidus cells following a lag phase. Cellular activity results in the production of CO2 from the oxidation of lactic acid (Stetter, 1988) leading to the subsequent partial
dissolution of carbonate associated with cells. The cell counts (Table 1), which show
10
that a slight increase in the number of cells occurs between 2 and 3 h followed by a major increase in the number of cells at sometime between 3 and 4 h, also indicate a major increase in metabolic activity.
Following a lag phase, there is an exponential increase of bacteria coupled with the accumulation of metabolic end products, resulting in the accumulation of carbonate
15
and bicarbonate ions in the medium and a pH increase that induces carbonate pre-cipitation (Castanier et al., 1999). A major increase in cell numbers (Table 1), which occurs between 3 and 4 h, is accompanied by an increase in biomass and pH (Fig. 3). However, a major increase in the percentage of carbonate C in OC occurs just before 3 h and then decreases significantly between 3 and 8 h. This can be attributed to more
20
substantial carbonate nucleation (as seen in Fig. 2) than that which occurred between 0 and 2 h and subsequent partial dissolution of carbonate due to CO2production. The
production of CO2byA. fulgiduscells is represented by the decrease in pH that occurs between 4 and 12 h and could lead to dissolution. However, the continual increase in carbonate from 0 to 12 h (Fig. 2) indicates that the rate of carbonate precipitation
25
between 0 and 12 h is greater than the rate of carbonate dissolution.
BGD
5, 3409–3432, 2008Model of carbon flow for mineralizing
microorganism
L. L. Robbins et al.
Title Page
Abstract Introduction
Conclusions References
Tables Figures
◭ ◮
◭ ◮
Back Close
Full Screen / Esc
Printer-friendly Version
Interactive Discussion is marginally high, most likely due to the low n-value. The p- and r-values for the 0 to
24-h time interval show a slightly weaker correlation between pH and the percentage of carbonate. However, no correlation exists between pH and the percentage of carbon-ate at the 0- to 4-h and 4- to 24-h time intervals. This indiccarbon-ates that pH does not play a major role in carbonate precipitation between 3 and 12 h. Therefore, the contribution
5
of carbonate and bicarbonate ions to the medium through the oxidation of lactic acid by A. fulgidus has a more significant role in carbonate precipitation during this time interval than it does between 12 and 24 h. Cumulative H2S production (raising pH) by
A. fulgidus cells and cumulative CO2production between 3 and 12 h resulted in
con-ditions ideal for substantial pH-mediated carbonate precipitation between 12 and 24 h.
10
The perfectly symmetrical, spheroidal carbonate shapes observed between hours 1 and 9 may be the product of carbonate precipitation through increased bicarbonate saturation. However, angular carbonates observed between hours 9 and 24 are the product of predominately pH-mediated precipitation.
4.2 Cell incorporation of14C
15
The14C values for the cells varied throughout the duration of the experiment. When the14C values forA. fulgidus cells were at a maximum, the cells were in the process of converting [3−14C] lactate into [3−14C] pyruvate. When the14C values for the cells
were at a minimum, the cells were at the end of the [3−14C] lactate oxidation process.
Because a large portion of the original14C in the [3−14C] lactate had been evolved as
14
CO2at this point, the14C values for the cells were lower than they were at the initia-tion of lactate oxidainitia-tion. At the end of the lactate oxidainitia-tion process, a small porinitia-tion of the14C was incorporated into the cell while the rest was released as14CO2. Following
the completion of the lactate oxidation process, the cells still had a14C signature from the incorporation of a portion of carbon from the methyl group of the [2−14C] acetyl CoA
into the cell. The mid-range14C values for the cells occurred when [3−14C] pyruvate
was being converted into [2−14C] acetyl CoA. The acetyl CoA decarbonylase/synthase
BGD
5, 3409–3432, 2008Model of carbon flow for mineralizing
microorganism
L. L. Robbins et al.
Title Page
Abstract Introduction
Conclusions References
Tables Figures
◭ ◮
◭ ◮
Back Close
Full Screen / Esc
Printer-friendly Version
Interactive Discussion reaction (Dai et al., 1998):
CO2+2Fdred(Fe2+)+2H++CH3−H4SPt+CoA→acetyl CoA+H4SPt+2Fdox(Fe
3+
)+H2O
where Fd is ferredoxin, and CH3−H4SPt and H4SPt denote N 5
-methyl-tetrahydrosarcinapterin and -methyl-tetrahydrosarcinapterin.
This reaction shows that ambient CO2 is fixed during the formation of acetyl CoA. The fixed carbon dioxide is present as either14CO2 or12CO2. Mid-range14C values for the cells occur when the14CO2 is fixed and when the carbonyl and methyl groups 5
in the [2−14C] acetyl CoA undergo an isotopic exchange with outside 14CO2. These 14
C values are not as high as those which occur during the conversion of [3−14C]
lactate to [3−14C] pyruvate because a portion of14C in the lactate has left the cell as
14
CO2. Furthermore, ambient 12
CO2 incorporated into the methyl group of the acetyl
CoA dilutes the14C signal.
10
4.3 Incorporation of14C into carbonate
Increases and decreases in carbonate trends represent an increase or decrease in the overall amount of14C present in carbonate minerals. The relatively high 14C val-ues for the carbonate fraction of samples A, B, C, and D indicate that 14C derived from the oxidation of [3−14C] lactic acid by A. fulgidus cells is incorporated into the
15
microbially precipitated carbonates. In this process, [3−14C] lactic acid is converted
to [3−14C] pyruvate and the [3−14C] pyruvate produces 14CO2as it is converted into
[2−14C] acetyl CoA. A mixture of14CO2and 12
CO2is produced as the carbonyl group
in the acetyl CoA is reduced. A significant amount of14CO2 is also produced during the final step of oxidation of the methyl group in the [2−14C] acetyl CoA. Some of the
20 14
CO2evolved during the lactate oxidation process is incorporated into carbonate
min-erals as14CO2−
3 while the remaining portion is either incorporated into the medium as
(H14CO−
BGD
5, 3409–3432, 2008Model of carbon flow for mineralizing
microorganism
L. L. Robbins et al.
Title Page
Abstract Introduction
Conclusions References
Tables Figures
◭ ◮
◭ ◮
Back Close
Full Screen / Esc
Printer-friendly Version
Interactive Discussion 4.4 Supernatant and total (cells, carbonate, and supernatant)
Although cells grown on [3−14C] lactic acid were rinsed prior to re-suspension in the
precipitation medium, it is possible that some unoxidized [3−14C] lactic acid bound
to cells was not completely removed. This [3−14C] lactic acid is therefore possibly
present in the supernatant for samples A, B, C, and D. Fluctuations in14C values of
5
the supernatant reflect changes in the amount of14C in the system present as H14CO− 3
and unoxidized [3−14C] lactic acid not associated with cells. Increases and maximum
14
C values, which occur in supernatant trends, indicate an increase in the amount of
14
C present as H14CO−
3 , whereas decreases and minimums represent a decrease in
either [3−14C] lactic acid, H14CO−3, or both. The14C values for the total (includes cells,
10
carbonate and supernatant) indicate the overall amount of14C present as a mixture of
14
CO2−
3 , H
14
CO−
3
,[3-14
C] lactic acid, and cellular material. Only a very small amount of
14
CO2is represented in the 14
C values for the total because the majority of the gas is evolved during sample preparation for analysis.
In samples A and B (Fig. 4), the 14C values for the total (cells, supernatant, and
15
carbonate) and supernatant alone decrease significantly between 0 and 16 h and pro-gressively decrease between 56 and 160 h. This can be attributed to a shift in the allocation of 14C in the system as [3−14C] lactic acid in the medium is oxidized and
14
C is incorporated into the medium as H14CO−
3, cellular material, and carbonates, or
escapes as14CO2 gas. In samples C and D, the values for the cells, carbonate, and
20
supernatant are lower than the value for the total (cells, carbonate, and supernatant). This is primarily due to the loss of14CO2(from cellular activity and outgassing), which
occurs in the time period between sample extraction and the point at which cells are separated from carbonate. The value for the carbonate fraction in samples A, B, C, and D is the lowest of the four components because it is formed from both ambient12CO2 25
as well as14CO2released during the conversion of [3− 14
C] pyruvate to [2−14C] acetyl
BGD
5, 3409–3432, 2008Model of carbon flow for mineralizing
microorganism
L. L. Robbins et al.
Title Page
Abstract Introduction
Conclusions References
Tables Figures
◭ ◮
◭ ◮
Back Close
Full Screen / Esc
Printer-friendly Version
Interactive Discussion
5 Phases present during carbonate precipitation:
5.0.1 Phase I
Three different phases of precipitation/dissolution occurred during the experiment, of-ten in sequential order. In phase I, carbonate, total (cell, carbonate, and supernatant), cell and supernatant data indicate that carbonate formation is mediated primarily by the
5
production of14CO2byArchaeoglobus fulgidus. When the14C values for the cells are at a maximum, the carbonate14C values are either decreasing or at a minimum. This indicates that the overall pH of the medium is not high immediately following14CO2
emission from the cells. When the14C values for the supernatant are increasing or at a maximum,14CO2 produced by A. fulgidus cells is incorporated into the medium
10
as H14CO−
3 . At this point, the pH of the medium is not high enough for carbonate
precipitation to occur.
However, subsequently, when cell 14C values are decreasing or at minimum val-ues, the carbonate14C values are increasing or at a maximum and14CO2 has been
generated to reach a carbonate saturation state sufficiently high for mineral formation.
15
However, when the lactate oxidation process starts again,14CO2released during the early stages of [3−14C] lactate oxidation dissolves pre-existing carbonate. Carbonate
is not re-precipitated until the14C values for the cells are at mid-range or low values.
5.0.2 Phase II
Once cell, carbonate, total (cells, carbonate, and supernatant), and supernatant trends
20
are all in phase, the 14C values for carbonate and the cells increase and decrease together, and the pH of the medium is high enough for carbonate precipitation to oc-cur immediately following14CO2 release fromA. fulgiduscells. The
14
C values for the supernatant also increase and decrease in phase with the values for the cells and car-bonate fractions. Any non-oxidized [3−14C] lactate (not associated with cells) present
25
in the medium is masked at this time by the amount of H14CO−
BGD
5, 3409–3432, 2008Model of carbon flow for mineralizing
microorganism
L. L. Robbins et al.
Title Page
Abstract Introduction
Conclusions References
Tables Figures
◭ ◮
◭ ◮
Back Close
Full Screen / Esc
Printer-friendly Version
Interactive Discussion been introduced into the medium via14CO2 production from the oxidation of [3−
14
C] lactate. Additionally, the data indicate that the rate at which14CO2 emitted from cells
is incorporated into the medium as H14CO−
3 is proportional to the rate at which 14
CO2 is incorporated into carbonate minerals.
5.0.3 Phase III
5
In phase III, cell trends and carbonate trends are in phase, and total (cells, carbonate, and supernatant) trends and supernatant trends are in phase, but the two pairs are not in phase with respect to each other. This indicates that the 14C in the system is predominately present as H14CO−
3. In phase III, when carbonate trends increase
or are at a maximum, total trends decrease or are at a minimum, indicating that the
10
amount of 14C present as carbonate mineral and cells is significantly less than the
14
C present as H14CO3. Cells are at mid-range 14
C values, indicating that they are in the process of converting [3−14C] pyruvate into [2−14C] acetyl CoA. The 14CO2 gas
released from this process may be dissolving carbonate, resulting in lower carbonate
14
C values and higher supernatant 14C values. The isotopic exchange with outside
15 12
CO2and production of lighter 12
CO2, which also occurs during this process, may also
explain the lower14C values of any new carbonate precipitated.
5.1 Proposed model of carbonate precipitation
The phases (I, II, III, and I) observed in samples A, B, C, and D occur sequentially dur-ing carbonate precipitation byA. fulgidus. Further, the rate at which precipitation occurs
20
and the dynamics of the carbonate precipitation process are strongly mediated by the specific steps involved in the biochemical process for lactate oxidation byA. fulgidus.
Phase I represents the initial step, in which carbonate precipitation occurs heteroge-neously and sporadically and carbonates are continuously precipitated, dissolved, and re-precipitated. In phase I, carbonate precipitation is driven solely by14CO2 produc-25
BGD
5, 3409–3432, 2008Model of carbon flow for mineralizing
microorganism
L. L. Robbins et al.
Title Page
Abstract Introduction
Conclusions References
Tables Figures
◭ ◮
◭ ◮
Back Close
Full Screen / Esc
Printer-friendly Version
Interactive Discussion II, maximum of carbonate precipitation is occurring as a result of the overall pH of the
medium increasing from dissimilatory sulfate-reduction. Phase III represents the transi-tional phase back to Phase I, in which the pH of the medium decreases from increased
14
CO2 production, but the majority of 14
C in the medium is still present as H14CO−
3.
Complete repetition of all phases was not observed within the time frame of the
ex-5
periment. However, we suggest that it is likely mediated by H14CO−
3 concentration and
pH.
Acknowledgements. We gratefully acknowledge the help of the following individuals: K. Yates, D. Griffin, J. Lisle, C. Kellogg, J. Harwood, and A. Lapaglia; D. Hollander for his assistance with the mass spectrometer; J. Ryan for his assistance with the XRD; and T. Greco for his
10
assistance with the SEM. This research was funded by the NASA Astrobiology Institute and the US Geological Survey.
References
Biddle, J. F., Lipp, J. S., Lever, M. A., Lloyd, K. G., Sorensen, K. B., Anderson, R., Fredricks, H. F., Elvert, M., Kelly, T. J., Scrag, D. P., Sogin, M. L., Brenchley, J. E., Teske, A., House, C. H.,
15
and Hinrichs, K.: Heterotrophic Archaea dominate sedimentary subsurface ecosystems off
Peru, P. Natl. Acad. Sci. USA, 104(10), 3846–3851, 2006.
Castanier, S., M `etayer-Levrel, G., and Perthuisot, J.: Ca-carbonates precipitation and lime-stone genesis – the microbiogeochemist point of view, Sediment. Geol., 126, 9–23, 1999. Coleman, M. L.: Microbial processes: controls on the shape and composition of carbonate
20
concretions, Mar. Geol., 113, 127–140, 1993.
Dai, Y.-R., Reed, D. W., Millstein, J. H., Hartzell, P. L., Grahame, D. A., and Demoll, E.: Acetyl-CoA decarbonylase/synthase complex fromArchaeoglobus fulgidus, Arch. Microbiol., 169, 525–529, 1998.
Fortin, D., Ferris, F. G., and Beveridge, T. J.: Surface-mediated mineral development by
bacte-25
ria, Rev. Mineralogy, 35, 161–180, 1997.
Fry, J. C.: Direct methods and biomass estimation, Method Microbiol., 22, 42–85, 1990. Krumbein, W. E.: On the precipitation of aragonite on the surface of marine bacteria,
BGD
5, 3409–3432, 2008Model of carbon flow for mineralizing
microorganism
L. L. Robbins et al.
Title Page
Abstract Introduction
Conclusions References
Tables Figures
◭ ◮
◭ ◮
Back Close
Full Screen / Esc
Printer-friendly Version
Interactive Discussion
Kunow, J., Linder, D., and Thauer, R. K.: Pyruvate: ferredoxin oxidoreductase from sulfate-reducingArchaeoglobus fulgidus: molecular composition, catalytic properties, and sequence alignments, Arch. Microbiol., 163, 21–28, 1995.
M ¨oller-Zinkhan, D. and Thauer, R. K.: Anaerobic lactate oxidation to 3CO2 byArchaeoglobus fulgidusvia the carbon monoxide dehydrogenase pathway: demonstration of the acetyl-CoA
5
carbon-carbon cleavage reaction in cell extracts, Arch. Microbiol., 153, 215–218, 1990. Robbins, L. L, Van Cleave, K., and Ryan, J.: Comparison of carbonate textural features in
ALH84001 and microbially induced textures in orthopyroxene, Lunar and Planetary Science Conference XXX, 15–19 March 1999, Houston, Texas, 1464, 1999.
Schultze-Lam, S., Fortin, D., Davis, B. S., and Beveridge, T. J.: Mineralization of bacterial
10
surfaces, Chem. Geol., 132, 171–181, 1996.
Stetter, K. O.: Archaeoglobus fulgidus gen. Nov., sp. Nov.: a New Taxon of extremely Ther-mophilic Archaebacteria, Syst. Appl. Microbiol., 10, 172–173, 1988.
Sumner, D. Y.: Late Archean calcite-microbe interactions: two morphologically distinct microbial communities that affected calcite nucleation differently, PALAIOS, 12, 302–318, 1997.
15
BGD
5, 3409–3432, 2008Model of carbon flow for mineralizing
microorganism
L. L. Robbins et al.
Title Page
Abstract Introduction
Conclusions References
Tables Figures
◭ ◮
◭ ◮
Back Close
Full Screen / Esc
Printer-friendly Version
Interactive Discussion
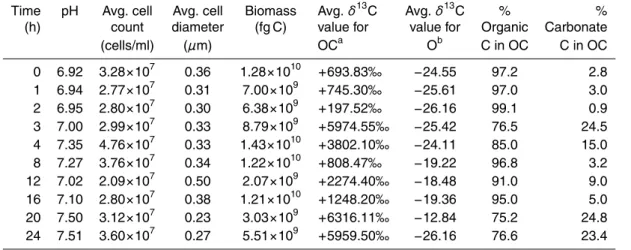
Table 1. Data obtained from 24-h carbonate precipitation experiment using Archaeoglobus
fulgiduscells in a precipitation media prepared w/ isotopically light lactic acid and13C-enriched sodium bicarbonate and CO2.
Time pH Avg. cell Avg. cell Biomass Avg.δ13C Avg.δ13C % % (h) count diameter (fg C) value for value for Organic Carbonate
(cells/ml) (µm) OCa Ob C in OC C in OC
0 6.92 3.28×10⁷ 0.36 1.28×10¹⁰ +693.83‰ −24.55 97.2 2.8
1 6.94 2.77×10⁷ 0.31 7.00×10⁹ +745.30‰ −25.61 97.0 3.0
2 6.95 2.80×10⁷ 0.30 6.38×10⁹ +197.52‰ −26.16 99.1 0.9
3 7.00 2.99×10⁷ 0.33 8.79×10⁹ +5974.55‰ −25.42 76.5 24.5
4 7.35 4.76×10⁷ 0.33 1.43×10¹⁰ +3802.10‰ −24.11 85.0 15.0
8 7.27 3.76×10⁷ 0.34 1.22×10¹⁰ +808.47‰ −19.22 96.8 3.2
12 7.02 2.09×10⁷ 0.50 2.07×10⁹ +2274.40‰ −18.48 91.0 9.0
16 7.10 2.80×10⁷ 0.38 1.21×10¹⁰ +1248.20‰ −19.36 95.0 5.0
20 7.50 3.12×10⁷ 0.23 3.03×10⁹ +6316.11‰ −12.84 75.2 24.8
24 7.51 3.60×10⁷ 0.27 5.51×10⁹ +5959.50‰ −26.16 76.6 23.4
a
OC=Pellet comprised of carbonate and organic material
b
BGD
5, 3409–3432, 2008Model of carbon flow for mineralizing
microorganism
L. L. Robbins et al.
Title Page
Abstract Introduction
Conclusions References
Tables Figures
◭ ◮
◭ ◮
Back Close
Full Screen / Esc
Printer-friendly Version
Interactive Discussion
BGD
5, 3409–3432, 2008Model of carbon flow for mineralizing
microorganism
L. L. Robbins et al.
Title Page
Abstract Introduction
Conclusions References
Tables Figures
◭ ◮
◭ ◮
Back Close
Full Screen / Esc
Printer-friendly Version
Interactive Discussion
Fig. 2. Time-lapsed SEM images of carbonate precipitation byArchaeoglobus fulgidus cells
BGD
5, 3409–3432, 2008Model of carbon flow for mineralizing
microorganism
L. L. Robbins et al.
Title Page
Abstract Introduction
Conclusions References
Tables Figures
◭ ◮
◭ ◮
Back Close
Full Screen / Esc
Printer-friendly Version
Interactive Discussion
Fig. 3. Graphical representation of 24-h carbonate precipitation experiment using
BGD
5, 3409–3432, 2008Model of carbon flow for mineralizing
microorganism
L. L. Robbins et al.
Title Page Abstract Introduction Conclusions References Tables Figures ◭ ◮ ◭ ◮ Back Close
Full Screen / Esc
Printer-friendly Version
Interactive Discussion
CELLS vs.CARBONATE (SAMPLE A)
0 200 400 600 800 1000 1200 1400 1600
0 16 32 48 64 80 96 112 128 144 160 176 192
Time (hrs) D P M ( C e lls ) 0 50 100 150 200 250 300 350 400 450 DP M ( E D T A)
Cells A Carbonate A
CELLS vs.CARBONATE (SAMPLE B)
0 100 200 300 400 500 600
0 16 32 48 64 80 96 112 128
Time (hrs) D P M (c e lls ) 0 50 100 150 200 250 300 DPM ( E DT A)
Cells B Carbonate B
CELLS vs. CARBONATE (SAMPLE C)
0 500 1000 1500 2000 2500
0 16 32 48 64 80 96
Time (hrs) DP M ( c ells ) 0 100 200 300 400 500 600 700 800 900 1000 DP M (E D T A )
Cells C Carbonate C
CELLS vs. CARBONATE (SAMPLE D)
0 500 1000 1500 2000 2500
0 16 32 48 64 80 96
Time (hrs) D P M ( c e lls ) 0 100 200 300 400 500 600 700 800 DP M ( E DT A)
Cells D Carbonate D
Fig. 4. Graphs of time series of samplesA, B, C, Dshowing cell C (in DPM) vs. carbonate (in