http://dx.doi.org/10.1590/s2175-97902017000300149
A
r
*Correspondence: C. Rajani. Department of Pharmacy, Banasthali Uni-versity, Niwai - Jodhpuriya Road, 304022 - Vanasthali, Rajasthan. E-mail: [email protected]
Effects of granule particle size and lubricant concentration on
tablet hardness containing large concentration of polymers
Chauhan Rajani
1*, Dewangan Devendra Kumar
1*, Dwivedi Jaya
2, Jha Arvind Kumar
31Department of Pharmacy, Banasthali University, Rajasthan,India, 2Department of Chemistry, Banasthali University,
Rajasthan, India, 3Department of Pharmaceutical Sciences, Shri Shankaracharya Institute of Pharmaceutical Sciences, Bhilai, Chhattisgarh, India
The objective of this research work is to demonstrate the impact of granule size and lubricant concentration on the hardness of tablets in formulations containing higher concentration of polymers and to resolve the hardness issue during compression process. The work involves optimization of a milling process for size reduction of granules and blending process to achieve tablets of good hardness on compression. To optimize the granule size, diferent sized co-mill screens were used. The diferent concentration of lubricant were studied on diferent sized granules to check the efect on hardness of tablets and to obtained the desired hardness of tablets. Compression of lubricated blend in various concentration was performed using the gravity feeder and force feeder separately to check the impact on the over lubrication efect. This ultimately leads to less hardness tablets. Lubricated blends were evaluated by performing the Bulk Density, Tapped Density, Hausner ratio and compressibility index tests. Tablets were evaluated for the physical characteristics like weight variation, hardness, thickness and dissolution. It has been conclude that on using the optimum granules size and lubricant concentration in formulation, all the downstream problems can be resolved and this in turn helps in compression of tablets and also provides the good hardness to the tablets.
Keywords: Tablet hardness/efects. Granule size. Lubricant concentration. Polymer.
INTRODUCTION
Granule sizes play an important role in obtaining the hardness of tablets. Generally, as granules size increased,
tablets were found to show increased weight variation, decreased hardness and increased friability. Whereas in reverse phase, granule size is very small, it leads to issues
like sticking due to extra ine particles which enters in
between the surface of punch and dies and form a thin
ilm of it on inner surface of die. This inally prevents the
compressed tablets to come out of the die i.e. issue of tablet ejection from the die.
Also in other way if the granule size is very small, the actual surface area will be more which in turn requires more lubricant concentration to cover completely. The effects obtained were largely dependent on the type and concentration of lubricant. Tablets containing talc as lubricant, shows decreased disintegration time with
increased granule size. This represents need of optimum
lubricant concentration for the compression of diferent
granule size fractions (Jaiyeobaa, Oladiran, 1983).
The function of a lubricant in the product formulation is to prevent powder from sticking to the punches, dies and other metal components of the tablet press. A lubricant also facilitates the ejection of compacted tablets. Typically, lubricants account for a small percentage of the formula’s content. It ranges from 0.25% to 2%. The most common lubricant in pharmaceutical formulations is magnesium stearate.
There are two common errors when processing
lubricants. The irst error is neglecting the pre-screening
of lubricants to remove the lumpy, over-size particles. The second error is failing to blend the lubricant evenly into the product formulation. The lubricant must be able to contact with metal parts to work correctly. However, it is better to under-blend the lubricant than to over-blend it. Over-blending, will hide the lubricant within the other particles, rendering it useless.
lubricant, is probably the most commonly used lubricant for pharmaceutical tableting. It is relatively inexpensive and provides high lubrication.
MATERIAL AND METHODS
Material
A l l t h e r a w m a t e r i a l s , N i c e rg o l i n e ( Te v a Pharmaceutical Industries), Lactose Monohydrate {Pharmatose 200M} (DFE Pharma, Netherlands), Microcrystalline cellulose {Avicel PH 101} (FMC Biopolymer, Philadelphia), Povidone {PVP K-30}(BASF
Corporation, Germany), Xanthan Gum {Xanthural
75} (CP Kelco, Atalanta USA), Methocel K100 LVCR (Dow Chemicals, Michigan, United States), Lactose Monohydrate {Flowlac 100} (Molkerei Meggle
Wasserburg Gmbh), Magnesium stearate (Peter Greven,
Netherlands) used in the formulation are of Ph. Eur. grade.
The quadro co-mill (Model: U5, Ganson-Quadro), Blender (Model: GMP, Saral), Compression machine 16 station (Model: 102i, Fette compacting, Germany), Compression tooling size of 14X7 mm (Parle Elizabeth
tools), Hardness tester (Dr. Schleuniger), Thickness tester (Vernier calliper of Mitutoyo) and Friability apparatus (Electrolab) were used for the processing of blend and compressing into tablets.
Method
Wet granulation, Drying and Milling process
The wet granulation method was used for powder blend using high speed mixer granulator with spraying gun and peristaltic pump for binder-water-solution addition. Drying is carried out in Retsch dryer at Research and Development.
The dried granules were taken from the same batch in equal proportion of 2.0 kg each. Then milling of dried
granules were done using the Quadro co-mill with 24C
(Condidur hole with hole size of 610 microns), 32R
(Round hole with hole size of 813 microns) and 40G (Grater hole with hole size of 1016 microns) screen. After
that blending was done using the double cone blender in R&D scale batch and multidirectional blender in Pilot scale batch. The milling speed was kept constant. It was 1500 rpm, for all the screen size.
Physical properties of powder blend
Particle size distribution
Sieve analysis for particle size distribution (Fayed,
Otten, 1997; Hlinak et al., 2006; Shekunov et al., 2006) of milled granules was performed using electromagnetic sieve shaker (Make: Electrolab, Model: EMS-8) with 100g material for 5 min at power 5 starting with the larger sieve on top from 20# to 120# sieve. Each sieve along with the retained particles was weighed individually after shaking. The test was completed when the weight on the test sieves did not changed by more than 5% of the previous weight (Teixeira, 2009).
Bulk density and Tapped density
Bulk and tapped density of milled granules were performed using the density tester (Make: Electrolab, USP- method 1) using a 250 ml graduated glass cylinder.
Approximately 200 ml of powder was carefully illed into the tared glass cylinder ensuring a lat top surface. The
maximum bulk volume was noted.
Tapped density was performed at 500, 750 and 1250 taps to get the constant reading. The results are the mean of three replicates (USP, 2007a). Loose bulk density (LBD) and Tapped Bulk density (TBD) have been calculated using as the following equations (Baddam, Bandela, 2013; Carr, 1965).
LBD = Weight of the granules /Untapped Volume of the packing
TBD = Weight of the granules /Tapped Volume of the packing.
Hausner ratio (Hausner , 1967) = Tapped density / Bulk density
Carr’s Index = (Tapped density – Bulk density) x 100 / Tapped density
Blending and lubrication
Milled granules were blended with extragranular
materials for 10 min at 20 rpm and inally lubricated with
magnesium stearate (0.93% of total theoretical weight of tablet). It was previously sifted through 60# sieve in 6 litre capacity double cone blender for 5 min at 20 rpm. The particle size distribution was measured for lubricated granules.
Tablet compression
Compression using Gravity & Force Feeder
The lubricated blend was compressed using both gravity feeder (Table III) and force feeder (Table IV) to check the impact on hardness. Compression done at different turret speed to check the impact of speed on physical parameters of the tablets and the parameters were
recorded. Suicient hardness of tablets around 14-22 kp is
Compression of blend into tablets with lesser concentration of lubricant:
Milled granules with 24C screen were divided into four equal parts of 2.0 kg each and blended separately with extragranular materials for 10 minutes at 20 rpm
and inally it was lubricated. For lubrication, magnesium stearate was used in diferent concentration. These were
0.23%, 0.47%, 0.70% and 0.93% of total tablet weight (previously sifted through 60# sieve) in 6 litre capacity double cone blender for 5 minutes at 20 rpm. The blend was compressed and physical parameters of the tablets were recorded.
RESULT AND DISCUSSION
Optimization of milling process
In initial trials of formulation development, the 40G
screen was selected for milling of dried granules. The
granules obtained from the milling through 40G screen
consists of heavier granules along with small portion of
ines. Upon pre-lubrication with the extragranular material
(comprising 30% hydrophilic, less dense, fine powder
polymers), leads to the segregation of larger granules
from the inal lubricated blend. This was due to diference
in the bulk density of granules and powder during the compression. This was in turn due to vibration in machine and hopper.
To avoid this segregation issue of granules, iner
size screen of 32R and 24C was selected for milling process as a part of optimization. It was observed that the retains over 40# sieve is less for 24C screen granules in
comparison to 32R & 40G screen. It can be clearly seen
in the Table III. Also the time required for milling process
is less in case of 24C & 40G screen in comparison with
the 32R screen. (Table II) This in turn depicted the
milling process eiciency and cost efectiveness, as the
unmilled granules obtained after milling are less. The results are the mean of three replicates (Teixeira, 2009) (Table III).
Powder characterization
The physical characteristics like Hausner ratio and Carr’s compressibility index shows the fair to passable
low of blend.
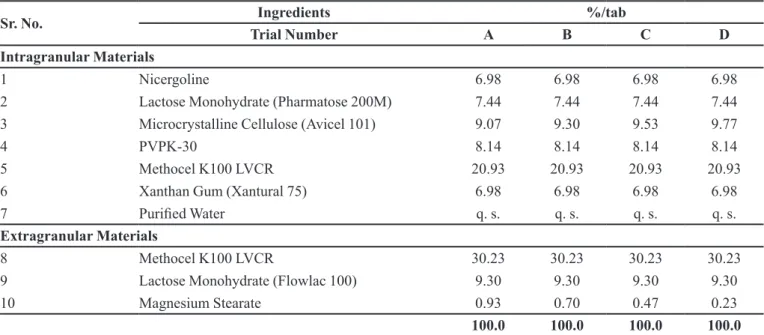
TABLE I - Unit formula composition
Sr. No. Ingredients %/tab
Trial Number A B C D
Intragranular Materials
1 Nicergoline 6.98 6.98 6.98 6.98
2 Lactose Monohydrate (Pharmatose 200M) 7.44 7.44 7.44 7.44
3 Microcrystalline Cellulose (Avicel 101) 9.07 9.30 9.53 9.77
4 PVPK-30 8.14 8.14 8.14 8.14
5 Methocel K100 LVCR 20.93 20.93 20.93 20.93
6 Xanthan Gum (Xantural 75) 6.98 6.98 6.98 6.98
7 Puriied Water q. s. q. s. q. s. q. s.
Extragranular Materials
8 Methocel K100 LVCR 30.23 30.23 30.23 30.23
9 Lactose Monohydrate (Flowlac 100) 9.30 9.30 9.30 9.30
10 Magnesium Stearate 0.93 0.70 0.47 0.23
100.0 100.0 100.0 100.0
TABLE II - Milling parameters
Parameters Co-mill speed (rpm) Milling time (min) Unmilled portion remained after milling (g)
24C Screen 1500 25 97.0
32R Screen 1500 34 121.0
TABLE III - Particle size distribution data (Cumulative % weight retained)
# Sieve Milled Granules Lubricated Granules
(24C screen) (32R screen) (40G screen) (24C screen) (32R screen) (40G screen)
20 00.14 00.19 00.90 00.21 00.21 00.90
40 11.24 19.69 23.76 11.02 15.56 19.40
60 17.04 29.83 36.94 14.09 40.05 28.28
80 62.30 74.71 56.46 70.54 74.13 43.68
100 72.98 85.84 68.70 77.94 86.01 62.54
120 76.88 88.12 77.12 80.07 91.48 76.62
140 83.84 95.12 85.66 86.06 93.46 83.36
Fine collector 100.48 100.41 100.16 100.66 100.17 100.08
BD g/mL$ 00.386 00.404 00.412 00.416 00.387 00.478
TD g/mL$ 00.483 00.531 00.564 00.547 00.531 00.693
Carr’s Index$ 20.00 24.00 27.00 24.00 27.12 31.00
Hausner Ratio$ 01.25 01.32 01.37 01.32 01.37 01.45
*Limit: Fair: 1.19-1.25 (Hausner ratio) & 16-20 (Carr’s index), Passable: 1.26-1.34 (Hausner ratio) & 21-25 (Carr’s index) & Poor: 1.35-1.45 (Hausner ratio) & 26-31 (Carr’s Index), (General Chapter, 1174 USP, 2007b). $: Values are mean of three replicate testing.
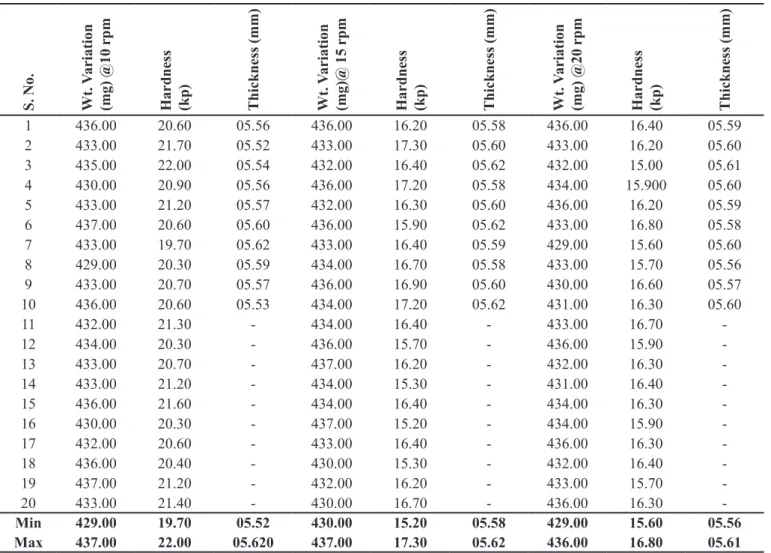
TABLE IV - Compression data form trial no T1A (using gravity feeder) of 24C screen milled granules
S
. N
o.
Wt. V
ar
iati
on
(mg) @
10 r
p
m
H
ar
d
n
es
s
(k
p
)
Th
ic
k
n
es
s (mm)
Wt. V
ar
iati
on
(mg)@
15 r
p
m
H
ar
d
n
es
s
(k
p
)
Th
ic
k
n
es
s (mm)
Wt. V
ar
iati
on
(mg) @
20 r
p
m
H
ar
d
n
es
s
(k
p
)
Th
ic
k
n
es
s (mm)
1 436.00 20.60 05.56 436.00 16.20 05.58 436.00 16.40 05.59
2 433.00 21.70 05.52 433.00 17.30 05.60 433.00 16.20 05.60
3 435.00 22.00 05.54 432.00 16.40 05.62 432.00 15.00 05.61
4 430.00 20.90 05.56 436.00 17.20 05.58 434.00 15.900 05.60
5 433.00 21.20 05.57 432.00 16.30 05.60 436.00 16.20 05.59
6 437.00 20.60 05.60 436.00 15.90 05.62 433.00 16.80 05.58
7 433.00 19.70 05.62 433.00 16.40 05.59 429.00 15.60 05.60
8 429.00 20.30 05.59 434.00 16.70 05.58 433.00 15.70 05.56
9 433.00 20.70 05.57 436.00 16.90 05.60 430.00 16.60 05.57
10 436.00 20.60 05.53 434.00 17.20 05.62 431.00 16.30 05.60
11 432.00 21.30 - 434.00 16.40 - 433.00 16.70
-12 434.00 20.30 - 436.00 15.70 - 436.00 15.90
-13 433.00 20.70 - 437.00 16.20 - 432.00 16.30
-14 433.00 21.20 - 434.00 15.30 - 431.00 16.40
-15 436.00 21.60 - 434.00 16.40 - 434.00 16.30
-16 430.00 20.30 - 437.00 15.20 - 434.00 15.90
-17 432.00 20.60 - 433.00 16.40 - 436.00 16.30
-18 436.00 20.40 - 430.00 15.30 - 432.00 16.40
-19 437.00 21.20 - 432.00 16.20 - 433.00 15.70
-20 433.00 21.40 - 430.00 16.70 - 436.00 16.30
-Min 429.00 19.70 05.52 430.00 15.20 05.58 429.00 15.60 05.56
Bulk density of 24C passed milled granules indicates
that the blend is luier in comparison with the granules of 32R & 40G screen milled granules. Also the Carr’s index and Hausner ratio indicates the fair low of granules with compare to 32R & 40G screen milled granules, which is having poor low. (Table III)
Blending and lubrication
Blending and lubrication time was optimized and
ixed to 10 min and 5 min respectively. The magnesium stearate concentration’s efect on blending and compression
has been studied. And it has been found that the higher concentration i.e. 0.93% of total tablet weight is much higher. This is leading to decrease in hardness of tablets. It has also formed hydrophobic layer over the granules
and inally have reduced the compactability between the
granules. This ultimately has led to less hardness than the desired. (Table VII)
The study of granules with lubricant concentration of 0.23%, 0.47% and 0.70% of total tablet weight was performed. It has been observed that the concentration 0.47% has produced tablets with very good hardness with minimal ejection force and good aesthetic look. The tablets were shining. It indicates the optimum lubrication. Whereas the concentration of 0.23% has also produced the tablets with good hardness but with the increased ejection force. It has also produced sound during tablet ejection due
to ineicient lubrication. (Table I)
Tablets produced with the lubricant concentration of 0.70% are up to the desired hardness with lesser ejection value. However the hardness obtained was lesser than that of 0.47% lubricant containing granules. Tablet had good aesthetic value and surface shining.
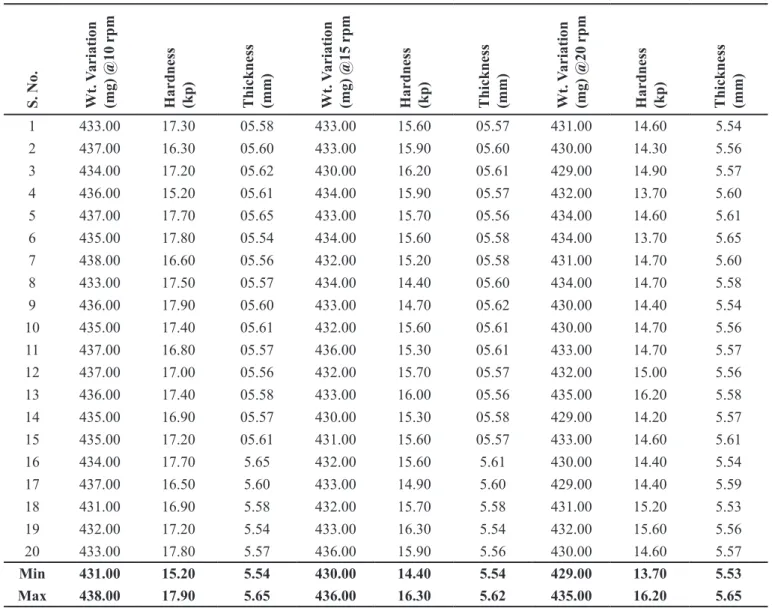
TABLE V - Compression of data for trial no T1B (using force feeder) of 24C screen milled granules
S
. N
o.
Wt. V
ar
iati
on
(mg) @
10 r
p
m
H
ar
d
n
es
s
(k
p
)
Th
ic
k
n
es
s
(mm) Wt. V
ar
iati
on
(mg) @
15 r
p
m
H
ar
d
n
es
s
(k
p
)
Th
ic
k
n
es
s
(mm) Wt. V
ar
iati
on
(mg) @
20 r
p
m
H
ar
d
n
es
s
(k
p
)
Th
ic
k
n
es
s
(mm)
1 433.00 17.30 05.58 433.00 15.60 05.57 431.00 14.60 5.54
2 437.00 16.30 05.60 433.00 15.90 05.60 430.00 14.30 5.56
3 434.00 17.20 05.62 430.00 16.20 05.61 429.00 14.90 5.57
4 436.00 15.20 05.61 434.00 15.90 05.57 432.00 13.70 5.60
5 437.00 17.70 05.65 433.00 15.70 05.56 434.00 14.60 5.61
6 435.00 17.80 05.54 434.00 15.60 05.58 434.00 13.70 5.65
7 438.00 16.60 05.56 432.00 15.20 05.58 431.00 14.70 5.60
8 433.00 17.50 05.57 434.00 14.40 05.60 434.00 14.70 5.58
9 436.00 17.90 05.60 433.00 14.70 05.62 430.00 14.40 5.54
10 435.00 17.40 05.61 432.00 15.60 05.61 430.00 14.70 5.56
11 437.00 16.80 05.57 436.00 15.30 05.61 433.00 14.70 5.57
12 437.00 17.00 05.56 432.00 15.70 05.57 432.00 15.00 5.56
13 436.00 17.40 05.58 433.00 16.00 05.56 435.00 16.20 5.58
14 435.00 16.90 05.57 430.00 15.30 05.58 429.00 14.20 5.57
15 435.00 17.20 05.61 431.00 15.60 05.57 433.00 14.60 5.61
16 434.00 17.70 5.65 432.00 15.60 5.61 430.00 14.40 5.54
17 437.00 16.50 5.60 433.00 14.90 5.60 429.00 14.40 5.59
18 431.00 16.90 5.58 432.00 15.70 5.58 431.00 15.20 5.53
19 432.00 17.20 5.54 433.00 16.30 5.54 432.00 15.60 5.56
20 433.00 17.80 5.57 436.00 15.90 5.56 430.00 14.60 5.57
Min 431.00 15.20 5.54 430.00 14.40 5.54 429.00 13.70 5.53
Above said trial depicts that the 0.47% lubricant concentration has been optimal concentration for the formulation and this has been capable of producing the tablets with desired hardness and all physical value. (Table VII).
To counter check the efect of lubricant it had been
decided to study the impact of force feeder on tablet
hardness. All he blend with diferent concentration had
been compressed using both the gravity feeder and force feeder respectively and it had been observed that the tablets produced using the gravity feeder had the better hardness whereas the tablets produced with force feeder had lesser hardness. Also the hardness is going on reducing with the time in case of blend having the lubricant concentration of 0.93%. Here granules were mixed inside the force feeder
area. The feeder speed had been kept at lowest possible speed to prevent the over lubrication however it had not been supported.
It has also been observed that, the tablets observed for 5-10 min of compression have good hardness and this hardness has decreased with time.
CONCLUSION
Granule size is very much important to obtain the
desired hardness of tablets. It has been established from the above experiments and have found that the 24C milled granules is capable of producing the good tablet
hardness in comparison to the 32R & 40G screen milled
granules. Maintained optimized granule size have helped TABLE VI - Compression data for trial no T2 and T3 (using force feeder) of 32R & 40G screen milled granules.
S
. N
o.
Trial No: T2 (with Force Feeder) -
32R passed granules Trial No: T3 (with Force Feeder) – 40G passed granules
Wt. V
ar
iati
on
(mg) @
10 r
p
m
H
ar
d
n
es
s
(k
p
)
Th
ic
k
n
es
s
(mm) Wt. V
ar
iati
on
(mg) @
15 r
p
m
H
ar
d
n
es
s
(k
p
)
Th
ic
k
n
es
s
(mm) Wt. V
ar
iati
on
(mg) @
20 r
p
m
H
ar
d
n
es
s
(k
p
)
Th
ic
k
n
es
s
(mm)
1 430.00 15.40 5.64 432.00 15.50 05.69 432.00 15.60 05.60
2 435.00 16.60 5.68 429.00 15.40 05.66 434.00 16.00 05.58
3 431.00 15.90 5.67 428.00 15.40 05.67 432.00 16.00 05.56
4 437.00 16.50 5.70 428.00 15.70 05.66 436.00 15.90 05.61
5 435.00 16.40 5.67 429.00 15.30 05.69 434.00 15.50 05.56
6 436.00 16.100 5.64 427.00 15.40 05.67 432.00 15.90 05.58
7 436.00 16.50 5.66 431.00 15.90 05.64 433.00 15.70 05.60
8 431.00 15.20 5.64 429.00 15.10 05.68 431.00 15.70 05.61
9 433.00 15.50 5.67 429.00 15.40 05.64 434.00 15.90 05.58
10 435.00 16.30 5.64 432.00 15.80 05.66 434.00 15.40 05.56
11 431.00 15.20 - 427.00 15.40 - 432.00 16.00
-12 432.00 14.90 - 430.00 15.00 - 433.00 15.40
-13 430.00 15.60 - 430.00 15.40 - 432.00 16.10
-14 428.00 15.70 - 429.00 15.00 - 434.00 16.50
-15 429.00 16.20 - 432.00 15.30 - 433.00 15.90
-16 431.00 15.90 - 426.00 15.80 - 435.00 15.60
-17 432.00 15.50 - 429.00 14.90 - 432.00 15.60
-18 435.00 15.30 - 430.00 15.60 - 436.00 15.20
-19 433.00 15.80 - 429.00 15.40 - 429.00 16.00
-20 431.00 16.00 - 429.00 15.60 - 432.00 15.70
-Min 428.00 14.90 5.64 426.00 14.90 5.64 429.00 15.20 5.56
in prevention of segregation of granules and also helped in reducing the weight variation and other downstream issues during compression.
The optimum concentration of lubricant in the formulation plays an important role to get the optimum tablets hardness of around 18 kp. Due to its hydrophobicity nature, it has formed a layer around the granules. This has prevented the granules to compact-tightly mass. Ultimately this has led to less hard tablets production. So, selection of lubricant concentration for the formulation is very much important for good hardness and aesthetic look is required. This ultimately requires supporting the
coating process, as this is next step. This also withstands tablets from attrition and jerk during the coating process for longer time.
Those tablets have not get optimum tablet hardness of about 18 kp, lead to abrasion at the tablet surface and finally the tablets produced with rough surface. The
optimum concentration of lubricant also afects the tablet
hardness when we are using the force feeder for mixing again and again. This leads to over lubrication.
Hence, it has been concluded that on using the optimum granules size and lubricant concentration in formulation, all the downstream problems can be resolved TABLE VII - Compression data for trial no T4A, T4B, T4C & T4D (using force feeder) of 24C screen milled granules
S
. N
o.
Trial No: T4 (with Force Feeder) – 24C screen milled granules
T4A
(0.23 % Mg. Stearate)
T4B
(0.47 % Mg. Stearate)
T4C
(0.70 % Mg. Stearate)
T4D
(0.93 % Mg. Stearate)
Wt. V ar iati on (mg) @ 20 r p m H ar d n es s (k p ) Th ic k n es s
(mm) Wt. V
ar iati on (mg) @ 20 r p m H ar d n es s (k p ) Th ic k n es s
(mm) Wt. V
ar iati on (mg) @ 20 r p m H ar d n es s (k p ) Th ic k n es s
(mm) Wt. V
ar iati on (mg) @ 20 r p m H ar d n es s (k p ) Th ic k n es s (mm)
1 428 25.60 05.49 430 26.70 05.49 430 21.9 05.51 426 16.10 05.50
2 427 27.10 05.47 428 26.60 05.48 428 20.1 05.50 428 16.30 05.49
3 430 25.30 05.50 426 27.00 05.49 426 22.4 05.48 427 16.30 05.47
4 431 24.90 05.49 427 25.10 05.47 431 21.7 05.49 430 16.10 05.48
5 430 25.60 05.48 430 24.70 05.47 430 22.5 05.47 428 16.70 05.51
6 428 24.80 05.48 428 25.30 05.48 430 20.7 05.48 426 16.30 05.50
7 426 26.10 05.49 429 25.60 05.51 428 21.6 05.49 428 15.90 05.51
8 427 25.30 05.47 426 23.90 05.50 426 20.9 05.48 426 15.60 05.50
9 430 25.80 05.52 430 24.70 05.48 428 21.2 05.49 428 15.00 05.49
10 428 24.90 05.51 428 24.90 05.49 427 21.9 05.47 427 15.30 05.48
11 429 26.10 05.49 427 25.10 05.47 430 21.0 05.50 430 15.90 05.49
12 430 26.00 05.48 430 24.70 05.48 428 21.9 05.49 428 15.70 05.47
13 428 27.10 05.51 428 24.90 05.51 426 20.6 05.48 426 15.60 05.48
14 426 26.10 05.49 427 25.60 05.50 428 21.4 05.48 428 16.20 05.51
15 431 26.50 05.52 431 26.00 05.49 426 20.5 05.49 431 15.90 05.50
16 430 26.10 05.48 430 25.70 05.48 428 21.6 05.47 433 15.70 05.49
17 428 25.80 05.47 428 25.10 05.50 431 21.6 05.50 427 14.90 05.48
18 426 25.90 05.52 431 26.10 05.51 433 20.6 05.51 430 15.40 05.50
19 430 24.90 05.51 429 26.50 05.50 429 21.6 05.50 431 15.80 05.49
20 428 24.50 05.50 428 25.80 05.51 427 21.2 05.52 430 15.90 05.50
Min 426 24.50 05.47 427 23.90 05.47 426 20.1 05.47 426 14.90 05.47
Max 431 27.10 05.52 431 27.00 05.51 433 22.5 05.52 433 16.70 05.51
Avg 429 25.70 05.49 429 25.50 05.49 429 21.3 05.49 428 15.80 05.49
and this in turn helps in compression of tablets and also provide the good hardness to the tablets.
ACKNOWLEDGEMENT
This research was partially supported by Banasthali University- Rajashthan, Shri Shankaracharya Institute of Pharmaceutical Sciences Bhilai and Dr. Reddy’s Laboratories Limited.
I am thankful to our colleagues Ram Kumar Sahu, Vellaian Karuppiah who provided expertise that greatly assisted the research, although they may not agree with all of the interpretations provided in this paper.
We are also grateful to Vellaian Karuppiah for assistance with Wet granulation technique, and Ram Kumar Sahu who moderated this paper and in that line
improved the manuscript signiicantly.
We are also immensely grateful to Dr. Rajani Chouhan and Dr. Jaya Dwivedi for their comments on earlier versions of the manuscript, although any errors are our own and should not tarnish the reputations of these esteemed professionals.
REFERENCES
Baddam MSR, Bandela S. Formulation and evaluation of albendazole sustained release matrix tablets using okra gum. Int J Res Pharm Biomed Sci. 2013;4(4):1344-1353.
Carr RL. Evaluating flow properties of solids. J Chem Eng. 1965;72:69-72.
Fayed ME, Otten L. Handbook of powder science & technology. 2nd ed. New York: Chapman & Hall; 1997. 898 p.
Hausner H H. Friction conditions in a mass of metal powder. Int J Powder Metal. 1967;3(4):7-13.
Hlinak AJ, Kuriyan K, Morris KR, Reklaitis GW, Basu PK. Understanding critical material properties for solid dosage form design. J Pharm Innov. 2006;1(1):12-17.
Jaiyeobaa KT, Oladiran OO. The effect of lubricants on the properties of chloroquine phosphate tablets. Drug Dev Ind Pharm.1983;9(1):267-283.
Shekunov BY, Chattopadhyay P, Tong HHY, Chow AHL. Particle size analysis in pharmaceutics: principles, methods and applications. Pharm Res. 2006;24(2):203-227.
Teixeira AZA. Hydroxy propyl cellulose controlled release tablet matrix prepared by wet granulation: effect of powder properties and polymer composition. Braz Arch Biol Technol. 2009;52(1):157-162.
United State Pharmacopoeia. USP. The National Formulary (USP 30-NF 25), The official compendium of standards. Asian edition. Rockville, MD: United State Pharmacopoeial Convention; 2007a. p. 1913-1914.
United States Pharmacopeia. USP. General chapter nº 1174. USP30 NF 25Pharmacopeia 616. Bulk density and tapped density. Rockville: USP; 2007b.
Received for publication on 12th November 2016