Comparison of Assessment Methods of Cardiac Vagal Modulation
Vagner Clayton de Paiva
1, Kelen Rabelo Santana
1, Bruno Moreira Silva
1, Plínio Santos Ramos
1,2, Júlio César Moraes
Lovisi, Claudio Gil Soares de Araújo
3,4, Djalma Rabelo Ricardo
1,2,3Faculdade de Ciências Médicas e da Saúde de Juiz de Fora - SUPREMA1; Hospital e Maternidade Therezinha de Jesus2, Juiz de Fora, MG; Programa de Pós-Graduação em Educação Física da Universidade Gama Filho3; Clínica de Medicina do Exercício - CLINIMEX4, Rio de Janeiro, RJ, Brazil
Abstract
Background: Several methods have been used to assess cardiac vagal modulation, but there are gaps regarding the association and accuracy of these methods.
Objective: To investigate the association between three valid, reproducible and commonly methods used to assess cardiac vagal modulation and compare their accuracies.
Methods: Thirty healthy men (23 ± 4 years) and 15 men with coronary artery disease (61 ± 10 years) were evaluated in counterbalanced design by Heart Rate Variability (HRV; variables: the time domain = pNN50, SDNN and RMSSD, the frequency domain HF = ms2 and HF n.u.), Respiratory Sinus Arrhythmia (RSA) and 4-second Exercise Test (4sET).
Thirty healthy men (23 ± 4 years) and 15 men with coronary artery disease (61 ± 10 years) were evaluated in counterbalanced order by Heart Rate Variability (HRV; variables: the time domain = pNN50, SDNN and RMSSD, the frequency domain HF = ms2 and HF n.u.), Respiratory Sinus Arrhythmia (RSA) and 4-second Exercise Test (4sET).
Results: Healthy subjects had higher vagal modulation by the three methods (p <0.05). There was a correlation in the healthy group (p <0.05) between the results of HRV (SDNN and pNN50 and RSA, but there was no correlation between the 4sET and the other two methods. In the group with coronary artery disease, there was a correlation between the results of HRV (pNN50, SDNN, RMSSD, HF ms2 and HF n.u.) and RSA. In addition, there was a correlation between the RSA and 4sET. Finally, the 4sET and RSA methods presented more accurate effect size and better accuracy (p <0.05), when compared to the HRV.
Conclusions: HRV and RSA generated partially redundant results in healthy subjects and in patients with coronary artery disease, while the 4sET generated results that were complementary to HRV and RSA in healthy subjects. In addition, RSA and 4sET methods were more accurate when discriminating cardiac vagal modulation between healthy subjects and patients with coronary artery disease, when compared to HRV. (Arq Bras Cardiol 2011;97(6):493-501)
Keywords: Autonomic nervous system; evaluation; heart rate; arrhythmia, sinus; exercise.
Correspondência: Djalma Rabelo Ricardo •
Alameda Salvaterra, nº 200 – Salvaterra - 36.033-003 - Juiz de Fora, MG, Brazil
E-mail: [email protected]
Artigo recebido em 28/02/11; revisado recebido em 08/08/11; aceito em 22/08/11.
usually recorded at rest10. Through the analysis of spectral
power, HRV allows the separate assessment of cardiac vagal modulation11. However, in general, reproducibility studies
show very heterogeneous results12.
Another method very often used in the literature is Respiratory Sinus Arrhythmia (RSA). It consists in the assessment of RR interval decrease in the inspiration and increase in the expiration, during a few deep and slow respiratory cycles8,13. The RSA has the advantage of
faster data collection and analysis. However, RSA does not evaluate cardiac vagal modulation alone, as its results depend in part on the sympathetic modulation14.
During exercise, several characteristics of the cardiovascular system become more evident in comparison with those at rest15. In this context, Araujo et al16 proposed
the 4-second Exercise Test (4sET), which consists in the assessment of RR interval decrease in the transition between rest and dynamic exercise, a response that occurs exclusively due to the rapid decrease of cardiac vagal modulation14,17,18. The 4sET was pharmacologically
validated14,18, has good reproducibility19, and data collection
and analysis are relatively simple.
Introduction
Autonomic dysfunction is characterized in part by decreased cardiac vagal modulation1-3, which can trigger
the onset4,5 and worsen the prognosis of cardiovascular
diseases2,6. Due to the importance of cardiac vagal
modulation, many methods have been validated for its assessment7-9. However, there is no reference standard
method to evaluate it, and there are gaps regarding the association between different methods, as well as the accuracy to discriminate differences in autonomic function, which hinders their clinical use and interpretation.
The method most frequently used in scientific studies to assess cardiac vagal modulation is the Heart Rate Variability (HRV)10. It consist in the analysis of the spontaneous
Considering the above, our goal was to investigate the association and accuracy of results obtained by the methods HRV, RSA and 4sET in healthy young subjects, who are expected to have healthy autonomic function, and in individuals with coronary artery disease, in whom a decrease in cardiac vagal modulation is expected.
Methods
Sample
The sample consisted of two groups of male individuals. The first group consisted of 30 subjects, mean age 23 ± 4 years (range 18 to 34 years) who had no diagnosed diseases, were non-smokers and did not use any drugs that might have affected the cardiovascular autonomic function. The second group consisted of 15 subjects, mean age 61 ± 10 years (range 44 and 81 years), all with coronary artery disease, treated in a private medical clinic, and most of them had already had one or more acute myocardial infarctions (Table 1). All individuals in the group with CAD had received a diagnosis of chronic coronary artery disease by a cardiologist after evidentiary examinations, such as scintigraphy and/or cardiac catheterization. Individuals from both groups had high socioeconomic and educational level and showed satisfactory protocol performance. All subjects read and signed a specific Free and Informed Consent Form before undergoing the procedures, according to Resolution 196/96 of the Ministry of Health, and the study was approved by the Institutional Research Ethics Committee, number 099/09.
Protocols
A clinical evaluation was initially carried out, consisting of clinical history, to identify previously diagnosed diseases and medication use, and evaluation of complementary examinations, in the case of the CAD group. Subjects were then instructed about the protocols they would be submitted to and then disposable electrocardiogram (ECG) electrodes were placed to record leads CM5 or CC5. The ECG was recorded throughout the tests with a sampling frequency of 1000 Hz (Powerlab 4/25 T and LabChart program, release 6, AD Instruments, Australia). Individuals from both groups underwent assessment with three methods (HRV, RSA and 4sET) in counterbalanced order. The tests were performed in the morning, at least one hour after breakfast, which consisted of a light meal.
The total duration of the entire procedure was approximately one hour, with at least a 5-minute interval between each procedure, in addition to the resting period of each specific procedure. The duration of RR intervals was measured using the LabChart program, release 6 (AD Instruments, Australia).
Heart Rate Variability
Subjects were assessed following the criteria recommended by the European Society of Cardiology and the American Society of Electrophysiology and Pacemakers10. The evaluation
was performed at rest in the supine position for a period of
15 minutes, with the first 5 minutes being used for RR interval stabilization and the subsequent 10 minutes for recording and further analysis.
During the recording period, subjects were instructed to breathe at a respiratory rate of 15 cycles/minute, following a metronome beep. Based on the ECG record, the intervals between R waves of sinus beats were identified, which were analyzed in the domain of time and frequency. In the time domain, the cardiac vagal modulation was assessed by the percentage of consecutive RR intervals that showed differences greater than 50 ms (pNN50), standard deviation of normal RR intervals (SDNN) and the square root of the mean squared differences between consecutive RR intervals (RMSSD).
The frequency domain analysis was performed using the Fast Fourier Transform. The spectral power density of the high frequency band (HF, 0.15 to 0.4 Hz) in absolute values (HF ms2) and normalized units (HF n.u.) was used as an index of
cardiac vagal modulation10. All tests were performed using the
heart rate variability analysis module of the LabChart program, release 6 (AD Instruments, Australia).
Respiratory Sinus Arrhythmia (RSA)
Subjects were evaluated in the supine position and remained at rest for at least 5 minutes for RR interval stabilization. The test consisted in breathing deeply and slowly at a frequency of six cycles/minute following a beep. To quantify the RSA, the ratio between the greatest RR interval during expiration (E) and the smallest RR interval during inspiration (I) was calculated, called E/I index8. The maneuver
was performed twice, with a one-minute duration each and with at least one minute interval between maneuvers. The E/I index used for further analysis was the highest value obtained in the two maneuvers.
4-Second Exercise Test (4sET)
The 4sET consisted in cycling as fast as possible on a cycle ergometer with no load, from the fourth to the eighth seconds of a maximal inspiratory apnea. During the test, subjects remained seated on the cycle ergometer. After RR interval stabilization at rest, four verbal commands were given, of which sequence was: (1) take a deep inspiration through the mouth, quickly and with the highest possible volume, (2) cycle as fast as possible, (3) suddenly stop cycling, and (4) perform expiration. To quantify the cardiac vagal modulation the RR interval immediately before or the first of the exercise, the longest one, and the shortest RR interval during the exercise, usually the last one, were identified and measured.
Then, the greatest RR interval was divided by the smallest one, resulting in an adimensional index, called the cardiac vagal index (CVI)14,16,18. Two 4sET maneuvers were performed
and the one with the highest CVI was used for analysis.
Statistical Analysis
deviation of the results of both groups of 0.5 arbitrary unit. Hence, it was identified that for the paired analysis with a significance level <0.05 and a power of 0.80, a sample size with 15 subjects in each group would be necessary. Next, we used the Shapiro-Wilks test to check the distribution of variables and the Levene test to check homogeneity of variances. The characteristics of the groups are shown as mean ± SD and the groups were compared by Student’s t test. The autonomic variables are shown as median ± interquartile difference and the two groups were compared by the Mann-Whitney test. Spearman’s correlation was used to quantify the association between the autonomic tests.
Cohen’s effect size was calculated to compare the ability of the methods to differentiate the groups. According to Hopkins et al20, the following parameters are considered to
interpret the magnitude of the effect size: between 0 and 0.19 = trivial; between 0.20 and 0.59 = small; between 0.60 and 1.19, moderate; between 1.2 and 1.99, large; and between 2.00 and 4.00, very large. If the confidence interval for the effect size did not allow the zero value, the results were considered significant. ROC curves were used to calculate sensitivity and specificity of the autonomic variables to differentiate the healthy and CAD groups. For all calculations, the statistical significance was set at p <0.05 in two-tailed analyses. Analyses were performed using STATISTICA, release 8 (StatSoft, USA) and MedCalc software programs, release 7.3.0.1 (MedCalc Software, Belgium).
Results
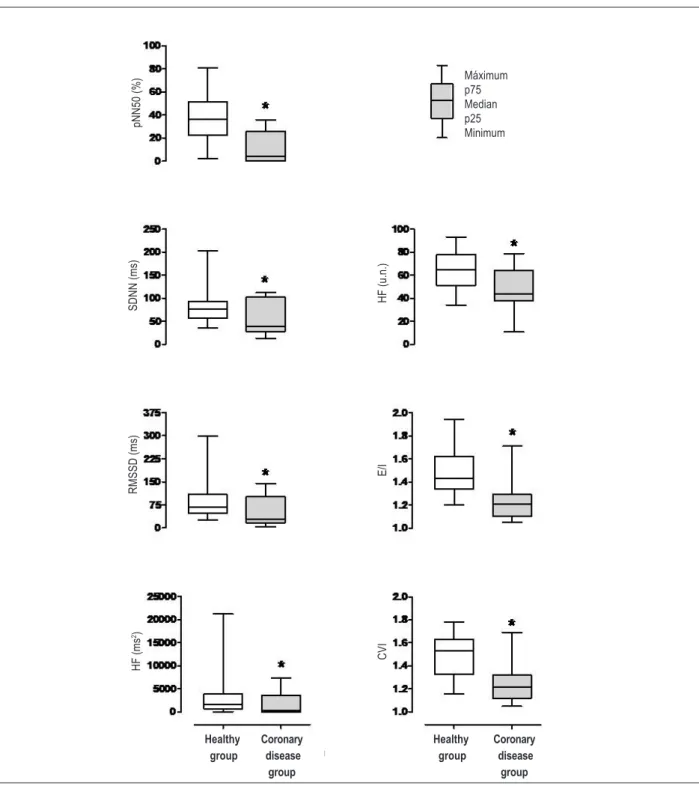
The group of healthy individuals were younger, had lower weight and Body Mass Index (BMI), when compared with the group of individuals with CAD (Table 1). Figure 1 shows the comparison of cardiac vagal modulation between the healthy and CAD groups. It can be observed that the group of healthy individuals showed significantly higher cardiac vagal modulation compared with the group with CAD for all studied variables. The power to identify significant differences for p <0.05 for each variable was: pNN50 = 0.93, SDNN = 0.57, RMSSD = 0.31, HF = 0.22 ms2, HF n.u. = 0.83, E/I = 0.92 and CVI = 0.92.
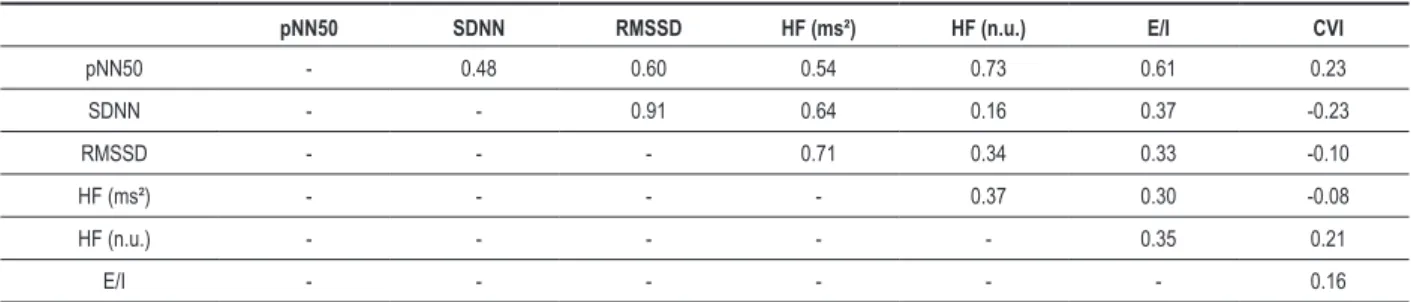
Regarding the association between methods of cardiac vagal modulation assessment in healthy subjects (Table 2) there was a correlation between the results obtained by HRV (SDNN and pNN50) and the RSA, but there was no correlation between the 4sET results and the results of the two other methods. In the group with CAD (Table 3) there was also a correlation between the results obtained by HRV (pNN50, SDNN, RMSSD, HF ms2 and HF n.u.) and RSA,
and there was no correlation between the results of 4sET and HRV. However, there was a correlation between the results of 4sET and RSA.
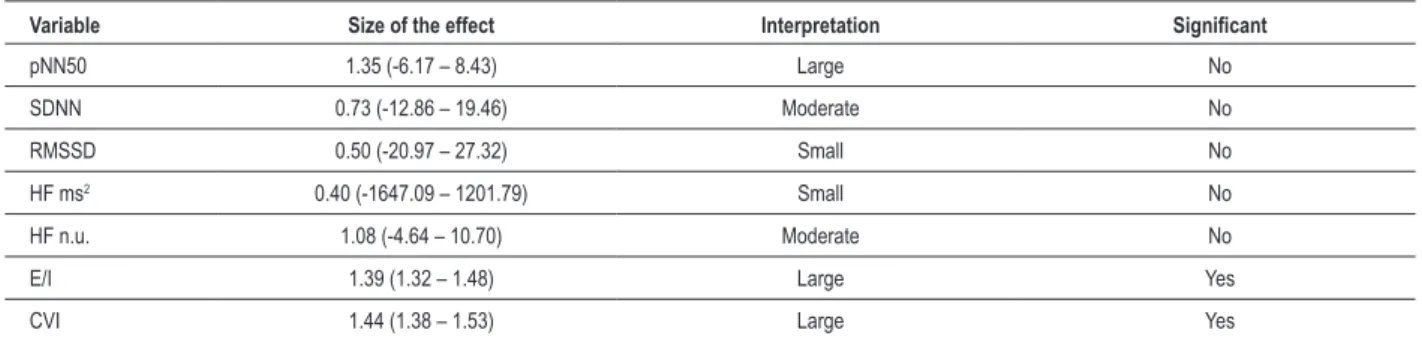
Table 4 shows that the effect size was larger, more accurate [lower confidence interval (CI)] and significant for the RSA and 4sET methods. The ROC curve analysis
Table 1 – Sample characteristics
Healthy Group (n = 30)
Group with Coronary disease
(n = 15) p
Age (years) 23 ± 4 61 ± 10 <0.001
Weight (kg) 74.1 ± 11.9 81.2 ± 9.3 0.04
Height (m) 1.76 ± 0.06 1.70 ± 0.07 0.01
BMI (kg/m2) 23.4 ± 2.5 28.6 ± 3.6 <0.001
HR at rest (bpm) 71 ± 10 65 ± 14 0.12
Clinical history
Diabetes - 1
Hypertension - 10
Dyslipidemia - 14
Smoking - 9
AMI - 14
Drug therapy
Antiplatelets - 15
Beta-blockers - 15
ACEI - 10
Nitrates - 4
Diuretics - 9
Calcium channel antagonists - 2
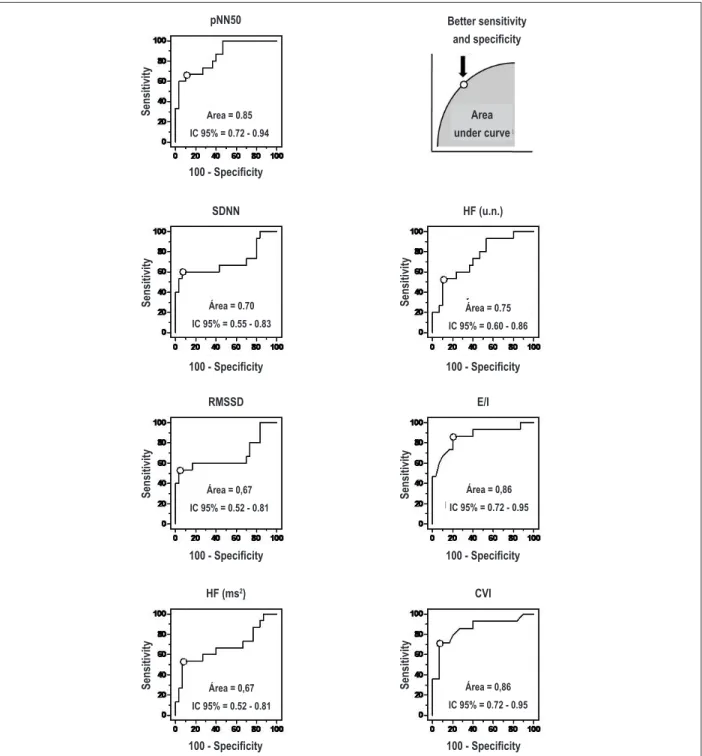
identified that the 5% value for the variable pNN50 showed 60% sensitivity (95% CI: 32 - 84) and 97% specificity (95% CI: 83 - 99). The value of 45 ms for the SDNN variable showed 66% sensitivity (95% CI: 32 - 84) and 93% specificity (95% CI: 78 - 99). The 29 ms value for the variable RMSSD showed 53% sensitivity (95% CI: 27 - 79) and 97% specificity (95% CI: 83 - 99). The 244 ms2
value for the HF ms2 variable showed 53% sensitivity (95%
CI: 27 - 79) and 93% specificity (95% CI: 78 - 99). The 44 value for the HF n.u. variable showed 53% sensitivity (95% CI: 27 - 79) and 90% specificity (95% CI: 73 - 98). The 1:32 value for the E / I variable showed 87% sensitivity (95% CI: 60 - 98) and 80% specificity (95% CI: 61 - 92). Finally, the value of 1.25 for the CVI variable showed 71% sensitivity (95% CI: 42 - 91) and 93% specificity (95% CI: 78 - 99).
Figure 2 shows the point of better sensitivity and specificity, in addition to the area under the cur
Table 5 shows the significance levels of comparison between the areas under the ROC curves. The area under the curve of the pNN50 variable was significantly higher when compared with the area under the curve of the SDNN, RMSSD and HF ms² variables. Additionally, the area under the curve of the E/I variable was significantly higher when compared with the area under the curve of the SDNN, RMSSD and HF ms² variables and the area
under the curve of the CVI variable was significantly higher, when compared with the area under the curve of the HF ms² variable. There was no difference between the areas of the E/I and CVI variables. Figure 2 shows the area under the curve values.
Discussion
the present study analyzed the association between three methods for cardiac vagal modulation assessment in two distinct groups. One group consisted of healthy young individuals with no previously diagnosed diseases, whereas the other group consisted of individuals with coronary artery disease and other associated diseases, who were older and whose BMI was significantly higher when compared with the group of healthy individuals. These differences in the characteristics of the two groups resulted in a higher cardiac vagal modulation in the healthy group, when compared with the group with CAD in the three methods used for vagal modulation assessment.
Therefore, these results corroborate the findings of other previous studies4,6 and indicate a decrease in vagal
autonomic modulation in the group with CAD. However, although the three methods showed that healthy individuals had higher vagal modulation, the analysis of association between the methods, the effect size, and the sensitivity
Table 3 – Coeficients of correlation between autonomic testes in the group with coronary disease
pNN50 SDNN RMSSD HF (ms²) HF (n.u.) E/I CVI
pNN50 - 0.76 0.81 0.86 0.49 0.70 0.51
SDNN - - 0.94 0.95 0.31 0.57 0.31
RMSSD - - - 0.99 0.52 0.63 0.39
HF (ms²) - - - - 0.51 0.68 0.45
HF (n.u.) - - - 0.66 0.37
E/I - - - 0.74
*, p < 0.05; pNN50 - percentage of consecutive RR intervals that showed differences greater than 50 ms; SDNN - standard deviation of normal RR intervals; RMSSD - square root of the mean squared differences between consecutive RR intervals; HF ms² - spectral power density of the high frequency band in absolute values; HF n.u. - spectral power density of the high frequency band in normalized units; E/I - expiration/inspiration ratio; CVI - cardiac vagal index .
Table 2 – Coeficients of correlation between autonomic testes in the healthy group
pNN50 SDNN RMSSD HF (ms²) HF (n.u.) E/I CVI
pNN50 - 0.48 0.60 0.54 0.73 0.61 0.23
SDNN - - 0.91 0.64 0.16 0.37 -0.23
RMSSD - - - 0.71 0.34 0.33 -0.10
HF (ms²) - - - - 0.37 0.30 -0.08
HF (n.u.) - - - 0.35 0.21
E/I - - - 0.16
and specificity, showed that there are some important differences in the results obtained with the studied methods. There was a significant association between HRV and RSA methods, both in the evaluation of the healthy group
and in the group with CAD, suggesting that the results of both are partially redundant. This association between HRV and RSA is probably attributed to a similarity between the physiological mechanisms that determine the results of both
Figure 1 – Comparison of cardiac vagal modulation assessed by three different methods in healthy individuals and patients with CAD. Results are shown as median, 25th
and 75th percentiles and minimum and maximum values. Variables obtained by the Heart Rate Variability (HRV) method: pNN50, SDNN, HF ms2 and HF n.u.; Variable
obtained by the Respiratory Sinus Arrhythmia (RSA) method: E/I; Variable obtained by the 4-second Exercise test (4sET): CVI. pNN50 - percentage of consecutive RR intervals that showed differences greater than 50 ms; SDNN - standard deviation of normal RR intervals; RMSSD - square root of the mean squared differences between consecutive RR intervals; HF ms² - spectral power density of the high frequency band in absolute values; HF n.u. - spectral power density of the high frequency band in normalized units; E/I - expiration/inspiration ratio; CVI - cardiac vagal index .
Maximum
Median
Minimum
Coronary disease group Healthy
group
Coronary disease group Healthy
group
Máximum p75 Median p25 Minimum
pN
N
50
(
%
)
S
D
N
N
(
m
s)
H
F
(
u.
n.
)
R
M
S
S
D
(
m
s)
H
F
(
m
s
2)
E
/I
C
V
methods, which would be the fluctuation of autonomic modulation in synchrony with the respiratory cycle, mediated by central neural mechanisms (neurons responsible for the respiratory rate) and peripheral (pulmonary stretch reflex, cardiopulmonary baroreceptors and chemoreflex)21-23.
In spite of the mentioned similarity between the HRV and RSA, it is noteworthy that HRV is an assessment of vagal modulation at rest and RSA consists in a respiratory maneuver that causes increased vagal modulation compared with rest. Probably for that reason, the RSA showed better sensitivity and specificity when compared with most of the variables obtained through the HRV, which is discussed in more details subsequently.
In the group of healthy subjects, there was no association between the 4sET and the other two methods. However, in the group with CAD, there was a significant association between the 4sET and RSA. The physiological mechanisms involved in 4sET are different from the mechanisms involved in HRV and RSA. In 4sET , there is a rapid withdrawal of cardiac vagal modulation at rest due to a redundant interaction between nerve impulses that converge in the brainstem from motor centers in the brain24,25 and from afferent nerve fibers (mainly
type III - mechanoreflex) coming from the skeletal muscles26,27.
Thus, the central and peripheral mechanisms inhibit cardiac vagal modulation, promoting an increase in heart rate.
In this context, the lack of association between 4sET and HRV and between 4sET and RSA in healthy subjects suggests that these methods evaluate the autonomic function of healthy individuals in different ways, and that their results are complementary, not redundant. There was, in turn, an association between RSA and 4sET in individuals with CAD, who had lower cardiac vagal modulation, suggesting that in the presence of low cardiac vagal modulation the results of 4sET and RSA tend to be closer, although these methods depend on different physiological mechanisms.
Other previous studies have also investigated the association between different methods to assess autonomic function in healthy subjects and in patients with CAD. For instance, Esco et al28 found no association between HRV
and Heart Rate Recovery (HRrec) after a maximal exercise test in a sample of healthy young subjects, whereas Evrengul et al29 found a significant association between HRV and in
HRrec in a sample of individuals with CAD. Ricardo et al3
evaluated the association between the results obtained by 4sET and HRrec in 544 asymptomatic subjects or individuals with coronary disease, aged 10 to 91 years. The authors observed that individuals with better autonomic function the results of 4sET and HRrec showed a lower association when compared with the results of individuals with lower autonomic function.
Table 4 – Size of the comparison effect between the healthy and coronary disease groups
Variable Size of the effect Interpretation Signiicant
pNN50 1.35 (-6.17 – 8.43) Large No
SDNN 0.73 (-12.86 – 19.46) Moderate No
RMSSD 0.50 (-20.97 – 27.32) Small No
HF ms2 0.40 (-1647.09 – 1201.79) Small No
HF n.u. 1.08 (-4.64 – 10.70) Moderate No
E/I 1.39 (1.32 – 1.48) Large Yes
CVI 1.44 (1.38 – 1.53) Large Yes
pNN50 - percentage of consecutive RR intervals that showed differences greater than 50 ms; SDNN - standard deviation of normal RR intervals; RMSSD - square root of the mean squared differences between consecutive RR intervals; HF ms² - spectral power density of the high frequency band in absolute values; HF n.u. - spectral power density of the high frequency band in normalized units; E/I - expiration/inspiration ratio; CVI - cardiac vagal index .
Table 5 – Levels of signiicance obtained by comparing areas under ROC curves
pNN50 SDNN RMSSD HF (ms²) HF (n.u.) E/I CVI
pNN50 - 0.02 <0.01 <0.01 0.09 0.77 0.75
SDNN - - 0.42 0.63 0.63 0.02 0.09
RMSSD - - - 1.00 0.39 0.01 0.07
HF (ms²) - - - - 0.39 0.01 0.04
HF (n.u.) - - - 0.08 0.14
E/I - - - 0.97
Another example is the study of Teixeira et al9, which
showed a significant association between the 4sET and the RR interval variability during a routine resting electrocardiogram in a heterogeneous sample of more than 1,000 individuals and the results of the two methods
showed better agreement in patients with lower cardiac vagal modulation. Therefore, the association between the results of RSA and 4sET only in individuals with CAD, observed in this study is consistent with the results of previous studies that compared methods for assessing
Figure 2 – ROC curves for variables pNN50, SDNN, RMSSD, HF ms², HF n.u., E/I and CVI. See legend in Figure 1 for description of abbreviations. Each of the ROC
curves highlights the point of best sensitivity and speciicity, in addition to the area under the curve and conidence interval (CI). pNN50 - percentage of consecutive RR intervals that showed differences greater than 50 ms; SDNN - standard deviation of normal RR intervals; RMSSD - square root of the mean squared differences between consecutive RR intervals; HF ms² - spectral power density of the high frequency band in absolute values; HF n.u. - spectral power density of the high frequency band in normalized units; E/I - expiration/inspiration ratio; CVI - cardiac vagal index .
S
ensitivity
Better sensitivity and speciicity
Area under curve
S
ensitivity
S
ensitivity
S
ensitivity Sensitivity
S
ensitivity
S
ensitivity
100 - Speciicity
100 - Speciicity
CVI HF (ms2)
E/I RMSSD
HF (u.n.) SDNN
pNN50
Area = 0.85
IC 95% = 0.72 - 0.94
Área = 0.70
IC 95% = 0.55 - 0.83
Área = 0.75
IC 95% = 0.60 - 0.86
Área = 0,67
IC 95% = 0.52 - 0.81
Área = 0,86
IC 95% = 0.72 - 0.95
Área = 0,67
IC 95% = 0.52 - 0.81
Área = 0,86
IC 95% = 0.72 - 0.95
100 - Speciicity
100 - Speciicity
100 - Speciicity
autonomic function in healthy subjects and patients with cardiovascular disease.
The effect size analysis showed that the 4sET and RSA methods differentiated with more accuracy the healthy and CAD groups. In addition, the ROC curve analysis showed that the pNN50 variable and RSA and 4sET methods showed significantly higher sensitivity and specificity when discriminating between cardiac vagal modulation in healthy subjects and with coronary artery disease, when compared with the other variables obtained by HRV.
As mentioned before, the mechanisms involved in RSA and 4sET are distinct. However, both use a maneuver to evaluate autonomic function (RSA - deep and slow respiratory cycles; 4sET - transition between rest and dynamic exercise), which differentiate them from the autonomic assessment performed at rest by HRV. Therefore, these results suggest that the use of a maneuver to assess cardiac vagal modulation shows more clearly the cardiac vagal control among individuals with different levels of vagal autonomic modulation.
The results of the present study should be interpreted considering some limitations. The sample size used in the study, although adequate for the design proposed to meet the study goals, was relatively small compared to some other similar studies in the literature. In turn, we used inclusion and exclusion criteria to select two well-defined samples, clearly different regarding clinical characteristics. Another limitation is the assumption that healthy individuals have healthy autonomic function and patients with CAD have decreased autonomic modulation. However, there is not a single method, or a set of methods, which is a reference standard to assess autonomic function and, based on the literature, selected samples should show the difference in autonomic function, as observed in the present study. Moreover, patients with CAD regularly used prescription drugs for the treatment of underlying diseases.
Therefore, it is likely that medications have influenced the results. However, the evaluation of patients in this manner increases the external validity of results, as well as
the clinical applicability of the study, as this is a situation similar to that found in clinical practice. Finally, although this study has assessed male individuals only, thus controlling the possible influence of variations in female hormones during the menstrual cycle in the case of young women, and menopause for middle-aged women, we cannot state that the degree of association between different methods of cardiac vagal assessment is identical in women, which should be the target of future studies.
Conclusions
Healthy subjects had higher cardiac modulation in all three methods studied (HRV, RSA and 4sET) compared with those with coronary artery disease. There was an association between the HRV and RSA methods both in healthy subjects and in patients with coronary artery disease, and between the RSA and 4sET methods only in patients with coronary disease. These results suggest that HRV and RSA generated partially redundant results in healthy subjects and in patients with coronary artery disease, while 4sET generated results complementary to HRV and RSA in healthy subjects. Furthermore, analysis of the effect size and ROC curves showed that the RSA and 4sET methods were more accurate to discriminate cardiac vagal modulation between healthy subjects and patients with coronary artery disease, when compared with HRV.
Potential Conflict of Interest
No potential conflict of interest relevant to this article was reported.
Sources of Funding
This study was partially funded by CNPq an FAPERJ.
Study Association
This study is not associated with any post-graduation program.
References
1. Kleiger RE, Miller JP, Bigger JT Jr, Moss AJ. Decreased heart rate variability and its association with increased mortality after acute myocardial infarction. Am J Cardiol. 1987;59(4):256-62.
2. La Rovere MT, Bigger JT Jr, Marcus FI, Mortara A, Schwartz PJ. Baroreflex sensitivity and heart-rate variability in prediction of total cardiac mortality after myocardial infarction. ATRAMI (Autonomic Tone and Reflexes After Myocardial Infarction) Investigators. Lancet. 1998;351(9101):478-84.
3. Ricardo DR, de Almeida MB, Franklin BA, Araújo CG. Initial and final exercise heart rate transients: influence of gender, aerobic fitness, and clinical status. Chest. 2005;127(1):318-27.
4. Chumaeva N, Hintsanen M, Hintsa T, Ravaja N, Juonala M, Raitakari OT, et al. Early atherosclerosis and cardiac autonomic responses to mental stress: a population-based study of the moderating influence of impaired endothelial function. BMC Cardiovasc Disord. 2010;10:16.
5. Brunetto AF, Roseguini BT, Silva BM, Hirai DM, Guedes DP. [Cardiac autonomic responses to head-up tilt in obese adolescents]. Rev Assoc Med Bras. 2005;51(5):256-60.
6. Cole CR, Blackstone EH, Pashkow FJ, Snader CE, Lauer MS. Heart-rate recovery immediately after exercise as a predictor of mortality. N Engl J Med. 1999;341(18):1351-7.
7. de Castro CL, da Nóbrega AC, de Araújo CG. [Autonomic cardiovascular tests: a critical review II]. Arq Bras Cardiol. 1992;59(2):151-8.
8. de Castro CL, da Nóbrega AC, de Araújo CG. [Autonomic cardiovascular tests: a critical review I]. Arq Bras Cardiol. 1992;59(1):75-85.
10. Heart rate variability: standards of measurement, physiological interpretation, and clinical use. Task Force of the European Society of Cardiology and the North American Society of Pacing and Electrophysiology. Circulation. 1996;93(5):1043-65.
11. Akselrod S, Gordon D, Ubel FA, Shannon DC, Berger AC, Cohen RJ. Power spectrum analysis of heart rate fluctuation: a quantitative probe of beat-to-beat cardiovascular control. Science. 1981;213(4504):220-2.
12. Sandercock GR, Bromley PD, Brodie DA. The reliability of short-term measurements of heart rate variability. Int J Cardiol. 2005;103(3):238-47.
13. Mehlsen J, Pagh K, Nielsen JS, Sestoft L, Nielsen SL. Heart rate response to breathing: dependency upon breathing pattern. Clin Physiol. 1987;7(2):115-24.
14. Araújo CG, Nóbrega AC, Castro CL. Heart rate responses to deep breathing and 4-seconds of exercise before and after pharmacological blockade with atropine and propranolol. Clin Auton Res. 1992;2(1):35-40.
15. Ramos PS, Araújo CG. Normotensive individuals with exaggerated exercise blood pressure response have increased cardiac vagal tone. Arq Bras Cardiol. 2010;95(1):85-90.
16. Araújo CG, Nóbrega AC, Castro CL. Vagal activity: effect of age, sex and physical activity pattern. Braz J Med Biol Res. 1989;22(7):909-11.
17. Fagraeus L, Linnarsson D. Autonomic origin of heart rate fluctuations at the onset of muscular exercise. J Appl Physiol. 1976;40(5):679-82.
18. Nóbrega AC, Castro CL, Araújo CG. Relative roles of the sympathetic and parasympathetic systems in the 4-s exercise test. Braz J Med Biol Res. 1990;23(12):1259-62.
19. Araújo CGS, Ricardo DR, Almeida MB. Intra and interdays reliability of the 4-second exercise test. Rev Bras Med Esporte. 2003;9(5):299-303.
20. Hopkins WG, Marshall SW, Batterham AM, Hanin J. Progressive statistics for studies in sports medicine and exercise science. Med Sci Sports Exerc. 2009;41(1):3-13.
21. Eckberg DL, Kifle YT, Roberts VL. Phase relationship between normal human respiration and baroreflex responsiveness. J Physiol. 1980;304:489-502.
22. Yasuma F, Hayano J. Respiratory sinus arrhythmia: why does the heartbeat synchronize with respiratory rhythm? Chest. 2004;125(2):683-90.
23. Grossman P, Taylor EW. Toward understanding respiratory sinus arrhythmia: relations to cardiac vagal tone, evolution and biobehavioral functions. Biol Psychol. 2007;74(2):263-85.
24. Williamson JW, Fadel PJ, Mitchell JH. New insights into central cardiovascular control during exercise in humans: a central command update. Exp Physiol. 2006;91(1):51-8.
25. Williamson JW, Nóbrega AC, Winchester PK, Zim S, Mitchell JH. Instantaneous heart rate increase with dynamic exercise: central command and muscle-heart reflex contributions. J Appl Physiol. 1995;78(4):1273-9.
26. Nóbrega AC, Williamson JW, Friedman DB, Araújo CG, Mitchell JH. Cardiovascular responses to active and passive cycling movements. Med Sci Sports Exerc. 1994;26(6):709-14.
27. Silva BM, Vianna LC, Oliveira RB, Ricardo DR, Araújo CG. Similar cardiac vagal withdrawal at the onset of arm and leg dynamic exercise. Eur J Appl Physiol. 2008;102(6):695-701.
28. Esco MR, Olson MS, Williford HN, Blessing DL, Shannon D, Grandjean P. The relationship between resting heart rate variability and heart rate recovery. Clin Auton Res. 2010;20(1):33-8.
![Table 4 shows that the effect size was larger, more accurate [lower confidence interval (CI)] and significant for the RSA and 4sET methods](https://thumb-eu.123doks.com/thumbv2/123dok_br/15563613.601683/3.892.63.774.166.585/table-effect-larger-accurate-confidence-interval-significant-methods.webp)