AMTD
2, 1351–1382, 2009Laboratory flow reactor with gas particle separation and on-line MS/MS
J. F. Bennett et al.
Title Page Abstract Introduction Conclusions References Tables Figures
◭ ◮
◭ ◮
Back Close Full Screen / Esc
Printer-friendly Version Interactive Discussion
Atmos. Meas. Tech. Discuss., 2, 1351–1382, 2009 www.atmos-meas-tech-discuss.net/2/1351/2009/ © Author(s) 2009. This work is distributed under the Creative Commons Attribution 3.0 License.
Atmospheric Measurement Techniques Discussions
Atmospheric Measurement Techniques Discussionsis the access reviewed discussion forum ofAtmospheric Measurement Techniques
A laboratory flow reactor with gas particle
separation and on-line MS/MS for product
identification in atmospherically
important reactions
J. F. Bennett1, F. Collin1,*, and D. R. Hastie1
1
Department of Chemistry and Centre for Atmospheric Chemistry, York University, 4700 Keele St., Toronto, Ontario, M3J 1P3, Canada
*
now at: Universit ´e Paris Descartes – CNRS UMR 8601, Paris, France Received: 12 May 2009 – Accepted: 24 May 2009 – Published: 3 June 2009 Correspondence to: D. R. Hastie ([email protected])
AMTD
2, 1351–1382, 2009Laboratory flow reactor with gas particle separation and on-line MS/MS
J. F. Bennett et al.
Title Page Abstract Introduction Conclusions References Tables Figures
◭ ◮
◭ ◮
Back Close Full Screen / Esc
Printer-friendly Version Interactive Discussion
Abstract
A system to study the gas and particle phase products from gas phase hydrocarbon oxidation is described. It consists of a gas phase photochemical flow reactor followed by a diffusion membrane denuder to remove gases from the reacted products, or a filter to remove the particles. Chemical analysis is performed by an atmospheric pressure
5
chemical ionization (APCI) triple quadrupole mass spectrometer. A diffusion mem-brane denuder is shown to remove trace gases to below detectable limits so the par-ticle phase can be studied. The system was tested by examining the products of the oxidation of m-xylene initiated by HO radicals. Dimethylphenol was observed in both the gas and particle phases although individual isomers could not be identified. Two
fu-10
ranone isomers, 5-methyl-2(3H)furanone and 3-methyl-2(5H)furanone were identified in the particulate phase, but the isobaric product 2,5 furandione was not observed. One isomer of dimethyl-nitrophenol was identified in the particle phase but not in the gas phase.
1 Introduction 15
The oxidation of volatile organic compounds in the atmosphere is a key chemical pro-cess in the production of tropospheric ozone and secondary organic particulate mat-ter. Tropospheric ozone has been shown to be a major component of photochemical smog and is responsible for significant negative human health impacts (Bernstein et al., 2004). Particulate matter is increasingly seen as a major environmental problem,
20
impacting climate, visibility and human health (Dockery et al., 1993; P ¨oschl, 2005; Krewski et al., 2004).
Secondary particulate matter is that formed by atmospheric gas phase reactions producing low vapour pressure products. Aside from the oxidation of sulphur dioxide and nitrogen oxides, the major contributor to secondary particulate matter is the
oxida-25
AMTD
2, 1351–1382, 2009Laboratory flow reactor with gas particle separation and on-line MS/MS
J. F. Bennett et al.
Title Page Abstract Introduction Conclusions References Tables Figures
◭ ◮
◭ ◮
Back Close Full Screen / Esc
Printer-friendly Version Interactive Discussion
carbon atoms does not produce significant amounts of condensable products under at-mospheric conditions, but larger hydrocarbons, particularly those that are unsaturated or aromatic can have high yields of condensable products.
To understand and potentially control particulate concentrations in the atmosphere requires a complete understanding of the chemical reactions occurring in their
pro-5
duction and the ability to incorporate this knowledge into computer based chemical-meteorological models of the atmosphere. Currently the production of secondary or-ganic particulate matter is not sufficiently well understood to meet this objective. While the rates of oxidation reactions of the parent hydrocarbons are generally well known, (Atkinson, 1989) the products of these reactions are not nearly as well known. This
10
is particularly true for the larger hydrocarbons as our knowledge of reaction products is mostly extrapolated from the large body of data on small molecule reactions but the larger molecules additionally undergo isomerization and cyclizations that cannot occur in the smaller molecules (Kroll and Seinfeld, 2008). This shortfall in product informa-tion has two direct impacts on our ability to construct chemical models. The reacinforma-tion
15
products undergo further reactions, and inclusion of these reactions requires knowl-edge of the identity and yields of all such compounds. Even more critical to the ability of the models to predict particle loading is the inclusion of the condensation of these products into the models. The strong dependence of vapour pressure on chemical structure means that the identification of products is a critical first step in improving the
20
predictions of particle production algorithms.
Reaction product identification is usually undertaken in laboratory systems by per-forming reactions under controlled conditions and applying qualitative and quantita-tive analytical methods to the reaction products. Optical spectroscopic methods, most notably fourier transform infrared (FTIR), are suitable for simple gas phase molecule
25
vol-AMTD
2, 1351–1382, 2009Laboratory flow reactor with gas particle separation and on-line MS/MS
J. F. Bennett et al.
Title Page Abstract Introduction Conclusions References Tables Figures
◭ ◮
◭ ◮
Back Close Full Screen / Esc
Printer-friendly Version Interactive Discussion
umes can easily be sampled and the collected compounds can then be desorbed, either thermally or using solvent, for gas or liquid chromatographic separation. Contin-uing advances in methods of preparing derivatives of target compounds (Claeys et al., 2007; Temime et al., 2007; Chiappini et al., 2006) and in chromatography, such as 2-D methods (Hamilton et al., 2005), continue to widen the classes of compounds that can
5
be analyzed. Mass spectrometry is now the most common chromatographic detector with MS/MS (Librando and Tringali, 2005) and MSn(Larsen et al., 2001) analysis being more widely applied.
On-line mass spectrometry has some significant advantages over other methods. It does not require sample work-up prior to analysis and is not restricted to particular
10
elements or functional groups. Instruments have very fast response times and high sensitivity so that integration times can be kept short allowing reaction products to be followed in real time. The only constraint for on-line mass spectrometry systems is that the sample must be presented to the ion source in the gas phase. This is easily achievable for gas phase products and can be extended to less volatile products by
15
using heated inlets and ion sources. The development of aerosol laser ablation meth-ods (Gard et al., 1997; Thomson et al., 2000; Pratt et al., 2009), the aerosol mass spectrometer (Drewnick et al., 2005; Allan et al., 2003), and PTR-MS (Hansel et al., 1995; Tanimoto et al., 2007) as routine robust instruments has provided mountains of data although the ionization methods in the first two of these are inherently destructive
20
limiting their use for compound identification. The inclusion of high resolution mass spectrometers has allowed single mass peaks to be assigned elemental composition but compound identification is still limited. The more benign chemical ionization meth-ods have been applied sparingly (Hearn and Smith, 2004; Warscheid et al., 2003; Hoff -mann et al., 2002; Asch-mann et al., 2002) with most of these using MS/MS methods
25
to improve chemical identification.
con-AMTD
2, 1351–1382, 2009Laboratory flow reactor with gas particle separation and on-line MS/MS
J. F. Bennett et al.
Title Page Abstract Introduction Conclusions References Tables Figures
◭ ◮
◭ ◮
Back Close Full Screen / Esc
Printer-friendly Version Interactive Discussion
ditions to those in the atmosphere, although analytical constraints often require exper-iments to be done at higher than ambient concentrations. They have large volumes and so there is ample material for analysis making them compatible with the filter and cartridge sampling. They have high volume to surface ratios that lower the importance of complicating wall reactions, and those that rely on sunlight as a light source more
5
closely mimic the real atmosphere. Long sample collection times are needed to collect enough material for most of the analytical methods, and this is usually done by passing the reaction mixture through a collection medium after a reaction has been stopped or has run to completion. This precludes following products through the course of the reaction, i.e. at different reaction times. By contrast, in a continuous flow reactor the
10
reagents enter from one end of the reactor and the reaction proceeds as the reactants flow down the tube. Thus the reaction only proceeds for a time determined by how long the gases spend in the reactor and so they provide complementary strengths to the batch reactor. They can be run for long periods under identical reaction conditions so that large amounts of sample representative of particular reaction conditions can
15
still be collected, but the sample can be analyzed for intermediate products. This is not usually possible in a batch reactor. Flow reactors are also valuable for on-line analyses that require acquisition times that are significant compared to the time for complete reaction.
The separation of particles from trace gases for independent analysis of both phases
20
is highly desirable. In particular, the observation of products in the gas phase can be used as a qualitative test of the knowledge of the vapour pressure of a compound and observations in both phases will test our knowledge of equilibrium in the particulate bound system. The particle phase can be easily removed from an air stream using a filter but the reverse problem is more taxing. Since gases have a much higher diffusion
25
AMTD
2, 1351–1382, 2009Laboratory flow reactor with gas particle separation and on-line MS/MS
J. F. Bennett et al.
Title Page Abstract Introduction Conclusions References Tables Figures
◭ ◮
◭ ◮
Back Close Full Screen / Esc
Printer-friendly Version Interactive Discussion
often a problem where surface absorption can saturate and since the surfaces can be active, gases can be emitted. Rejuvenating these surfaces once contaminated can be difficult. A viable alternative is a diffusion membrane denuder where the wall of the denuder is a membrane with essentially zero trace gas concentration on the other side so the trace gas diffuses out of the sample flow (Ruiz et al., 2006).
5
In this paper we describe a system to study the products of the reaction of atmo-spherically relevant hydrocarbons. This system was built to be versatile and incorpo-rates a number of the features described above. It is composed of a gas phase chem-ical flow reactor which has a UV source to initiate photochemchem-ical reactions. This is followed by a diffusion membrane denuder to remove gases from the reacted products,
10
or a filter to remove the particles. Finally the sample is introduced into the atmospheric pressure chemical ionization (APCI) source of a triple quadrupole mass spectrometer for analysis. To demonstrate the value of such a system we present some results from a study of the reaction of m-xylene with HO radicals.
2 Experimental
15
2.1 System description
A schematic diagram of the reaction system is shown in Fig. 1. Chemical reactions take place in a photochemical flow reactor. Particles or trace gases are selected for analysis by passing the sample through either a counter flow membrane denuder (CFMD) or a quartz fibre filter, respectively. Particle number is measured using a condensation
20
particle counter (CPC) and chemical analysis is performed using a triple quadrupole mass spectrometer.
2.1.1 Reactor
The reactor is set up for a continuous flow of air and reagents so the reaction time is constant for a particular experiment. Reactions take place in an 82 cm long and 6.5 cm
AMTD
2, 1351–1382, 2009Laboratory flow reactor with gas particle separation and on-line MS/MS
J. F. Bennett et al.
Title Page Abstract Introduction Conclusions References Tables Figures
◭ ◮
◭ ◮
Back Close Full Screen / Esc
Printer-friendly Version Interactive Discussion
in diameter cylindrical Pyrex reactor with quartz windows at each end. An air flow of 0.60 L min−1
is maintained through the reactor by a calibrated flow controller (MKS, Andover MA) to give a residence time of 4.5 min. A comparatively small flow of nitric oxide from a cylinder of 100 ppm NO in nitrogen is added to the air flow to produce an NO concentration of∼6 ppm in the reactor. The hydrocarbon reagent and the isopropyl 5
nitrite (IPN) radical source are added to the air stream at a known rate from individual vials via a syringe pump (Harvard Apparatus Holliston MA) to give nominal concentra-tions of 100 ppbv and 10 ppmv, respectively. The pressure in the cell is maintained at ambient pressure (typically 740 torr) and monitored by a baratron (MKS, Andover MA) pressure gauge.
10
Light for the photolysis of the IPN (see below) is provided by an Hanovia (1000 W) high pressure xenon arc lamp. This is an ozone free lamp with a UV cut off above 240 nm so ozone cannot be produced from the photolysis of oxygen. The radiation from the lamp raises the reactor temperature to approximately 26◦C.
The system under study was the oxidation of m-xylene initiated by HO radicals. The
15
HO radicals were produced photochemically through the photolysis of IPN and subse-quent reactions:
(CH3)2CHONO+hυ→(CH3)2CHO+NO (R1)
(CH3)2CHO+O2→(CH3)2CO+HO2 (R2)
HO2+NO→HO+NO2 (R3)
20
IPN was chosen as the photochemical HO source because the acetone ((CH3)2O) produced in Reaction (R2) is less reactive than the expected products of the m-xylene oxidation and so should have limited impact on the reaction system. Nitric oxide is added to ensure Reaction (R3) rapidly converts HO2 to HO. The photolysis of NO2 produces ozone through Reactions (R4) and (R5) but the high NO concentration keeps
25
its concentration low, through Reaction (R6):
AMTD
2, 1351–1382, 2009Laboratory flow reactor with gas particle separation and on-line MS/MS
J. F. Bennett et al.
Title Page Abstract Introduction Conclusions References Tables Figures
◭ ◮
◭ ◮
Back Close Full Screen / Esc
Printer-friendly Version Interactive Discussion
O+O2+M→O3+M (R5)
NO+O3→NO2+O2 (R6)
2.1.2 Separating gas and particles
Particles can be removed from the air stream by passage through a 25 mm in-line quartz fibre filter (Pallflex Tissuquartz, Pall, East Hills NY). We assume that the
par-5
ticulate matter on the filter remains in equilibrium with the gas phase species. Since the conditions in the flow reactor do not change within a particular experiment, this is a reasonable assumption.
Trace gases are removed from the air stream using a counter-current flow membrane denuder (CFMD). This follows that described by Ruiz et al. (2006) and a schematic
di-10
agram is shown in Fig. 2. The denuder consists of three machined aluminum blocks separated by membranes to give 90 cm long by 10 cm wide channels. The centre chan-nel is 1 cm deep and is for the sample gas, while the two outer chanchan-nels are 1.5 cm deep and are for the purified air. The PTFE membrane (Porex PM23J 2 micron pore size, 0.25 mm thickness, Fairburn GA) is supported on 90 mesh stainless steel for
me-15
chanical strength. Access to the sample and air channels are through Swagelok® tube to pipe thread unions. The sample and purified air flow through their respective chan-nels in opposite directions. Inconsistent denuder performance in early experiments was attributed to pressure differences across the membranes. This is now monitored by a differential pressure gauge (Omega PX2650-2BD5V±500 Pa, Stamford CT) con-20
nected between the central and one of the outer channels, so such problems can be readily identified.
The performance of the CFMD can be estimated assuming a laminar flow in the centre channel and that the transmission of molecules is through a rectangular cross section tube with perfectly adsorbing walls. The concentration at the walls will never
25
AMTD
2, 1351–1382, 2009Laboratory flow reactor with gas particle separation and on-line MS/MS
J. F. Bennett et al.
Title Page Abstract Introduction Conclusions References Tables Figures
◭ ◮
◭ ◮
Back Close Full Screen / Esc
Printer-friendly Version Interactive Discussion
positions. For the ideal case the fraction of particles passing through the denuder, com-monly called the penetrationPn, can be determined from the dimensionless parameter
µusing the equations in Soderholm (1979) as modified in Zhang (2005).
µ= 8DpLW
3QH (1)
whereH,W, andLare the height, width and length of the centre channel, respectively,
5
Qis the flow rate through the channel andDpis the diffusion coefficient for the particle in air.
Pn =
nout
nin =
1−1.526µ
2
3 +0.15µ+0.0342µ 4
3 for µ <0.05 (2)
or
Pn =0.9104 exp(−2.8278µ)+0.0531 exp(−32.147µ) (3) 10
+0.01528 exp(−93.475µ)+0.00681 exp(−186.805µ) for µ >0.05
Some representative calculations using the above assumptions are presented in Ta-ble 1. The two lowest diameters represent gas molecules of nitrogen and a molecule with a mass 20 times higher, with the remaining entries encompassing representative atmospheric particle sizes. The table shows less than 1% of trace gases exit the centre
15
channel of the denuder but that more than 80% of particles of diameter greater than 0.015µm will be transmitted.
The denuder has been designed to effectively remove the trace gases. It could, however, also remove material that evaporates offthe particles in the CFMD. Maxwell’s equation (Hinds, 1999) can be used to estimate the loss of material. For a pure solvent
20
AMTD
2, 1351–1382, 2009Laboratory flow reactor with gas particle separation and on-line MS/MS
J. F. Bennett et al.
Title Page Abstract Introduction Conclusions References Tables Figures
◭ ◮
◭ ◮
Back Close Full Screen / Esc
Printer-friendly Version Interactive Discussion
species at the droplet surfacepsand the ambient gas pressurepl (assumed to be zero here).
I= 2πDpMd
RT (ps−pl) (4)
For a 70 nm particle made up of a compound of molar mass=100 g/mol with a satu-rated vapour pressure ofps=1×10⁻¹⁰atm (0.1 ppbv) at 298 K, the loss rate from the 5
particle is approximately 0.12% s−1. For such a compound up to 10% of the original material will be lost to evaporation in this system. Thus this system is not optimized to preserve particle mass, but is perfectly adequate for qualitative product identification.
2.1.3 In-line heater
Particles can be heated to drive volatile compounds from the particle phase into the
10
gas phase for analysis by the mass spectrometer. The heater is an 8 cm long by 1/4 in nominal diameter quartz tube surrounded by a heating coil controlled by an in house proportional thermocouple heater controller.
2.1.4 Triple quadrupole mass spectrometer
Chemical identification of the reagents and reaction products was undertaken by an
15
APCI triple quadrupole mass spectrometer (TAGA 6000E, MDS Sciex, Dawson et al., 1982). This instrument is configured for atmospheric trace gas analysis and to obtain the required flow through the ion source the sample flow is diluted with purified air. For particle phase measurements the inlet to the instrument was heated to evaporate partially volatile species for analysis. Ionization is achieved by a corona discharge in
20
the sample gas. Since this takes place in air, and the instrument is being used in the positive ion mode, the relevant primary ions produced in the corona discharge are N+2 and O+2 which in the presence of water vapour produce intermediate ions (H3O+(H2O)n
AMTD
2, 1351–1382, 2009Laboratory flow reactor with gas particle separation and on-line MS/MS
J. F. Bennett et al.
Title Page Abstract Introduction Conclusions References Tables Figures
◭ ◮
◭ ◮
Back Close Full Screen / Esc
Printer-friendly Version Interactive Discussion
hydrated hydronium ion so proton transfer to produce an ion of molar mass plus 1 amu (M+H)+ is energetically favoured. For hydrocarbons with much lower proton affinities charge transfer to produce a true molecular ion (M+) is favoured. Thus the APCI source produces M+ and (M+H)+ ions in high numbers with limited fragmentation. The high pressure in the APCI source allows both ion molecule reactions to produce higherm/z
5
ions and fragmentation to produce smaller ions. Typically the ion molecule reactions give addition products (often referred to as clusters). In addition to clusters with water, (Good et al., 1970a, b) protonated ions of general formula (M1HM2)+where M1and M2 may be the same or different species are observed. The most prominent form of this cluster in the current study involves the highly abundant acetone with other products.
10
Fragmentation in the ion source has been shown to interfere with some MS/MS spectra but its impact on the spectra and compound identification is small.
In this work the instrument was used in both the MS and MS/MS modes. In the MS mode one of the quadrupoles (Q1) scans the mass spectrum of the sample and the other quadrupoles are set to transmit ions resulting in a conventional mass
spec-15
trum. This spectrum is used for the preliminary identification of molecular and cluster species. Since most organic compounds give primarily the M+ and (M+H)+ ions and the target products can have the same molecular weight the mass spectrum alone cannot be used to identify isobaric (same molar mass) species. Therefore the MS spectrum can only be used to indicate possible molecular and cluster species. True
20
product identification requires the tandem or MS/MS mode to give structural informa-tion on the target ion and allows more definitive assignment of the peaks in the MS spectrum. In this mode a single target ion is selected in the first quadrupole. It is then injected into the second quadrupole with a known and controllable energy. This quadrupole contains argon at comparatively high pressures so that the target ion can
25
AMTD
2, 1351–1382, 2009Laboratory flow reactor with gas particle separation and on-line MS/MS
J. F. Bennett et al.
Title Page Abstract Introduction Conclusions References Tables Figures
◭ ◮
◭ ◮
Back Close Full Screen / Esc
Printer-friendly Version Interactive Discussion
prior to entering the collision cell, as stronger bonds require higher collision energies to produce characteristic fragments from this bond cleavage.
2.1.5 Other instrumentation
Particle numbers were counted using a condensation particle counter (CPC Model 3775, TSI Shoreview MN). For determining size distributions a differential mode
5
analyzer (Model 3071 TSI Shoreview MN) was used to size select particles prior to counting.
2.1.6 Reagents
M-xylene (Sigma Aldrich, Toronto 99+%) was used as received. Isopropyl nitrite was prepared in house (Noyes, 1936) and used without distillation. Air was obtained by
pu-10
rifying room air with an AADCO 737-11 operating without a methane catalyst (AADCO, Cleves OH). Nitric oxide came from cylinders of 103 ppm NO in nitrogen (Air Liquide Toronto).
2.2 Characterization of the system
2.2.1 Reactor 15
The concentration of m-xylene was followed by the MS/MS signal originating from the (M+H)+ ion atm/z107 fragmenting to the ion atm/z92 (written asm/z107→92). With the configuration described above, the production of HO radicals and the reaction time of 4.5 min resulted in the reactive loss of approximately 50% of the m-xylene.
Particle production was confirmed using the condensation particle counter and
typi-20
AMTD
2, 1351–1382, 2009Laboratory flow reactor with gas particle separation and on-line MS/MS
J. F. Bennett et al.
Title Page Abstract Introduction Conclusions References Tables Figures
◭ ◮
◭ ◮
Back Close Full Screen / Esc
Printer-friendly Version Interactive Discussion
2.2.2 CFMD
Trace gas removal and the mass balance in the CFMD, were determined using gas phase mixtures of 1-hydroxy-2-propanone (acetol). This compound was chosen pri-marily because it was a small multifunctional organic with a useable vapour pressure. Flowing air over a liquid acetol sample and further diluting with air produced an air
5
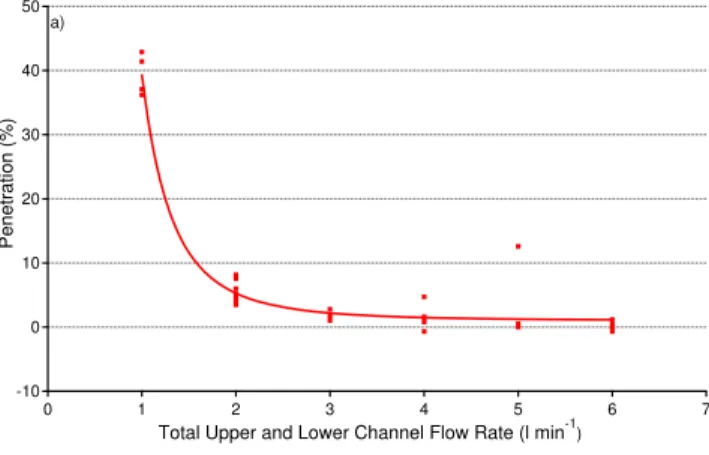
stream containing approximately 100 ppm of the acetol. The relative concentrations of the acetol were determined using the TAGA 6000 mass spectrometer in the MS mode by monitoring the protonated acetol atm/z75. Figure 3 shows the penetration of the acetol through the centre channel. In Fig. 3a a fixed flow of 0.6 l min−1 was passed through the centre channel and the penetration was determined as a function of the
10
air flow in the outer channels. For flows greater that 2 l min−1 there is no measurable acetol left in the centre channel air stream. In Fig. 3b the outer channel flow is main-tained at 6 l min−1
and the centre channel flow varied. No acetol is detected for centre channel flows less than 1 L min−1.
To ensure the trace gas was being removed by diffusion into the outer channel air
15
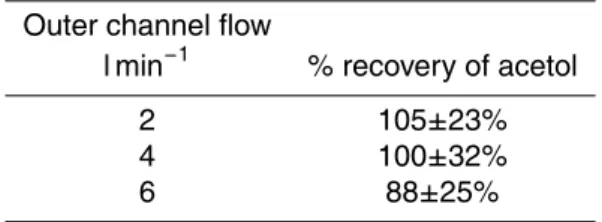
flow, and not simply adsorbing onto the surfaces of the CFMD, three mass balance experiments were conducted. The concentration of acetol leaving the outer channel of the CFMD was measured and expressed as a percentage of that admitted to the centre channel; the results are presented in Table 2. Admitting the higher flow rates to the dilution system of the TAGA lowers the stability of the measurements so the results
20
are more scattered, however the recovery of the trace gas is within error of 100%. This indicates that adsorption of the trace gas is not a significant loss mechanism, even for a polar oxygenated gas. The conclusion of the gas phase experiments is that for centre channel flows of∼0.6 l min−1and outer channel flows of 6 l min−1the trace gas removal by diffusion gives a sample flow where the trace gas signal is below detectable levels.
25
AMTD
2, 1351–1382, 2009Laboratory flow reactor with gas particle separation and on-line MS/MS
J. F. Bennett et al.
Title Page Abstract Introduction Conclusions References Tables Figures
◭ ◮
◭ ◮
Back Close Full Screen / Esc
Printer-friendly Version Interactive Discussion
resulting droplets were passed through a diffusion dryer containing silica gel which de-creased the relative humidity of the aerosol stream to 33–40%, and through a Po-210 charge neutralizer. The particles were passed through the reactor and the size distri-bution showed broad polydisperse aerosol with a maximum at 35 nm. Therefore these particles are much smaller than those generated by reaction and so provide a more
5
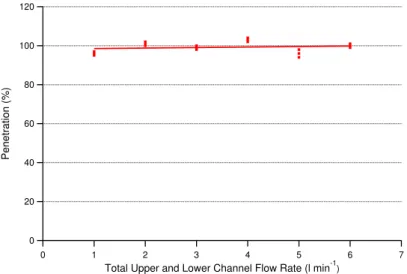
stringent test of the CFMD using particles that were inert and did not evaporate. Of this flow, 0.6 l min−1 was admitted to the central channel of the CFMD with between 1 and 6 l min−1of purified air in the outer channels. The total number of particles
bypass-ing, or penetrating through the CFMD was measured by the CPC. The penetration of particles through the denuder is shown in Fig. 4 which shows that the particle
penetra-10
tion is indistinguishable from 100% for our experimental conditions.
2.2.3 In-line heater
The in-line heater was tested on reaction product particles to ensure it could evaporate at least the more volatile material into the ion source. Two particles sizes were sampled by a DMA from those leaving the reactor: 120 and 190 nm. The effect of the heater
15
temperature on the size distribution for the 190 nm particles is shown in Fig. 5. As the temperature of the heater was increased the diameter and the number of particles decreased, with mean sizes dropping to 50 and 70 nm by 200◦C. The volume, and
therefore mass, decreased markedly by 40% when the heater was raised by 100◦C and by 97% at 200◦C. Thus for these non seeded particles most of the mass is available
20
for analysis provided there is efficient transfer from the heater to the ion source of the mass spectrometer.
3 Application to the analysis of m-xylene oxidation products
The system has been tested in a study of the oxidation products of the HO initiated oxidation of m-xylene. Within a single experiment, chemical analysis was performed
AMTD
2, 1351–1382, 2009Laboratory flow reactor with gas particle separation and on-line MS/MS
J. F. Bennett et al.
Title Page Abstract Introduction Conclusions References Tables Figures
◭ ◮
◭ ◮
Back Close Full Screen / Esc
Printer-friendly Version Interactive Discussion
on both trace gas and particle phases. The filtered gas phase products were sampled directly into the TAGA. Alternatively, the particulate phase sample from the CFMD was heated to 100◦C prior to admission to the ion source.
The first step in product identification was to perform an MS mode scan to obtain the mass spectrum of all the ions generated by the APCI source, with true product
5
identification coming from the MS/MS mode. Figure 6 shows the MS spectra of the particle phase and gas phase reaction products and the unreacted reagents (in the absence of light) each normalized to the highest signal. The spectra are vastly different, but both gas and particle spectra show significant numbers of ions with m/z greater than the m-xylene (M+H)+ ion at m/z107. Thus there are multiple ions on which to
10
base product studies.
To test the utility of this system we applied MS/MS to three reaction products, of which each has potentially more than one isomer: dimethylphenol (MM=122), methyl-furanone (MM=98) and dimethyl-nitrophenol (MM=167). At least some of each of these isomers has been previously identified as particulate phase products of smog chamber
15
m-xylene oxidation (Forstner et al., 1997).
The dimethylphenol products result from HO radical addition to the aromatic ring fol-lowed by reaction with O2 or NO2 (Atkinson, 1989; Andino et al., 1996). Andino et al. (1996) suggest the most favourable addition would be ortho to one of the methyl groups with the addition to the 2 position, to produce the 2,6-dimethylphenol slightly
20
more favoured over addition to the 4 position, to produce the 2,4-dimethylphenol. Forstner et al. (1997) identified primarily the 2,4 isomer with a below quantifiable amount of the 2,6 isomer. These products would be expected to be more likely found in the particle phase than the m-xylene as they are more polar and so would have a lower vapour pressure.
25
The primary ion from dimethylphenol is expected to be the protonated parent at
AMTD
2, 1351–1382, 2009Laboratory flow reactor with gas particle separation and on-line MS/MS
J. F. Bennett et al.
Title Page Abstract Introduction Conclusions References Tables Figures
◭ ◮
◭ ◮
Back Close Full Screen / Esc
Printer-friendly Version Interactive Discussion
at three collision energies from the particle phase sample, the gas phase sample, and the headspace gas above authentic samples of 2,6 and 2,4 dimethylphenol are shown in Fig. 7. The MS/MS spectra of the 2,4 and the 2,6 dimethylphenol isomers are not sufficiently different to be useful in distinguishing between the isomers. The major ion peaks in the trace gas spectrum (b), namelym/z121, 107, 79, and 77, and their
vari-5
ation with collision energy are the same as those in the authentic samples indicating the presence of at least one isomer of dimethylphenol in the gas phase. Based on the same ions, at least one isomer of dimethylphenol is also indicated by the particle phase spectrum. The increased prevalence of the m/z43 ion in the particle phase spectrum remains unexplained. Somewhat surprisingly, removing the heating had little
10
impact on the observed particle phase spectrum. The gas phase product leaving the reactor would have been removed by the CFMD and assuming the particulate phase is not directly vaporized and ionized in the ion source, this signal must originate from gas phase dimethylphenol that evaporates from the particle phase in the CFMD and in the transfer line to the ion source. This is consistent with the high vapour pressures of
15
these compounds, 1.7×10⁻⁴atm (170 ppmv) at 25◦C (CRC handbook). It is also con-ceivable that these signals could have come directly from particulate phase product entering the ion source. However, this signal still remained despite placing a filter after the CFMD to remove the particulate phase products. This confirms the evaporation of particle phase dimethylphenol occurred in the CFMD, the transfer lines or from filter
20
bound particulate matter.
There are two previously identified methyl-furanones: 5-methyl-2(3H)furanone and 3-methyl-2(5H)furanone (Forstner et al., 1997). These are 5 carbon species resulting from aromatic ring opening followed by a 3 carbon fragment loss and subsequent cy-clization. Although of a lower mass than the dimethylphenols these products would
25
also be expected to be present in the particle phase because the multiple functionality would encourage a lower vapour pressure.
AMTD
2, 1351–1382, 2009Laboratory flow reactor with gas particle separation and on-line MS/MS
J. F. Bennett et al.
Title Page Abstract Introduction Conclusions References Tables Figures
◭ ◮
◭ ◮
Back Close Full Screen / Esc
Printer-friendly Version Interactive Discussion
and gas phase samples compared with that from the headspace gas above authentic sample of 3-methyl-2(5H)furanone and 5-methyl-2(3H)furanone along with a likely iso-baric product, 2,5 furandione identified by Forstner et al. (1997). The authentic samples of the methyl-furanones (Fig. 8c and d) show fragment peaks atm/z98, 71, 53 and 43, and the furandione shows fragments atm/z71, 45, and 27. The reaction gas products
5
show only a single fragment ion atm/z43. Therefore there is no evidence for either of the methyl-furanones or the furandione in the gas phase reaction products. The MS/MS spectra of the particulate phase products, in Fig. 8a, show the same fragment peaks as both methyl-furanone isomers. This is compelling evidence for the presence of at least one of the methyl-furanones. Furthermore there are small differences in the
10
MS/MS spectra of the isomers that allow clarification of the reaction product identity. The peak atm/z57 observed in the sample only appears in the MS/MS spectrum of the 5-methyl-2(3H)furanone and the high relative intensity atm/z71 in the spectrum deter-mined at 10 eV of the compound both confirm the presence of this isomer. The peak at
m/z41 only appears in the MS/MS of the 3-methyl-2(5H)furanone at collision energies
15
greater than 20 eV confirming its presence. Identifying or eliminating, 2,5 furandione as a possible product requires a unique signature of the furandione. The spectra of the furandione shows a peak atm/z27 that is present at all collision energies with the other major fragment peak atm/z45 appearing in the 20 eV spectrum and being dominant at 30 eV. Each of thesem/z peaks are very small contributors to the methyl-furanone
20
spectra. In the sample spectra there is no measurable contribution atm/z27 at 10 eV collision energy andm/z45 is a very small contributor at 20 and 30 eV. It is never pos-sible to exclude a product with this kind of analysis, it would appear that there is no measurable 2,5 furandione in the sample, but both furanone isomers are present in the particulate phase samples.
25
AMTD
2, 1351–1382, 2009Laboratory flow reactor with gas particle separation and on-line MS/MS
J. F. Bennett et al.
Title Page Abstract Introduction Conclusions References Tables Figures
◭ ◮
◭ ◮
Back Close Full Screen / Esc
Printer-friendly Version Interactive Discussion
lower vapour pressure.
The dominant ion from the only available authentic sample of dimethyl-nitrophenol, 2,6-dimethyl-4-nitrophenol, is the protonated molecule at m/z168. Figure 9 shows the MS/MS spectrum ofm/z168 from the particulate phase reaction mixture, the gas phase and that from the headspace gas above authentic samples of the
2,6-dimethyl-5
4-nitrophenol. The 10 eV spectrum of the gas phase sample shows an indication of dimethyl-nitrophenol but generally there was insufficient signal at m/z168 to reliably ascribe its presence, as in the 20 and 30 eV spectra shown. The MS/MS spectrum from the particulate phase reaction products shows spectra that have all the major peaks, 151, 122, 121, 91, 76 over all the collision energies of the authentic sample.
10
Hence it appears that the nitrophenol is only consistently observable in the particulate phase samples. There is no evidence for evaporation of this product in the CFMD or in the transfer lines.
4 Conclusions
The reactor, gas/particle separator system coupled to a triple quadrupole mass
spec-15
trometer has been shown to be a valuable tool for identifying reaction products of at-mospherically important reactions.
Acknowledgements. This work was done with support from the National Sciences and En-gineering Research Council of Canada (NSERC), the Canadian Foundation for Climate and Atmospheric Sciences (CFCAS), and the Ontario Ministry of the Environment. Contributions
20
from J. Auld, N. Karellas, and J. Merritt are gratefully acknowledged.
References
Allan, J. D., Jimenez, J. L., Williams, P. I., Alfarra, M. R., Bower, K. N., Jayne, J. T., Coe, H., and Worsnop, D. R.: Quantitative sampling using an aerodyne aerosol mass spectrometer: 1. techniques of data interpretation and error analysis, J. Geophys. Res.-Atmos., 108, 4090,
25
AMTD
2, 1351–1382, 2009Laboratory flow reactor with gas particle separation and on-line MS/MS
J. F. Bennett et al.
Title Page Abstract Introduction Conclusions References Tables Figures
◭ ◮
◭ ◮
Back Close Full Screen / Esc
Printer-friendly Version Interactive Discussion Andino, J. M., Smith, J. N., Flagan, R. C., Goddard III, W. A., and Seinfeld, J. H.: Mechanism of
atmospheric photooxidation of aromatics: A theoretical study, J. Phys. Chem., 100, 10967– 10980, 1996.
Aschmann, S. M., Atkinson, R., and Arey, J.: Products of reaction of OH radicals with alpha-pinene, J. Geophys. Res.-Atmos., 107, 4191, doi:10.1029/2001JD001098, 2002.
5
Atkinson, R.: Kinetics and Mechanisms of the Gas-Phase Reactions of the Hydroxyl Radical with Organic Compounds, Journal of physical and chemical reference data. Monograph; no. 1, Published by the American Chemical Society and the American Institute of Physics for the National Institute of Standards and Technology, New York, USA, 1989.
Bernstein, J. A., Alexis, N., Barnes, C., Bernstein, I. L., Bernstein, J. A., Nel, A., Peden, D.,
10
Diaz-Sanchez, D., Tarlo, S. M., and Williams, P. B.: Health effects of air pollution, J. Allergy Clin. Immun., 114, 1116–1123, 2004.
Chiappini, L., Perraudin, E., Durand-Jolibois, R., and Doussin, J. F.: Development of a supercrit-ical fluid extraction-gas chromatography-mass spectrometry method for the identification of highly polar compounds in secondary organic aerosols formed from biogenic hydrocarbons
15
in smog chamber experiments, Anal. Bioanal. Chem., 386, 1749–1759, 2006.
Claeys, M., Szmigielski, R., Kourtchev, I., Van der Veken, P., Vermeylen, R., Maenhaut, W., Jaoui, M., Kleindienst, T. E., Lewandowski, M., Offenberg, J. H., and Edney, E. O.: Hy-droxydicarboxylic acids: Markers for secondary organic aerosol from the photooxidation of α-pinene, Environ. Sci. Technol., 41, 1628–1634, 2007.
20
Dawson, P. H., French, J. B., Buckley, J. A., Douglas, D. J., and Simmons, D.: The use of triple quadrupoles for sequential mass spectrometry: 2-A detailed case study, Org. Mass Spectrom., 17, 212–219, 1982.
Ding, Y. M., Pang, Y. B., Eatough, D. J., Eatough, N. L., and Tanner, R. L.: High-volume diffusion denuder sampler for the routine monitoring of fine particulate matter: II. field evaluation of
25
the PC-BOSS, Aerosol Sci. Tech., 36, 383–396, 2002.
Dockery, D., Pope, C. A., Xu, X., Spengler, J., Ware, J., Fay, M., Ferris, B., and Speizer, F.: An association between air pollution and mortality in six U.S. cities, N. Engl. J. Med., 329, 1753–1759, 1993.
Drewnick, F., Hings, S. S., DeCarlo, P., Jayne, J. T., Gonin, M., Fuhrer, K., Weimer, S., Jimenez,
30
AMTD
2, 1351–1382, 2009Laboratory flow reactor with gas particle separation and on-line MS/MS
J. F. Bennett et al.
Title Page Abstract Introduction Conclusions References Tables Figures
◭ ◮
◭ ◮
Back Close Full Screen / Esc
Printer-friendly Version Interactive Discussion Forstner, H. J. L., Flagan, R. C., and Seinfeld, J. H.: Secondary organic aerosol from the
photooxidation of aromatic hydrocarbons: Molecular composition, Environ. Sci. Technol., 31, 1345–1358, 1997.
Gard, E., Mayer, J. E., Morrical, B. D., Dienes, T., Fergenson, D. P., and Prather, K. A.: Real-time analysis of individual atmospheric aerosol particles: Design and performance of a portable
5
ATOFMS, Anal. Chem., 69, 4083–4091, 1997.
Good, A., Durden, D. A., and Kebarle, P.: Mechanism and rate constants of ion-molecule reactions leading to formation of H+(H2O)n in moist oxygen and air, J. Chem. Phys., 52, 222–229, 1970a.
Good, A., Durden, D. A., and Kebarle, P.: Ion-molecule reactions in pure nitrogen and nitrogen
10
containing traces of water at total pressures 0.5–4 torr kinetics of clustering reactions forming H+(H2O)n, J. Chem. Phys., 52, 212–221, 1970b.
Hamilton, J., Webb, P., Lewis, A., and Reviejo, M.: Quantifying small molecules in secondary organic aerosol formed during the photo-oxidation of toluene with hydroxyl radicals, Atmos. Environ., 39, 7263–7275, 2005.
15
Hansel, A., Jordan, A., Holzinger, R., Prazeller, P., Vogel, W., and Lindinger, W.: Proton transfer reaction mass spectrometry: Online trace gas analysis at the ppb level, Int. J. Mass Spec-trom., 149/150, 609–619, 1995.
Hearn, J. D. and Smith, G. D.: A chemical ionization mass spectrometry method for the online analysis of organic aerosols, Anal. Chem., 76, 2820–2826, 2004.
20
Hinds, W. C.: Aerosol Technology: Properties, Behavior, and Measurement of Airborne Parti-cles, 2nd, Wiley, New York, USA, 1999.
Hoffmann, T., Bandur, R., Hoffmann, S., and Warscheid, B.: On-line characterization of gaseous and particulate organic analytes using atmospheric pressure chemical ionization mass spectrometry, Spectrochim. Acta B, 57B, 1635–1647, 2002.
25
Jaoui, M. and Kamens, R. M.: Mass balance of gaseous and particulate products from β -Pinene/O3/Air in the absence of light andβ-Pinene/NOx/Air in the presence of natural sun-light, J. Atmos. Chem., 45, 101–141, 2003.
Krewski, D., Burnett, R. T., Goldberg, M. S., Hoover, K., Siemiatycki, J., Abrahamowicz, M., and White, W. H.: Validation of the harvard six cities study of particulate air pollution and
30
mortality, N. Engl. J. Med., 350, 198–199, 2004.
AMTD
2, 1351–1382, 2009Laboratory flow reactor with gas particle separation and on-line MS/MS
J. F. Bennett et al.
Title Page Abstract Introduction Conclusions References Tables Figures
◭ ◮
◭ ◮
Back Close Full Screen / Esc
Printer-friendly Version Interactive Discussion Larsen, B. R., DiBella, D., Glasius, M., Winterhalter, R., Jensen, N. R., and Hjorth, J.:
Gas-phase OH oxidation of monoterpenes: Gaseous and particulate products, J. Atmos. Chem., 38, 231–276, 2001.
Librando, V. and Tringali, G.: Atmospheric fate of OH initiated oxidation of terpenes. reaction mechanism ofα-pinene degradation and secondary organic aerosol formation, J. Environ.
5
Manage., 75, 275–282, 2005.
May, K. R.: The collison nebulizer: Description, performance and application, J. Aerosol Sci., 4, 235–243, 1973.
Noyes, W. A.: n-butyl nitrite, Organic Syntheses, 16, 7–8, 1936.
P ¨oschl, U.: Atmospheric aerosols: Composition, transformation, climate and health effects,
10
Angew. Chem.-Int. Edit., 44, 7520–7540, 2005.
Pratt, K. A., Mayer, J. E., Holecek, J. C., Moffet, R. C., Sanchez, R. O., Rebotier, T. P., Furu-tani, H., Gonin, M., Fuhrer, K., Su, Y., Guazzotti, S., and Prather, K. A.: Development and characterization of an aircraft aerosol time-of-flight mass spectrometer, Anal. Chem., 81, 1792–1800, 2009.
15
Ruiz, P. A., Lawrence, J. E., Ferguson, S. T., Wolfson, J. M., and Koutrakis, P.: A counter-current parallel-plate membrane denuder for the non-specific removal of trace gases, Environ. Sci. Technol., 40, 5058–5063, 2006.
Soderholm, S. C.: Analysis of diffusion battery data, J. Aerosol Sci., 10, 163–175, 1979. Tanimoto, H., Aoki, N., Inomata, S., Hirokawa, J., and Sadanaga, Y.: Development of a
PTR-20
TOFMS instrument for real-time measurements of volatile organic compounds in air, Int. J. Mass Spectrom., 263, 1–11, 2007.
Temime, B., Healy, R. M., and Wenger, J. C.: A denuder-filter sampling technique for the detec-tion of gas and particle phase carhonyl compounds, Environ. Sci. Technol., 41, 6514–6520, 2007.
25
Thomson, D. S., Schein, M. E., and Murphy, D. M.: Particle analysis by laser mass spectrometry WB-57F instrument overview, Aerosol Sci. Technol., 33, 153–169, 2000.
Warscheid, B., Kuckelmann, U., and Hoffmann, T.: Direct quantitative analysis of organic com-pounds in the gas and particle phase using a modified atmospheric pressure chemical ion-ization source in combination with ion trap mass spectrometry, Anal. Chem., 75, 1410–1417,
30
2003.
AMTD
2, 1351–1382, 2009Laboratory flow reactor with gas particle separation and on-line MS/MS
J. F. Bennett et al.
Title Page Abstract Introduction Conclusions References Tables Figures
◭ ◮
◭ ◮
Back Close Full Screen / Esc
Printer-friendly Version Interactive Discussion
Table 1.Determination of the penetration of molecules and particles through the CFMD. Values
of Dp come from gas phase theory (for the first two entries) andkT Cc/3πηd (k: Boltzmann constant,T: Temperature,Cc: slip correction,ηair viscosity) for the remainder.
Particle Diffusion coefficient Penetration diameterd(µm) Dp(cm−2
s−1
@ 298 K) µ Pn
0.00037 1.9E-01 4.6E+01 9.1E-57
0.001 1.2E-02 3.0E00 2.0E-04
0.01 5.3E-04 1.3E-01 6.3E-01
0.015 2.4E-04 5.8E-02 7.8E-01
0.02 1.4E-04 3.3E-02 8.5E-01
0.05 2.4E-05 5.7E-03 9.5E-01
0.1 6.8E-06 1.6E-03 9.8E-01
0.5 6.3E-07 1.5E-04 1.0E+00
1 2.8E-07 6.6E-05 1.0E+00
5 4.9E-08 1.2E-05 1.0E+00
10 2.4E-08 5.8E-06 1.0E+00
AMTD
2, 1351–1382, 2009Laboratory flow reactor with gas particle separation and on-line MS/MS
J. F. Bennett et al.
Title Page Abstract Introduction Conclusions References Tables Figures
◭ ◮
◭ ◮
Back Close Full Screen / Esc
Printer-friendly Version Interactive Discussion
Table 2. Mass balance experiment: % of acetol recovered in the outer channel flow as a
function of that flow.
Outer channel flow l min−1
% recovery of acetol
2 105±23%
4 100±32%
AMTD
2, 1351–1382, 2009Laboratory flow reactor with gas particle separation and on-line MS/MS
J. F. Bennett et al.
Title Page Abstract Introduction Conclusions References Tables Figures
◭ ◮
◭ ◮
Back Close Full Screen / Esc
Printer-friendly Version Interactive Discussion
UV source NO
Syringe Pump with M-Xylene
Syringe Pump with Isopropyl Nitrite (IPN)
X X
X
CPC
air pump
Flow Reactor Inline
Heater
Triple Quadrupole Mass
Spectrometer
Makeup air
X
air filter
MFC
MFC Pressure
Control
MFC
MFC Ion Source pump
CFMD
MFC
Fig. 1.Experimental set up for photochemical reactions and product identification. (CFMD: the
AMTD
2, 1351–1382, 2009Laboratory flow reactor with gas particle separation and on-line MS/MS
J. F. Bennett et al.
Title Page Abstract Introduction Conclusions References Tables Figures
◭ ◮
◭ ◮
Back Close Full Screen / Esc
Printer-friendly Version Interactive Discussion
Air in Trace Gases
out
Particles & Trace Gases in
Particles out
Trace Gases out
Air in
PTFE membrane Stainless steel mesh
Trace Gases
Trace Gases
Differential Pressure Gauge
Fig. 2. Exploded diagram of the counter flow membrane denuder. The directions of the air
AMTD
2, 1351–1382, 2009Laboratory flow reactor with gas particle separation and on-line MS/MS
J. F. Bennett et al.
Title Page Abstract Introduction Conclusions References Tables Figures
◭ ◮
◭ ◮
Back Close Full Screen / Esc
Printer-friendly Version Interactive Discussion
50
40
30
20
10
0
-10
7 6 5 4 3 2 1 0
Total Upper and Lower Channel Flow Rate (l min-1)
120
100
80
60
40
20
0
3.0 2.5
2.0 1.5
1.0 0.5
0.0
Centre Channel Flow Rate (l min-1)
a)
b)
Penetration (%)
Penetration (%)
Fig. 3. Penetration of gas phase acetol through the CFMD.(a) Penetration as a function of
outer channel flow for a fixed centre channel flow of 0.6 l min−1
.(b)Penetration as a function of centre channel flow for a fixed outer flow of 6 l min−1
AMTD
2, 1351–1382, 2009Laboratory flow reactor with gas particle separation and on-line MS/MS
J. F. Bennett et al.
Title Page Abstract Introduction Conclusions References Tables Figures
◭ ◮
◭ ◮
Back Close Full Screen / Esc
Printer-friendly Version Interactive Discussion
120
100
80
60
40
20
0
Penetration (%)
7 6
5 4
3 2
1 0
Total Upper and Lower Channel Flow Rate (l min-1)
AMTD
2, 1351–1382, 2009Laboratory flow reactor with gas particle separation and on-line MS/MS
J. F. Bennett et al.
Title Page Abstract Introduction Conclusions References Tables Figures
◭ ◮
◭ ◮
Back Close Full Screen / Esc
Printer-friendly Version Interactive Discussion
Relative Number
200 150
100 50
Diameter (nm)
24oC 100oC 125oC 150oC 175oC 200oC
AMTD
2, 1351–1382, 2009Laboratory flow reactor with gas particle separation and on-line MS/MS
J. F. Bennett et al.
Title Page Abstract Introduction Conclusions References Tables Figures
◭ ◮
◭ ◮
Back Close Full Screen / Esc
Printer-friendly Version Interactive Discussion
100
75
50
25
0
100
75
50
25
0
Relative Intensity (%)
100
75
50
25
0
400 350 300 250 200 150 100 50 0
m/z
a)
b)
c)
Fig. 6. Mass spectra of samples from the reaction of m-xylene with HO radicals(a) particle
AMTD
2, 1351–1382, 2009Laboratory flow reactor with gas particle separation and on-line MS/MS
J. F. Bennett et al.
Title Page Abstract Introduction Conclusions References Tables Figures
◭ ◮
◭ ◮
Back Close Full Screen / Esc
Printer-friendly Version Interactive Discussion
100
75
50
25
0
100
75
50
25
0
100
75
50
25
0
100
75
50
25
0
120 80 40
0 0 40 80 1200 40 80 120
a)
b)
c)
d)
10 eV 20eV
Relative Intensity (%)
m/z
30eV
Fig. 7. MS/MS spectra ofm/z122. (a)The particle phase sample,(b)the gas phase sample,
AMTD
2, 1351–1382, 2009Laboratory flow reactor with gas particle separation and on-line MS/MS
J. F. Bennett et al.
Title Page Abstract Introduction Conclusions References Tables Figures
◭ ◮
◭ ◮
Back Close Full Screen / Esc
Printer-friendly Version Interactive Discussion
100
75
50
25
0
100
75
50
25
0
100
75
50
25
0
100 80 60 40 20
0 0 20 40 60 801000 20 40 60 80 100
100
75
50
25
0
100
75
50
25
0
10 eV 20 eV 30 eV
a)
b)
c)
d)
e)
m/z
Relative Intensity (%)
Fig. 8. MS/MS spectra of m/z99(a) the particle phase sample, (b) the gas phase sample
AMTD
2, 1351–1382, 2009Laboratory flow reactor with gas particle separation and on-line MS/MS
J. F. Bennett et al.
Title Page Abstract Introduction Conclusions References Tables Figures
◭ ◮
◭ ◮
Back Close Full Screen / Esc
Printer-friendly Version Interactive Discussion
100
75
50
25
0
100
75
50
25
0
160 120 80 40
0 0 40 80 120 160 0 40 80 120 160
100
75
50
25
0
10 eV 20 eV 30 eV
a)
b)
Relative Intensity (%)
m/z c)
Fig. 9.MS/MS spectra ofm/z168(a)the particulate phase sample(b)the gas phase sample