Article
J. Braz. Chem. Soc., Vol. 25, No. 9, 1673-1680, 2014. Printed in Brazil - ©2014 Sociedade Brasileira de Química 0103 - 5053 $6.00+0.00
A
*e-mail: [email protected]
Degradation of Dipyrone by the Electro-Fenton Process in an Electrochemical Flow
Reactor with a Modified Gas Diffusion Electrode
Willyam R. P. Barros,a Michelle P. Borges,a Rafael M. Reis,a Robson S. Rocha,a Rodnei Bertazzolib and Marcos R. V. Lanzaa,*
aInstituto de Química de São Carlos, Universidade de São Paulo, Avenida Trabalhador São Carlense, 13560-970 São Carlos-SP, Brazil
bDepartamento de Engenharia de Materiais, Faculdade de Engenharia Mecânica, Universidade Estadual de Campinas, 13083-970 Campinas-SP, Brazil
A crescente ocorrência de antibióticos e seus metabólitos estão cada vez maiores em águas superficiais e subterrâneas, causando impactos significativos no meio ambiente e necessitando de desenvolvimento de novos tratamentos para a remoção completa de tais contaminantes. Este trabalho apresenta o estudo da eletrogeração de peróxido de hidrogênio (H2O2) em meio ácido e
a degradação do analgésico dipirona em um reator de fluxo eletroquímico usando um eletrodo de difusão gasosa (GDE) modificado com 5,0% ftalocianina de cobalto (II) (CoPc) e pressurizado com O2. A maior produção de H2O2 alcançada foi de 133 mg L
−1 a um potencial aplicado de −2,1 V
(vs. Pt//Ag/AgCl/KCls) e os melhores resultados para a degradação da dipirona foram obtidos sob
condições eletro-Fenton, em que o carbono orgânico total (TOC) foi reduzido 62,8% após 90 min de reação e 49,1 kW h de energia foi consumida por kg de dipirona degradada.
The increasing occurrence of antibiotics and their metabolites in surface and ground waters is causing a significant impact on the environment and needing of developing novel treatments for the complete removal of such contaminants. This paper presents the study of the electrogeneration of hydrogen peroxide (H2O2) in acidic medium and the degradation of the analgesic dipyrone in
an electrochemical flow reactor using a gas diffusion electrode (GDE) modified with 5.0% cobalt (II) phthalocyanine (CoPc) and pressurized with O2. The highest yield of H2O2 (133 mg L
−1) was
achieved after 90 min of electrolysis at an applied potential of −2.1 V (vs. Pt//Ag/AgCl/KCls) and
the best results for degradation of dipyrone were obtained under electro-Fenton conditions, where the total organic carbon (TOC) was reduced 62.8% after 90 min of reaction and 49.1 kW h of energy was consumed per kg of dipyrone degraded.
Keywords: gas diffuson electrode, electrochemical reactor, dipyrone, Fenton process
Introduction
Drugs that have been administered to humans are excreted either unchanged or in the form of metabolites. Conventional treatments of sewage water are not able to
remove these compounds completely,1,2 and contamination
of surface and ground water by pharmaceutical products has been reported in a number of countries.3-8 Various classes
of drugs have been implicated as sources of environmental pollution, but non-steroidal anti-inflammatory drugs (NSAIDs) such as acetylsalicylic acid, diclofenac and dipyrone (DP) are generally detected in the largest quantities
mainly because of their high level of consumption.7,9
In this context, DP (also known as metamizole) is of particular interest since in some European, African and South American countries it is widely available as an over-the-counter analgesic and antipyretic, although in others its use is restricted or even banned because of its potential side effects and the possibility of environmental contamination.10-15
and toxicities of the products so-formed determined.16
Additionally, it has been shown that electrochemical degradation of DP using boron-doped diamond (BDD) electrodes under optimized conditions allows total removal of the drug within 20 min and 95.2% removal of total
organic carbon (TOC) in 8 h.17
An alternative type of effluent treatment that has received considerable attention over the last few years is based on advanced oxidation processes (AOPs) in which
the hydroxyl radical (•OH) is produced from oxidizing
agents such as hydrogen peroxide (H2O2).18 In this process,
the •OH plays a key role since its high oxidation potential
promotes attack on organic substances by extracting
hydrogen atoms and adding to double bonds.19 The
efficiency of production of •OH from H
2O2 is enhanced
by the presence of Fe2+,as in the Fenton reaction, where
iron acts as a reducing agent to oxidize the H2O2 according
to equation 1:19
Fe2+ + H
2O2→ Fe
3+ + •OH + OH–,
k = 3.8 × 10⁸ mol L−1 s−1 (1)
A particular advantage of this type of process is that it does not require the presence of organic chlorine and, therefore, does not generate organochlorine compounds as
undesirable by-products.20
The direct production of H2O2 in the medium in which the
AOP occurs represents a particularly attractive proposition since it removes the requirement of transport and storage of a reagent that is corrosive and inflammable.21,22 Efficient
electrogeneration of H2O2 can be readily achieved using
gas diffusion electrodes (GDEs) in which the oxygen reduction reaction (ORR) occurs at the triple interface
between pressurized O2 gas, the electrolyte solution and
the surface of the electrode.23,24 The ORR occurs via a
complex mechanism, the steps of which are described in equations 2-6:24-27
O2 + 4H+ + 4e
−→
2H2O (2)
O2 + 2H
+ + 2e−→
H2O2 (3)
H2O2 + 2H+ + 2e
−→
2H2O (4)
H2O2 → 2H + + 2e−
+ O2 (5)
2H+ + 2e− →
H2 (6)
The complete reduction of O2 to water occurs via a
reaction involving four electrons (equation 2), while partial reduction to produce H2O2 involves a two electron transfer
(equation 3). Electrogenerated H2O2 can be reduced to
water via a two electron transfer (equation 4) or it can be oxidized to regenerate molecular O2 (equation 5). Since the
electrogeneration of H2O2 takes place in acidic medium,
the involvement of the hydrogen evolution reaction (HER), as shown in equation 6, is also likely.
The aim of the present study was to investigate
the electrogeneration of H2O2 in acidic medium in an
electrochemical flow reactor using a GDE modified with cobalt (II) phthalocyanine (CoPc), and to explore the application of this system to the degradation of DP by means of the Fenton reaction.
Experimental
Electrogeneration of H2O2
The production of H2O2 was carried out in an
electrochemical flow reactor, the construction of which has been described previously, comprising two parallel polypropylene plates fitted with a dimensionally stable anode type Cl2 (DSA-Cl2
®; geometric area 20 cm2) obtained
from De Nora do Brasil (Sorocaba, SP, Brazil).17,21,22,24,28
The cathode was a GDE (geometric area 20 cm2) that
had been prepared by the hot pressing procedure using Carbon Printex 6L conductive black graphite (Degussa Brasil, Jardim Paulista, SP, Brazil) with 5.0% (m/m) of CoPc and 20% (m/m) of polytetrafluoroethylene (PTFE;
Dyneon TF 5035, 3M do Brazil, Sumaré, SP, Brazil).24,28-30
A pseudo-reference Pt//Ag/AgCl/KCls electrode was
positioned on the face of the GDE as the reference
electrode.31 The reactor was connected to a recirculation
system (capacity 2 L) through which electrolyte could be supplied at a flow rate of 50 L h−1 (laminar flow; Reynolds
number, Re = 290).
Electrogeneration of H2O2 in the electrochemical reactor
was investigated in two stages. In the first step, the working
GDE cathode was pressurized with N2 for 20 min, after
which linear voltammetry (LV) was carried out in the range
−0.5 V ≤ E ≤−2.8 V (vs. Pt//Ag/AgCl/KCls) at 20 mV s−1
with an electrolyte containing H2SO4 (0.1 mol L
−1) and
K2SO4 (0.1 mol L
−1) supplied at a flow rate of 50 L h−1.
Subsequently, the GDE was pressurized with O2 for 30 min
and LV measurements were recorded under the conditions stated above. Electrochemical analyses were carried out using a Metrohm Autolab (Utrecht, The Netherlands) model PGSTAT-302 potentiostat with a model BSTRA10A current booster, and the cell potential was measured using a high impedance digital multimeter connected in parallel to the working and counter electrodes. In the second step, electrolysis was performed at a constant applied potential in the range −0.3 V ≤ E ≤−2.4 V (vs. Pt//Ag/AgCl/KCls),
and the amounts of H2O2 present in samples of electrolyte
collected during a 90 min reaction period were quantified
Electrodegradation of DP
For the electrodegradation of DP (50 mg L−1) was used the
same electrochemical flow reactor used in the experiments of electrogeneration of H2O2. Aqueous electrolyte (1.5 L)
containing H2SO4 (0.1 mol L
−1) and K
2SO4 (0.1 mol L
−1)
was employed in the electrodegradation of DP, while the electro-Fenton process was used the same electrolyte with 1.0 mmol L−1 of FeSO
4.7H2O. Electrolyses were carried out
at constant applied potential of −2.1 V (vs. Pt//Ag/AgCl/KCls)
for 90 min with the electrolyte thermostated at 20 °C. The electrolyte was sampled at appropriate intervals throughout the experiment, and the ultraviolet-visible (UV-Vis; 200-800 nm) spectrum of each sample was measured using an Agilent (Santa Clara, CA, USA) Varian Cary 50 spectrometer. The removal of DP was monitored from the
absorbance at 262 nm, which was determined to be the λ
max
of the analytical-standard grade drug.
The amount of DP remaining in the electrolyte was determined by high performance liquid chromatography (HPLC) using a Shimadzu (Kyoto, Japan) model LC-20AT chromatograph equipped with a model SPD-20A UV
detector and a Phenomenex (Torrance, CA, USA) Luna C18
column (250 × 4.6 mm i.d.; 5 µm). Elution was isocratic with a 30:70 (v/v) mixture of methanol and phosphate buffer (pH 7) at a flow rate of 1.0 mL min−1, and detection
was at 262 nm. Quantitative estimation of DP was performed with the aid of a calibration curve constructed using analytical-standard grade drug. The variation in TOC in samples of electrolyte was measured using a Shimadzu TOC-VCPN analyzer.
Results and Discussion
Electrogeneration of H2O2
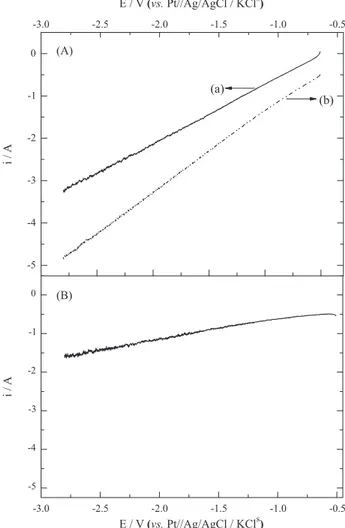
Linear voltammograms (LVs) recorded in the electrochemical reactor after the GDE had been pressurized with N2 and, subsequently, with O2 are shown in Figure 1.
The variation in current observed when the GDE was pressurized with N2 was likely associated with the reduction
of H+ ions in the acidic electrolyte to form H
2 (equation 6).
On the other hand, the increased current observed when
the GDE was pressurized with O2 may be associated with
the reduction of H+ ions and O
2 to form H2O2 (equation 3),
although other reactions may occur in parallel under these
conditions including the reduction of O2 to water via a
4-electron transfer.22,24,29 It appears that ORR is dependent
on the applied potential, whereby potentials that are more negative tend to promote ORR via 4-electron transfer
in parallel with the reduction of water.24 A plot of the
difference between the LVs recorded under O2 and N2
pressurization (Figure 1B) revealed that, the ORR current increased with increasing applied potential and attained a value of −1.6 A at −2.8 V. These findings are very much in
line with those established previously by our research group using the same modified GDE for the electrogeneration of H2O2.30
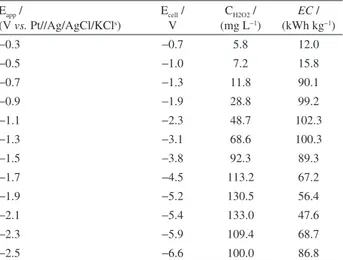
As displayed in Figure 2, the concentration of H2O2 varied
in a linear manner with respect to time of electrolysis under applied potentials within the range −0.3 V ≤ E ≤−2.5 V
(vs. Pt//Ag/AgCl/KCls). The amount of H
2O2 formed
during 90 min of electrolysis increased as the applied potential increased from −0.3 V (vs. Pt//Ag/AgCl/KCls),
and attained a maximum value of 133 mg L−1 at −2.1 V
(vs. Pt//Ag/AgCl/KCls) (Figure 2B). This potential range
is associated with an ORR involving 2-electron transfer and the consequent formation of H2O2. At potentials in the
Figure 1. Linear voltammograms (LVs) obtained with an electrochemical reactor comprising a GDE modified with 5.0% of CoPc and supplied with 1.5 L of electrolyte containing 0.1 mol L−1 of H
range −2.1 V < E ≤−2.5 V (vs. Pt//Ag/AgCl/KCls), the final
H2O2 concentration gradually diminished, and a value of
100 mg L−1 was recorded at −2.5 V (vs. Pt//Ag/AgCl/KCls).
These more negative potentials tend to promote ORR via 4-electron transfer with a corresponding reduction in the generation of H2O2.
24
It is of interest to note that the potential range employed in the present investigation involving an electrochemical reactor (−0.3 V ≤ E ≤ −2.5 V (vs. Pt//Ag/AgCl/KCls))
was substantially greater than that reported in a previous study (−0.4 V ≤ E ≤ −1.4 V (vs. Ag/AgCl/KCls)) by our
group concerning the electrogeneration of H2O2 in an
electrochemical cell with a similar electrode and supporting
electrolyte.30 The reason for the apparent discrepancy in
potential range is associated with differences between the electrochemical cell and the electrochemical reactor regarding the type and area of the counter electrode (platinum screen in the cell, DSA electrode in the reactor), the distance between the working and counter electrodes (ca. 1.5 cm in the cell, 2 mm in the reactor), the hydrodynamics of the system (simple stirring in the cell, laminar regime in the reactor),
and the reference system employed (Ag/AgCl/KCls in the
cell, Pt//Ag/AgCl/KCls in the reactor).22
The linear variation of H2O2 concentration with time
of electrolysis signifies that the electrogeneration of the oxidant followed zero-order kinetics. However, the variation observed derives from the summation of a number of different reactions (equations 2 to 6) that occurred in
parallel with the formation of H2O2 and, therefore, the
kinetics of this reaction must be considered to be global pseudo zero-order. The apparent rate constant for the formation of H2O2 (kapp;mg L
−1 min−1) was estimated
from the slope of the plot of H2O2 concentration vs. time,
considering the first 30 min of reaction. According to the
kapp values shown in Figure 2B, the rate constant increased as the applied potential from −0.3 V (vs. Pt//Ag/AgCl/KCls),
and attained a maximum value of 1.79 mg L−1 min−1 at
−2.1 V (vs. Pt//Ag/AgCl/KCls). At more negative potentials,
however, the rate constant showed a gradual reduction to 1.11 mg L−1 min−1 at −2.5 V. Overall, the values of the
rate constants determined in the present study were lower
than those reported previouslybecause of the differences
between the electrochemical cell and the corresponding reactor as outlined above.30
The energy consumed (EC, in kWh kg−1) in the
electrogeneration of 1 kg of H2O2 was calculated according
to equation 7:
Figure 2. (A) Variation of H2O2 concentration vs. time of electrolysis, and (B) concentration of H2O2 after 90 min of electrolysis and apparent rate constant (kapp) for the formation of the oxidant during the first 30 min in an electrochemical reactor comprising a GDE modified with 5.0% of CoPc and supplied with 1.5 L of electrolyte containing 0.1 mol L–1 of H
2SO4 and 0.1 mol L–1 of K2SO4 at a flow rate of 50 L h–1. −0.3 V (¢), −0.5 V (), −0.7 V (), −0.9 V (),
−1.1 V (), −1.3 V (), −1.5 V (), −1.7 V (), −1.9 V (), −2.1 V (), −2.3 V () and −2.5 V ().
Table 1. Electrogeneration of H2O2 during 90 min of electrolysis at different applied potentials and energy consumed (EC) in the generation of 1 kg of H2O2 for each experiment
Eapp /
(V vs. Pt//Ag/AgCl/KCls)
Ecell / V
CH2O2 / (mg L−1)
EC / (kWh kg−1)
−0.3 −0.7 5.8 12.0
−0.5 −1.0 7.2 15.8
−0.7 −1.3 11.8 90.1
−0.9 −1.9 28.8 99.2
−1.1 −2.3 48.7 102.3
−1.3 −3.1 68.6 100.3
−1.5 −3.8 92.3 89.3
−1.7 −4.5 113.2 67.2
−1.9 −5.2 130.5 56.4
−2.1 −5.4 133.0 47.6
−2.3 −5.9 109.4 68.7
(7)
where i is the current (A), Ecell is the cell potential (V),
t is the time (h) and m is the mass of H2O2 (kg)
generated during that time. As verified in Table 1, electrogeneration of H2O2 at an applied potential of −2.1 V
(vs. Pt//Ag/AgCl/KCls) not only gave the highest yield of
H2O2 during 90 min of reaction but also showed a very low
EC value of 47.6 kWh kg−1. At more negative potentials,
the EC increased quite sharply as energy was diverted
away from H2O2 and towards parallel ORR involving
4-electron transfer. The EC values obtained in the present study with the electrochemical reactor are similar to those reported previously for the electrochemical cell in which
a consumption of 30.8 kWh kg−1 was recorded under the
experimental conditions that generated the highest yield of H2O2.
30
Electrodegradation of DP
The electrodegradation of DP was performed under three different reaction conditions. In the first experiment, the GDE was pressurized with N2 such that H2O2 was not
generated at the cathode and the observed degradation of DP occurred via anodic oxidation at the DSA. In the
second experiment, the GDE was pressurized with O2,
leading to the formation of H2O2 and
•OH, and the observed
degradation of DP resulted from anodic oxidation and
oxidation by •OH. The final degradation was performed
under electro-Fenton conditions with the GDE pressurized with O2 and Fe
2+ presentin the electrolyte. In this case, the
formation of •OH from H
2O2 was catalyzed by Fe2+, and the
observed degradation of DP resulted from anodic oxidation and oxidation by •OH. Since it had already been established
that the best potential for the generation of H2O2 in the
electrochemical reactorwas −2.1 V (vs. Pt//Ag/AgCl/KCls),
the degradation experiments were performed at this applied potential.
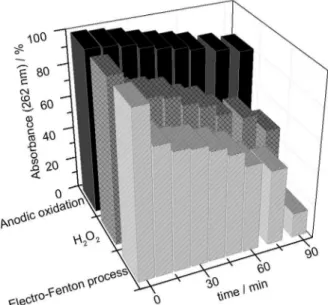
Figure 3 shows the reduction in absorbance at 262 nm recorded during the degradation of DP under the three different electrochemical conditions. After 90 min of electrolysis, the smallest decrease (18.5%) in absorbance
occurred when the GDE was pressurized with N2.
The reduction in absorbance was considerably greater
(51.6%) when O2 was used to pressurize the GDE, while
the presence of Fe2+ ions in the electrolyte under these
conditions promoted a decrease in absorbance of 84.7% after 90 min.
In order to verify that the observed reduction in absorbance at 262 nm accurately reflected the removal
of DP from the electrolyte, the variation in concentration of analyte during electrodegradation was monitored by HPLC. The results displayed in Figure 4 confirm that anodic oxidation accounted for a reduction in DP concentration of only 17.5% after 90 min. In contrast, when the GDE was
pressurized with O2, around 92.5% of the initial DP was
removed after 90 min of reaction in the absence or presence
of Fe2+ ions. However, while 90% of analyte was removed
within 40 min of reaction in the absence of Fe2+ ions, the
same level of removal could be achieved in 20 min in the presence of these ions. The increased rate of degradation of DP was associated with the augmented rate of formation
of •OH under Fenton reaction conditions.
In all experiments, the reduction in concentration of DP was most rapid during the first 40 min of electrolysis (Figure 4), during which period the reaction presented
first-order kinetics.21,22,32 The rate constant for the
degradation of DP was evaluated from the slope of the
plot ln (DP concentration / mg L−1) vs. time (min) for
each experiment, and the respective values of 3.8 × 10⁻³,
5.5 × 10⁻² and 7.0 × 10⁻² min−1 (Figure 4B) were obtained
for anodic degradation, reaction by electrogenerated H2O2,
and electrodegradation under electro-Fenton conditions, respectively. The difference these values is due (i) in the degradation process of direct anodic oxidation, that is,
using higher oxides formed on the surface of the anode,32
occurs less yields in the percentage of degradation and (ii) in electro-Fenton process of degradation of DP occurs Figure 3. Variation in absorbance of DP at 262 nm (expressed as a percentage of the initial absorbance) with respect to time of electrolysis performed in the electrochemical reactor under the conditions: anodic - GDE pressurized with N2; H2O2 - GDE pressurized with O2 in the absence of catalyst; electro-Fenton process - GDE pressurized with O2 in the presence of 1 mmol L−1 of FeSO
the high forming •OH radicals due to the rapid kinetics of
the formation of these radicals, with a constant, as shown in equation 1.
Although almost complete removal of absorbance at 262 nm of DP concentration was achieved in experiments involving the electrogeneration of H2O2, such results cannot
be considered as indicative of mineralization of organic matter in the electrolyte. The levels of TOC present at the start and final of each degradation experiment were measured directly, and the results (Table 2) showed that
mineralization by H2O2 electrogenerated was 4.4 times
greater (5.3 mg L−1 TOC removed) and in the presence
of ions Fe2+ was 13.3 times greater (15.9 mg L−1 TOC
removed), both compared to anodic degradation with
1.2 mg L−1 TOC removal. Moreover, the EC value
for the removal of 1 kg of TOC under electro-Fenton conditions was 2.9- and 12.9-fold lower than those relating, respectively, to anodic oxidation and electrogeneration of H2O2 alone.
Pressurization of the GDE with N2 promoted degradation
of organic materials at the anode surface by processes associated with the anodic current density in the DSA. However, since the current density was low (130 mA cm−2),
the anodic degradation of DP was compromised.32 When
the GDE was pressurized with O2, H2O2 was generated
in situ but, in the absence of Fe2+, the degradation process
was effectuated by •OH and other oxidizing species, such
as radical anions (O•
2), hydroperoxyl radicals (HO
• 2),
triplet oxygen (3O
2) and organic peroxyl radicals (R-O-O•),
with less potential than the •OH.33 Thus, although this
experiment showed better results in comparison with anodic degradation, the process was less efficient than that involving generation of H2O2 in the presence of Fe2+, which
presented higher formation of •OH greater removal of DP
and TOC, and lower power consumption.16,19,34,35
The results of TOC removal are in agreement with the
literature, Giri et al.36 reached 56% of TOC removal at
45 min, but the authors used a photo-assisted system with addition of H2O2 in the presence of Fe2+.36 Considering
the in situ electrogeneration of H2O2 for the degradation
of dipyrone, Assumpção et al.37 reached 57% of TOC
removal using electro-Fenton and 75% for the same system
but photo-assisted.37 Using electrochemical reactor with
parallel plate, Reis et al.17 studied the anodic degradation
using boron-doped diamond, reached 44% of TOC removal after 120 min at 50 L h−1 by 5.0 V (vs. Pt//Ag/AgCl/KCls).
Figure 4: (A) Decay of concentration of DP (determined by HPLC and expressed as a percentage of the initial concentration) and (B) plot linear versus time of experiment during the first 40 min with respect to time of electrolysis performed in the electrochemical reactor under the conditions: anodic - GDE pressurized with N2 (- - -); H2O2 - GDE pressurized with O2 in the absence of catalyst (); electro-Fenton process- GDE pressurized with O2 in the presence of 1 mmol L−1 of FeSO
4.7H2O ().
Table 2. Percentage of total organic carbon (TOC) removed after 90 min of electrolysis and energy consumed (EC) in the removal of 1 kg of TOC during the degradation of DP in an electrochemical reactor operated at a flow rate of 50 L h−1 under different reaction conditions
Parameter Anodic oxidation Electrogenerated H2O2 Electro-Fenton process
Initial TOC / (mg L−1) 24.6 25.6 25.3
Final TOC / (mg L−1) 23.4 20.3 9.4
TOC removed / % 5.0 20.1 62.8
In comparison with the results presented in the literature, the use of electrochemical reactor for H2O2 generation for
dipyrone degradation was efficient for this process, but
with the advantage of generating a specific H2O2 amount
depending the characteristics of wastewater to be treated.
Conclusions
Hydrogen peroxide could be generated efficiently in an electrochemical reactor comprising a GDE modified with 5.0% of CoPc and pressurized with O2. The highest yield of
H2O2 (133 mg L
−1) was achieved after 90 min of electrolysis
at an applied potential of −2.1 V (vs. Pt//Ag/AgCl/KCls),
under which conditions the reaction rate was 1.79 mg−1 min−1
and the energy consumption was 47.6 kWh per kg of H2O2
generated.
Degradation of DP in the electrochemical reactor was
investigated with the GDE pressurized with N2 (conditions
for anodic oxidation), and with O2 in the absence of catalyst
(conditions for H2O2 generation) and in the presence of
Fe2+ (conditions for the electro-Fenton process). The best
results were obtained under electro-Fenton conditions, whereby absorbance at 262 nm was decreased by 84.7%, the concentration of DP was diminished by 92.5%, and TOC was reduced by 62.8% after 90 min of reaction. These results were associated with the increased formation of •OH from H
2O2 catalyzed by Fe2+, and this gave rise to
a reduction in energy consumption for TOC removal of 92.3% compared with anodic degradation, and of 65.8%
compared with H2O2 electrodegradation without catalyst.
The findings reported herein confirm the importance of
using Fe2+ in electrodegradation reactions involving the
in situ generation of H2O2.
Acknowledgements
The authors gratefully acknowledge the support of Fundação de Amparo à Pesquisa do Estado de São Paulo (FAPESP), Conselho Nacional de Desenvolvimento Científico e Tecnológico (CNPq) and Coordenação de Aperfeiçoamento de Pessoal de Nível Superior (CAPES).
References
1. Joss, A.; Zabczynski, S.; Gobel, A.; Hoffmann, B.; Loffler, D.; McArdell, C. S.; Ternes, T. A.; Thomsen, A.; Siegrist, H.; Water Res. 2006, 40, 1686.
2. Carballa, M.; Omil, F.; Ternes, T.; Lema, J. M.; Water Res. 2007, 41, 2139.
3. Bila, D. M.; Dezotti, M.; Quim. Nova 2003, 26, 523.
4. Tauxe-Wuersch, A.; De Alencastro, L. F.; Grandjean, D.;
Tarradellas, J.; Water Res. 2005, 39, 1761.
5. Kasprzyk-Hordern, B.; Dinsdale, R. M.; Guwy, A. J.; Water Res. 2008, 42, 3498.
6. Al Aukidy, M.; Verlicchi, P.; Jelic, A.; Petrovic, M.; Barcelò, D.; Sci. Total Environ. 2012, 438, 15.
7. Martínez Bueno, M. J.; Hernando, M. D.; Herrera, S.; Gómez, M. J.; Fernández-Alba, A. R.; Bustamante, I.; García-Calvo, E.; Int. J. Environ. Anal. Chem. 2010, 90, 321.
8. Vystavna, Y.; Huneau, F.; Grynenko, V.; Vergeles, Y.; Celle-Jeanton, H.; Tapie, N.; Budzinski, H.; Le Coustumer, P.; Water, Air, Soil Pollut. 2012, 223, 2111.
9. Nikolaou, A.; Meric, S.; Fatta, D.; Anal. Bioanal. Chem. 2007, 387, 1225.
10. Zylber-Katz, E.; Granit, L.; Levy, M.; Eur. J. Clin. Pharmacol. 1992, 42, 187.
11. Arkhipchuk, V. V.; Goncharuk, V. V.; Chernykh, V. P.; Maloshtan, L. N.; Gritsenko, I. S.; J. Appl. Toxicol. 2004, 24, 401.
12. Wiegel, S.; Aulinger, A.; Brockmeyer, R.; Harms, H.; Loffler, J.; Reincke, H.; Schmidt, R.; Stachel, B.; von Tumpling, W.; Wanke, A.; Chemosphere 2004, 57, 107.
13. Fent, K.; Weston, A. A.; Caminada, D.; Aquat. Toxicol. 2006, 76, 122.
14. Gomez, M. J.; Martinez Bueno, M. J.; Lacorte, S.; Fernandez-Alba, A. R.; Aguera, A.; Chemosphere 2007, 66, 993. 15. Nikolova, I.; Tencheva, J.; Voinikov, J.; Petkova, V.;
Benbasat, N.; Danchev, N.; Biotechnol. Biotechnol. Equip. 2012, 26, 3329.
16. Gomez, M. J.; Sirtori, C.; Mezcua, M.; Fernandez-Alba, A. R.; Aguera, A.; Water Res. 2008, 42, 2698.
17. Reis, R. M.; Baio, J. A. F.; Migliorini, F. L.; Rocha, R. S.; Baldan, M. R.; Ferreira, N. G.; Lanza, M. R. V.; J. Electroanal. Chem. 2013, 690, 89.
18. Huang, C. P.; Dong, C.; Tang, Z.; Waste Manage. 1993, 13, 361. 19. Neyens, E.; Baeyens, J.; J. Hazard Mater. 2003, 98, 35. 20. Mininni, G.; Sbrilli, A.; Guerriero, G.; Rotatori, M.;
Chemosphere 2004, 54, 1337.
21. Beati, A. A. G. F.; Rocha, R. S.; Oliveira, J. G.; Lanza, M. R. V.; Quim. Nova 2009, 32, 125.
22. Rocha, R. S.; Beati, A. A. G. F.; Oliveira, J. G.; Lanza, M. R. V.; Quim. Nova 2009, 32, 354.
23. Assumpção, M. H. M. T.; Moraes, A.; De Souza, R. F. B.; Gaubeur, I.; Oliveira, R. T. S.; Antonin, V. S.; Malpass, G. R. P.; Rocha, R. S.; Calegaro, M. L.; Lanza, M. R. V.; Santos, M. C.; Appl. Catal.-A: Gen. 2012, 411-412, 1.
24. Reis, R. M.; Beati, A. A. G. F.; Rocha, R. S.; Assumpção, M. H. M. T.; Santos, M. C.; Bertazzoli, R.; Lanza, M. R. V.; Ind. Eng. Chem. Res. 2012, 51, 649.
25. Yeager, E.; Electrochim. Acta 1984, 29, 1527.
27. Lipkowski, J.; Ross, P.; Electrocatalysis, Wiley-VCH: New York, USA, 2008.
28. Cordeiro, G. S.; Rocha, R. S.; Valim, R. B.; Migliorini, F. L.; Baldan, M. R.; Lanza, M. R. V.; Ferreira, N. G.; Diamond Relat. Mater. 2013, 32, 54.
29. Rocha, R. S.; Reis, R. M.; Beati, A. A. G. F.; Sotomayor, M. D. P. T.; Bertazzoli, R.; Lanza, M. R. V.; Quim. Nova 2012, 35, 1961.
30. Barros, W. R. P.; Reis, R. M.; Rocha, R. S.; Lanza, M. R. V.; Electrochim. Acta 2013, 104, 12.
31. Beati, A. A. G. F.; Reis, R. M.; Rocha, R. S.; Lanza, M. R. V.; Ind. Eng. Chem. Res. 2012, 51, 5367.
32. Rezende, L. G. P.; Prado, V. M.; Rocha, R. S.; Beati, A. A. G. F.; Sotomayor, M. D. P. T.; Lanza, M. R. V.; Quim. Nova 2010, 33, 1088.
33. Ikehata, K.; Naghashkar, N. J.; El-Din, M. G.; Ozone: Sci. Eng. 2006, 28, 353.
34. Fan, Y.; Ai, Z.; Zhang, L.; J. Hazard Mater. 2010, 176, 678. 35. Poyatos, J. M.; Muñio, M. M.; Almecija, M. C.; Torres, J. C.;
Hontoria, E.; Osorio, F.; Water, Air, Soil Pollut. 2010, 205, 187. 36. Giri, A. S.; Golder, A. K.; Ind. Eng. Chem. Res. 2014, 53, 1351. 37. Assumpção, M. H. M. T.; Moraes, A.; De Souza, R. F. B.; Reis,
R. M.; Rocha, R. S.; Gaubeur, I.; Calegaro, M. L.; Hammer, P.; Lanza, M. R. V.; Santos, M. C.; Appl. Catal.-A: Gen. 2013, 462-463, 256.
Submitted on: April 16, 2014
Published online: July 4, 2014