www.atmos-chem-phys.net/13/8411/2013/ doi:10.5194/acp-13-8411-2013
© Author(s) 2013. CC Attribution 3.0 License.
Atmospheric
Chemistry
and Physics
Geoscientiic
Geoscientiic
Geoscientiic
Geoscientiic
Primary and secondary organic aerosol origin by combined
gas-particle phase source apportionment
M. Crippa1, F. Canonaco1, J. G. Slowik1, I. El Haddad1, P. F. DeCarlo1,*, C. Mohr1,**, M. F. Heringa1,***,
R. Chirico1,****, N. Marchand2, B. Temime-Roussel2, E. Abidi2, L. Poulain3, A. Wiedensohler3, U. Baltensperger1, and
A. S. H. Pr´evˆot1
1Laboratory of Atmospheric Chemistry, Paul Scherrer Institute, 5232 PSI Villigen, Switzerland 2Aix-Marseille Universit´e, CNRS, LCE FRE 3416, 13331 Marseille, France
3Leibniz Institute for Tropospheric Research, Permoserstr 15, 04318 Leipzig, Germany
*now at: Department of Civil, Architectural, and Environmental Engineering and Department of Chemistry, Drexel
University, Philadelphia, PA 19104, USA
**now at: Department of Atmospheric Sciences, University of Washington, Seattle, WA 98195, USA ***now at: WIL Research, 5203 DL’s-Hertogenbosch, the Netherlands
****now at: Italian National Agency for New Technologies, Energy and Sustainable Economic Development (ENEA),
UTAPRAD-DIM, Via E. Fermi 45, 00044 Frascati, Italy
Correspondence to:M. Crippa (monica.crippa@psi.ch)
Received: 8 February 2013 – Published in Atmos. Chem. Phys. Discuss.: 28 March 2013 Revised: 12 July 2013 – Accepted: 12 July 2013 – Published: 26 August 2013
Abstract. Secondary organic aerosol (SOA), a prominent fraction of particulate organic mass (OA), remains poorly constrained. Its formation involves several unknown precur-sors, formation and evolution pathways and multiple natu-ral and anthropogenic sources. Here a combined gas-particle phase source apportionment is applied to wintertime and summertime data collected in the megacity of Paris in order to investigate SOA origin during both seasons. This was pos-sible by combining the information provided by an aerosol mass spectrometer (AMS) and a proton transfer reaction mass spectrometer (PTR-MS). A better constrained appor-tionment of primary OA (POA) sources is also achieved us-ing this methodology, makus-ing use of gas-phase tracers. These tracers made possible the discrimination between biogenic and continental/anthropogenic sources of SOA. We found that continental SOA was dominant during both seasons (24– 50 % of total OA), while contributions from photochemistry-driven SOA (9 % of total OA) and marine emissions (13 % of total OA) were also observed during summertime. A semi-volatile nighttime component was also identified (up to 18 % of total OA during wintertime). This approach was success-fully applied here and implemented in a new source appor-tionment toolkit.
1 Introduction
Organic compounds enter Earth’s atmosphere through pri-mary biogenic emissions from terrestrial and marine ecosys-tems and anthropogenic sources such as traffic and resi-dential heating (Hallquist et al., 2009). They comprise an immensely complex mixture of gas (volatile organic com-pounds, VOCs) and particle (organic aerosol, OA) phase species in continuous evolution in the atmosphere through reversible phase partitioning, dry and wet deposition and chemical reactions with oxidant species such as OH (day-time) and NO3(nighttime) (Warneke et al., 2004). Such
To describe the interaction between OA and VOCs, Robin-son et al. (2007) combined laboratory and ambient stud-ies, accounting both for the gas-particle partitioning of POA (since most primary emissions are semi-volatile, the amount of available POA depends on the gas-particle partitioning) and the gas phase oxidation of low-volatility vapors to pro-duce SOA. Donahue et al. (2006) proposed the volatility ba-sis set approach (VBS) which bins compounds according to their saturation vapor pressure (C*) to describe their volatil-ity evolution due to temperature and chemistry both in the gas and condensed phases. This VBS approach was further de-veloped by the 2-D framework for OA aging (Jimenez et al., 2009; Donahue et al., 2011), which describes the evolution of organic compounds when they undergo oligomerization (producing less volatile compounds with similar O : C ra-tio), oxygenation reactions (leading to the formation of lower volatility compounds with higher O : C ratio due to function-alization) or fragmentation (producing higher volatility com-pounds with high O : C ratio) in the atmosphere. The rel-ative importance of fragmentation versus functionalization was investigated by Donahue et al. (2012) and by Kroll et al. (2009).
In recent years, source apportionment of the organic frac-tion has been advanced by applicafrac-tion of the positive matrix factorization (PMF) receptor model to aerosol mass spec-trometer data (Lanz et al., 2007, 2010; Ng et al., 2010) and proton transfer reaction mass spectrometer (PTR-MS) mea-surements (Vlasenko et al., 2009; Yuan et al., 2012). Sev-eral studies (Zhang et al., 2007; Jimenez et al., 2009; Lanz et al., 2007, 2010; El Haddad et al., 2013) demonstrated the predominance of SOA relative to POA emitted from sources such as traffic (referred to as hydrocarbon-like OA, HOA) and wood burning (WBOA, although sometimes it is dom-inant) even in urban atmospheres (especially in Europe). These observations require higher SOA yields and produc-tion rates than those currently utilized by models. Major un-certainties include the sources and structure of the main SOA precursors and the processes by which they produce SOA (Hallquist et al., 2009). Several studies show the possibility to discriminate SOA components based on volatility, degree of oxygenation, etc. (e.g., semi-volatile and low-volatility oxygenated OA (SV-OOA and LV-OOA), Lanz et al., 2007; Heringa et al., 2012), but often no information about the emitting source (anthropogenic or biogenic) or the governing chemical/physical processes can be retrieved together with the characterization of the entire OA mass.
Here, an experimental OA/VOCs source apportionment approach is presented, adapting the methodology of Slowik et al. (2010), and applied to two measurement field cam-paigns performed in Paris in summer 2009 and winter 2010. The combination of organic particle measurements provided by the AMS (aerosol mass spectrometer) with co-located VOC measurements by a PTR-MS (proton transfer reaction mass spectrometer) allows (i) a more robust POA/SOA AMS classification, (ii) a better characterization of the secondary
processes involving both organic phases, and (iii) identifica-tion of gaseous precursors for specific OA sources. Results from this experimental procedure are described and com-pared with previous PMF results applied to the AMS dataset only.
2 Methodologies
Two intensive measurement field campaigns were performed within the MEGAPOLI project (Megacities: Emissions, ur-ban, regional and Global Atmospheric POLlution and cli-mate effects, and Integrated tools for assessment and mitiga-tion, http://megapoli.dmi.dk/index.html) in the Parisian area during summertime (1–31 July 2009) and wintertime (15 January–15 February 2010) (Beekmann et al., 2013). The measurements took place at an urban site in the core of the metropolitan area of Paris located in the garden and roof of the Le Laboratoire d’Hygi`ene de la Ville de Paris (LHVP, 48.83◦ latitude, 2.36◦ longitude, 55 m above sea level). A PM10 inlet was located at∼6 m above ground level and a
comprehensive suite of particle and gas-phase instrumenta-tion was deployed at the site. Details about the instruments used at the LHVP site during the summer 2009 and winter 2010 campaigns can be found in Freutel et al. (2013) and Crippa et al. (2013a), respectively. Here we primarily dis-cuss particle composition measurements from an Aerodyne aerosol mass spectrometer (AMS, Aerodyne, Billerica, USA) and VOC measurements from an Ionicon proton transfer re-action mass spectrometer (PTR-MS, Ionicon Analytik, Inns-bruck, Austria).
Meteorological conditions were significantly different dur-ing the two campaigns. Marine air masses influenced the continent during the summer period, resulting in very low PM concentrations, while continental air masses strongly af-fected the air pollution in Paris during wintertime (especially in the middle and at the end of the campaign), enhancing aerosol concentrations.
2.1 Instrumentation
2.1.1 AMS
The AMS provides real time chemical composition and size distribution of PM1 non-refractory species, defined
as species that flash vaporize at 600◦C and 10−5 Torr.
time-of-flight mass spectrometry. The time resolution of the deployed AMS was 10 min; details regarding the sampling protocol, AMS data analysis, applied corrections (collection efficiency, relative ionization efficiencies, etc.) can be found elsewhere (Freutel et al., 2013; Crippa et al., 2013a). Here the organic mass spectral time series with unit mass reso-lution is used as input for the positive matrix factorization (PMF) source apportionment model (see Sect. 2.2), together with the corresponding time series of measurement uncer-tainties (Allan et al., 2003). For the purposes of PMF, the AMS uncertainty matrix accounts for electronic noise (which corresponds to a minimum random error in the number of ions detected during the sampling period), ion-to-ion vari-ability at the detector and ion counting statistics, where the probability that a single molecule is ionized and detected is approximated as a Poisson distribution (Allan et al., 2003). In order to perform PMF, 268 AMS ions were considered (m/z range up to 300) and error pretreatment procedures were applied according to Ulbrich et al. (2009), as discussed below. Low signal-to-noise m/z values (SNR<0.2) were removed, whereas “weak” variables (0.2<SNR<2) were downweighted by a factor of 2. In the AMS data analysis pro-cedure, certain organic peaks are not directly measured but rather calculated as a fraction of the organic signal atm/z44 (Allan et al., 2004). The errors for thesem/zwere adjusted to prevent overweighting of them/z44 signal, following the method of Ulbrich et al. (2009); of thesem/z44-dependent peaks,m/z19 and 20 were simply removed due to their neg-ligible masses.
2.1.2 PTR-MS
A high sensitivity proton transfer reaction mass spectrome-ter (HS-PTR-MS) provided online measurements of the con-centrations of volatile organic compounds with a time res-olution of 2.5 min. Ionization occurs by the chemical reac-tion of H3O+ions with gas phase species (R) having higher
proton affinities than water (Eq. 1). The resulting ion (RH+)
is subsequently detected by a quadrupole mass spectrometer (Lindinger et al., 1998).
H3O++R→RH++H2O (1)
The proton transfer reaction is a soft ionization technique, which reduces fragmentation compared to, e.g., electron ionization used by the AMS (Lindinger et al., 1998; de Gouw and Warneke, 2007). Volume mixing ratios (VMR) are obtained from the difference between the ion count rate (Icc=off)and the background signals(Icc=on)in the system.
Background measurements are performed using a catalytic converter heated to 350◦C, which efficiently removes VOCs
from the inlet flow (de Gouw and Warneke, 2007):
VMR= 1
IH3O+·S
·(Icc=off−Icc=on) (2)
Therefore, the error associated with the VMR (1VMR) can be calculated as follows, assuming that the statistical error is the main source of error inIcc=onandIcc=off(de Gouw et al.,
2003):
1VMR= 1
IH3O+·S ·
s Icc=off
τcc=off
+Icc=on
τcc=on
, (3)
whereτ represents the dwell time with the catalyst on and off,IH3O+ the count rate of H3O+ ions (in 106 counts s−1) andS the species-dependent sensitivity needed to calculate PTR-MS concentrations based on theoretical prediction (de Gouw and Warneke, 2007). This value is used as the uncer-tainty input for source apportionment analysis.
In this work, the signals of 34 selected ions were moni-tored during both campaigns with dwell times ranging from 1 to 10 s. The PTR-MS was operated at standard condi-tions, i.e., using a 2.25 mbar ion drift pressure and a drift field intensity of 130 Td. These conditions limit cluster-ing and VOC-water adduct formation. For the PMF analy-sis, ions affected by water clusters were removed (m/z 39 corresponding to H3O+·H2O and m/z55 corresponding to
H3O+·(H2O)2), as well as those contaminated by laboratory
application of solvents (e.g., acetonitrile atm/z 42). A to-tal 28 ions were included in the winter PMF analysis and 27 in the summer analysis (see Tables 1 and 2). During the campaigns, background measurements were performed ev-ery 4 days for 30 min and the resulting backgrounds were subtracted from the measurements prior to PMF analysis.
Differently from the AMS dataset treatment for PMF, no minimum error was applied to the PTRMS data since for all the variables the corresponding errors were bigger or compa-rable to three times the background variability.
Finally, note that quadrupole PTR-MS is capable only of unit mass resolution analysis, and that the assignment of each PTR-MS m/z to a specific ion (or parent compound) was therefore not always possible.
2.2 Positive matrix factorization on combined datasets
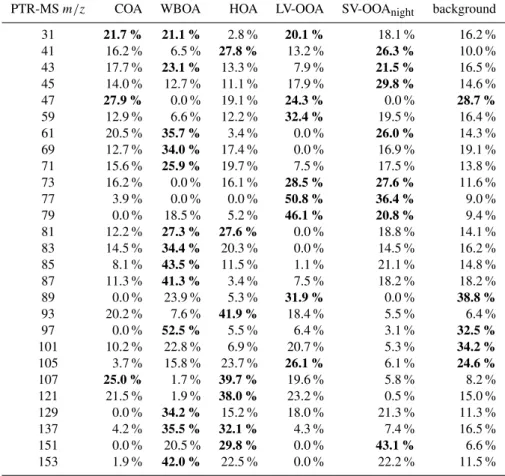
Table 1.Relative source contribution to each PTR-MSm/z(winter campaign). Bold numbers refer to the sources with the highest contribu-tion to each PTR-MS mass.
PTR-MSm/z COA WBOA HOA LV-OOA SV-OOAnight background
31 21.7 % 21.1 % 2.8 % 20.1 % 18.1 % 16.2 %
41 16.2 % 6.5 % 27.8 % 13.2 % 26.3 % 10.0 % 43 17.7 % 23.1 % 13.3 % 7.9 % 21.5 % 16.5 % 45 14.0 % 12.7 % 11.1 % 17.9 % 29.8 % 14.6 %
47 27.9 % 0.0 % 19.1 % 24.3 % 0.0 % 28.7 %
59 12.9 % 6.6 % 12.2 % 32.4 % 19.5 % 16.4 % 61 20.5 % 35.7 % 3.4 % 0.0 % 26.0 % 14.3 % 69 12.7 % 34.0 % 17.4 % 0.0 % 16.9 % 19.1 % 71 15.6 % 25.9 % 19.7 % 7.5 % 17.5 % 13.8 % 73 16.2 % 0.0 % 16.1 % 28.5 % 27.6 % 11.6 % 77 3.9 % 0.0 % 0.0 % 50.8 % 36.4 % 9.0 % 79 0.0 % 18.5 % 5.2 % 46.1 % 20.8 % 9.4 % 81 12.2 % 27.3 % 27.6 % 0.0 % 18.8 % 14.1 % 83 14.5 % 34.4 % 20.3 % 0.0 % 14.5 % 16.2 % 85 8.1 % 43.5 % 11.5 % 1.1 % 21.1 % 14.8 % 87 11.3 % 41.3 % 3.4 % 7.5 % 18.2 % 18.2 % 89 0.0 % 23.9 % 5.3 % 31.9 % 0.0 % 38.8 % 93 20.2 % 7.6 % 41.9 % 18.4 % 5.5 % 6.4 % 97 0.0 % 52.5 % 5.5 % 6.4 % 3.1 % 32.5 % 101 10.2 % 22.8 % 6.9 % 20.7 % 5.3 % 34.2 % 105 3.7 % 15.8 % 23.7 % 26.1 % 6.1 % 24.6 %
107 25.0 % 1.7 % 39.7 % 19.6 % 5.8 % 8.2 %
121 21.5 % 1.9 % 38.0 % 23.2 % 0.5 % 15.0 % 129 0.0 % 34.2 % 15.2 % 18.0 % 21.3 % 11.3 % 137 4.2 % 35.5 % 32.1 % 4.3 % 7.4 % 16.5 % 151 0.0 % 20.5 % 29.8 % 0.0 % 43.1 % 6.6 % 153 1.9 % 42.0 % 22.5 % 0.0 % 22.2 % 11.5 %
outlier treatment mode (in which outliers are dynamically downweighted) rather than the “pseudo-robust” technique used by Slowik et al. (2010) (in which the PMF algorithm is run in the “true” mode, outliers are identified and down-weighted, and the algorithm is run again in the “true” mode with these adjusted uncertainties). No constraints were ap-plied to the mass spectrum or time series. Configuration of ME-2 inputs and analysis of the results was performed in a new toolkit for Igor Pro (Wavemetrics, Inc., Portland, OR, USA) developed at the Paul Scherrer Institute (Canonaco et al., 2013).
Briefly, the PMF model describes the observation (in our case the AMS and PTR-MS measurements,xij)as a linear
combination of a number of factors p (related to sources and/or processes during post-analysis) for each time stepi andm/z j, whose contribution over time is always positive (gij)and whose mass spectra (fij)are static (see Eq. 4).
xij= p
X
k=1
gik·fkj+eij (4)
Hereeij are the residuals, defined as the point-by-point
dif-ference between the input data and the model solution. The algorithm iteratively minimizes the quantityQ(see Eq. 5),
which represents the sum of the squares of the uncertainty-scaled residuals across the entire dataset (Paatero and Tapper, 1994; Paatero, 1999):
Q=X
i
X
j
(eij/sij)
2
. (5)
Heresij denote the measurement uncertainties. When
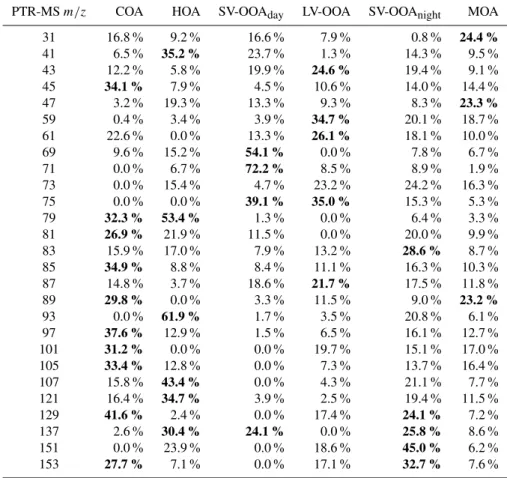
Table 2.Relative source contribution to each PTR-MSm/z(summer campaign). The average contribution of the two separated marine factors is reported here. Bold numbers refer to the sources with the highest contribution to each PTR-MS mass.
PTR-MSm/z COA HOA SV-OOAday LV-OOA SV-OOAnight MOA
31 16.8 % 9.2 % 16.6 % 7.9 % 0.8 % 24.4 % 41 6.5 % 35.2 % 23.7 % 1.3 % 14.3 % 9.5 % 43 12.2 % 5.8 % 19.9 % 24.6 % 19.4 % 9.1 %
45 34.1 % 7.9 % 4.5 % 10.6 % 14.0 % 14.4 %
47 3.2 % 19.3 % 13.3 % 9.3 % 8.3 % 23.3 % 59 0.4 % 3.4 % 3.9 % 34.7 % 20.1 % 18.7 % 61 22.6 % 0.0 % 13.3 % 26.1 % 18.1 % 10.0 % 69 9.6 % 15.2 % 54.1 % 0.0 % 7.8 % 6.7 % 71 0.0 % 6.7 % 72.2 % 8.5 % 8.9 % 1.9 % 73 0.0 % 15.4 % 4.7 % 23.2 % 24.2 % 16.3 % 75 0.0 % 0.0 % 39.1 % 35.0 % 15.3 % 5.3 %
79 32.3 % 53.4 % 1.3 % 0.0 % 6.4 % 3.3 %
81 26.9 % 21.9 % 11.5 % 0.0 % 20.0 % 9.9 %
83 15.9 % 17.0 % 7.9 % 13.2 % 28.6 % 8.7 %
85 34.9 % 8.8 % 8.4 % 11.1 % 16.3 % 10.3 %
87 14.8 % 3.7 % 18.6 % 21.7 % 17.5 % 11.8 %
89 29.8 % 0.0 % 3.3 % 11.5 % 9.0 % 23.2 %
93 0.0 % 61.9 % 1.7 % 3.5 % 20.8 % 6.1 %
97 37.6 % 12.9 % 1.5 % 6.5 % 16.1 % 12.7 %
101 31.2 % 0.0 % 0.0 % 19.7 % 15.1 % 17.0 %
105 33.4 % 12.8 % 0.0 % 7.3 % 13.7 % 16.4 %
107 15.8 % 43.4 % 0.0 % 4.3 % 21.1 % 7.7 % 121 16.4 % 34.7 % 3.9 % 2.5 % 19.4 % 11.5 %
129 41.6 % 2.4 % 0.0 % 17.4 % 24.1 % 7.2 %
137 2.6 % 30.4 % 24.1 % 0.0 % 25.8 % 8.6 % 151 0.0 % 23.9 % 0.0 % 18.6 % 45.0 % 6.2 %
153 27.7 % 7.1 % 0.0 % 17.1 % 32.7 % 7.6 %
an instrument-dependent weighting procedure to ensure that both instruments are well-represented in the solution. This criterion is evaluated by comparing the mean of the absolute value of AMS and PTR-MS scaled residuals, denoted as1E (Slowik et al., 2010), as discussed below in Eq. (8).
The scaling procedure is performed through the applica-tion of a scaling value (CPTR)to the PTR-MS component of
the error matrix to obtain new PTR-MS errors (sij,new):
sij,new=
sij
CPTR
. (6)
An unweighted solution will correspond toCPTR =1;CPTR
values greater than 1 decrease the PTR-MS errors and there-fore more importance is given by the algorithm during the iteration to represent these data because they constitute a larger fraction ofQ, while the opposite effect is produced byCPTR<1.CPTRscaling values were selected in the range
0.1–1 with a step of 0.1 and from 1 to 10 with a step of 1. The AMS components of the uncertainty matrix were left unchanged.
Outlier treatment is also needed when running PMF. Out-liers are defined by Paatero and Hopke (2003) as data points for which the following relationship is satisfied:|eij/sij|>
α(whereαis user-defined and is typically set to 4). A “ro-bust mode” was developed for PMF to minimize outlier ef-fects (Paatero and Hopke, 2003). In this mode, outliers are dynamically downweighted at each step of the solution pro-cess according to
sij,downweighted=hijsij=
r
eijsij,new
α
, (7)
wherehij are the downweighting factors which are equal to
1 unless the outlier condition is satisfied. This outlier down-weighting was applied dynamically within the ME-2 proce-dure, and thus represents a significant improvement over the protocol of Slowik et al. (2010), where static downweighting was applied externally.
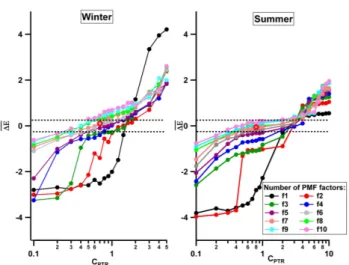
Potentially satisfactory solutions, in which both instru-ments are well-represented, are identified using the1E pa-rameter, which compares the mean of the absolute value of scaled residual of the AMS and PTR-MS components of the unified dataset (see Eq. 8).1E depends on both the scal-ing value CPTR (see Fig. 1) and the number of factors in
Fig. 1.1Evalues as function of the number of PMF factors (col-ors) andCPTRfor the winter and summer campaigns. PMF
solu-tions within the dashed lines (corresponding to 25 % deviation from 1Eequal to zero) were analyzed in detail. The selected wintertime chosen solution has 6 factors and aCPTR of 0.7, producing a1E
value of−0.025. The summertime solution has 7 factors andCPTR
of 0.8, producing a1Evalue of−0.053. The chosen solutions are represented by the red circles.
an over-estimation of the AMS dataset. In the present study, we considered solutions with−0.25< 1E <0.25.
1E=
eij
sij
!
AMS
−
eij
sij
!
PTRMS
(8) Note that the object functionQ, which is minimized during PMF execution, is calculated using the instrument-weighted errors with CPTR, while 1E is evaluated considering the
original errors. Selection of the “best” solution among those satisfying the1E criterion is similar to conventional PMF analysis and is discussed further in Sect. 3.
2.3 Other data and source apportionment methods
Black carbon concentrations were measured using a 7-wavelength aethalometer measurement device (MAGEE Sci-entific, model AE31-ER). Levoglucosan and methanesul-fonic acid were measured using PM2.5 filters (quartz fiber
filters, Tissuquartz®) analyzed by high-performance liquid chromatography with a mass spectrometric detector (Piot et al., 2012) and ion chromatography coupled with a conductiv-ity detector, respectively.
In Sect. 3, results from the coupled PMF method dis-cussed above are compared to other apportionment tech-niques, specifically (1) PMF of the AMS-only dataset (de-noted as PMFAMS); (2) BC source apportionment based on
the wavelength dependence of optical absorption; (3) tracer-based estimation of wood burning using levoglucosan; and (4) estimation of traffic POA emissions from BC measure-ments and reference OM/BC ratios. The PMF solutions of
the PTR-MS-only dataset are not discussed here because we focus mainly on the quantification of sources contributing to the organic particle phase. Results from these methods have been presented in previous publications, as discussed below. Method 1 (PMFAMS) provides the identification of OA
primary and secondary sources. In our case, during win-tertime, five sources were identified: hydrocarbon-like OA (HOA), cooking OA (COA) and wood burning OA (WBOA) as primary emissions, while the secondary fraction consists of oxygenated OA (OOA) and an oxygenated component mixed with WBOA (OOA2-BBOA) (Crippa et al., 2013a).
In summertime, the PMFAMS identified three components:
COA, HOA and OOA (Freutel et al., 2013).
Method 2 (the aethalometer model) can be used to esti-mate the BC fraction emitted by different sources (e.g., traf-fic and wood burning, BCtrand BCwb), based on the
wave-length dependence of light absorption (Sandradewi et al., 2008; Healy et al., 2012), with the OM/BC ratios for pri-mary traffic and wood burning estimated from the literature. For traffic the OM/BCtr ratio was assumed to be 0.4 but it
can vary from 0.2 up to 0.6 (Chirico et al., 2010; Favez et al., 2010). Wood burning conditions strongly affect the OM/BC and OM/levoglucosan ratios associated with this source. The OM/BC ratio for wood burning is reported to vary in smog chamber experiments between 1.6 and 3.5 (Grieshop et al., 2009; Heringa et al., 2011); however, much higher values are found in the ambient atmosphere (Favez et al., 2010; Sciare et al., 2011). A value of 15.1 was assumed here based on the measurements performed by Sciare et al. (2011) in the same region. The major source of BC was found to be traffic both during summer and winter, although during wintertime wood burning is also significant (∼20 %) (Crippa et al., 2013a).
Fig. 2. Wintertime AMS and PTR-MS source mass spectra sep-arated with the combined PMF approach. The spectra compari-son with the PMFAMSsolution is also represented (Crippa et al.,
2013a). Each mass spectrum is normalized to 1 both for the AMS and PTR-MS.
3 Results
In this section PMF results retrieved from the combined PMFAMS-PTRMS for each season are presented individually,
technically validated and compared with previous results ob-tained using PMF on AMS data only (PMFAMS).
The solution was chosen based on several criteria: (i) se-lection of CPTR values yielding near-zero 1E values
(be-tween−0.25 and+0.25) (Fig. 1), (ii) interpretation of mass spectra and comparison with reference spectra (Figs. 2 and 5), (iii) temporal correlation of the identified sources with complementary measurements (Figs. 3 and 6), and (iv) time series diurnal patterns (Sect. SI-2 of the Supplement).
First, based on the 1Ecriterion described in Sect. 2.2, a set of possible solutions was explored within the range 1E=0±0.25, considering from 1 to 10 factors. Solutions failing to satisfy this1Ecriterion were discarded from fur-ther analysis. The effect of the instrument weighting proce-dure was also monitored for each solution through the resid-ual diagnostic graphs (see also Sect. SI-4 of the Supplement). The remaining solutions were evaluated in terms of their physical meaning by analysis of diurnal variations, correla-tion with reference mass spectra and external time series as done in conventional PMF.
The coupled PMF solutions are discussed below, focus-ing on their differences from conventional AMS-only PMF. Also, a comparison of results obtained from the source ap-portionment techniques discussed in Sect. 2.3 is presented to evaluate the uncertainties in the different approaches. Since the main aim of this paper is to use the PTR-MS VOC data to improve the apportionment of particulate organic sources (OA), the nomenclature adopted for the retrieved PMFAMS-PTRMSOA sources will be used both when
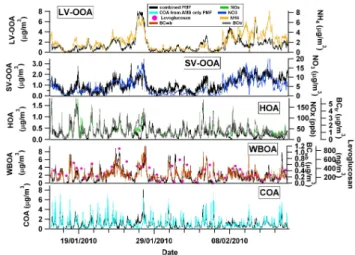
refer-Fig. 3.Time series correlations between the retrieved PMF factors and external data (winter campaign). PMF factors concentrations refer only to the AMS fraction. The PTR-MS factors have the same temporal variation as the AMS ones but different absolute and rela-tive concentrations.
ring to the particulate and gaseous fractions. First, the winter case is explored, reporting results from the PMFAMS-PTRMS
approach (Sect. 3.1.1) and the comparison with other source apportionment methods (Sect. 3.1.2). Then the summer case is discussed, both in terms of combined PMF re-sults (Sect. 3.2.1) and comparison with other approaches (Sect. 3.2.2).
3.1 The winter case
3.1.1 Wintertime OA sources and VOC tracers
The chosen solution for the winter dataset consisted of six interpretable factors at aCPTRvalue of 0.7, yielding1E=
−0.025 (Fig. 1). One of the factors consisted almost entirely of VOC species and was related to the PTR-MS background variability; this factor is therefore excluded from the follow-ing discussion of ambient factors (for additional information, see Sect. SI-5 of the Supplement). The other 5 factors were related to those obtained by PMFAMS(Crippa et al., 2013a).
However, the PMFAMS-PTRMS analysis provided improved
separation of the primary and secondary factors compared to the PMFAMSanalysis. OA was here apportioned to three
pri-mary sources, including traffic (HOA), cooking (COA) and wood burning (WBOA), and two secondary fractions, includ-ing a low volatility (LV-OOA) and a semi-volatile (SV-OOA) oxygenated organic aerosol.
The AMS and PTR-MS factor mass spectra are shown in Fig. 2 and compared with those deconvolved by the PMFAMS
HOA mass spectrum from the combined PMF approach (see Fig. 2).
Figure 3 shows the correlation of the factor time series with external data, while the contribution of each factor to the total intensity of a PTR-MSm/zis shown in Table 1. Traffic, representing 6 % of total OA (see Fig. 8 below), dominates the gaseous alkane and alkene fragments (m/z 41, C3H+5)
and aromatics, such as benzene (m/z 79, C6H+6), toluene
(m/z 93, C7H+8), C8 aromatics and/or benzaldehyde (m/z
107, C7H6O+ and/or C8H11+), C9 aromatics (m/z C9H+13)
and/or tolualdehyde (m/z121, C8H8O+ and/or C9H+13), in
agreement with studies in the literature (Jordan et al., 2009; Slowik et al., 2010). Additionally, Vlasenko et al. (2009) per-formed VOC source apportionment using PMF on a set of PTR-MS masses, identifying significant contributions atm/z 41, 43, 45, 57, 79, 93, 105, 107, 121, 135 for primary anthro-pogenic emissions, consistent with our observations.
Cooking emissions (18 % of OA mass) were characterized by a prominent diurnal pattern with increases during meal times (Fig. SI-2.1). The PMFAMS and PMFAMS-PTRMS
ap-proach yielded similar results, meaning that the contribution of this source is not affected by any included gas phase tracer and that it was already clearly separated by PMFAMS.
Cook-ing has only recently been identified as an important source of primary OA (He et al., 2010; Sun et al., 2012; Mohr et al., 2012; Crippa et al., 2013a), and there is currently a need to identify atmospheric tracers for this source. Data on gas-phase emissions from cooking processes are very scarce, and therefore it is possible that optimal gas-phase cooking trac-ers occur at ions that were not selected for measurement by the PTR-MS. Previous measurements of VOCs from cooking identified mainly aldehydes and furan derivatives (Schauer et al., 2002). The PMF analyses indicate that cooking emis-sions only marginally impact the gas phase species selected for measurement. Of this subset, potential tracers include m/z89, 97, 101, 129. Preliminary PTR-TOF-MS measure-ments of emissions from heated oils conducted in our labo-ratory (unpublished) suggest some of thesem/zrelate to fu-ran derivatives (e.g., substituted fufu-rans atm/z97, C6H9O+)
and alcohol and/or aldehyde fragments (e.g. C7H+13atm/z97
andm/z115 possibly corresponding to the dehydrated pro-tonated ion C7H15O+). The COA factor mass spectrum also
includes peaks often associated with aromatic compounds, namelym/z107 (C8aromatics) and 121 (C9aromatics). The
presence of these species in cooking emissions is consistent with the findings of Slowik et al. (2010) and with our lab-oratory measurements. Possible explanations are (i) aromat-ics emitted from charbroiling-type meat cooking, (ii) con-temporary emission and overlap between cooking and traffic sources due to geographical conditions, and (iii) mixture of HOA and COA due to meteorological conditions, transport and common back trajectories/wind direction. Further emis-sion measurements are needed to identify gas phase tracers from cooking processes and characterize their true chemical
nature. The lack of a dominant contribution from a partic-ular VOC in Table 1 also indicates that the selected subset of PTR-MS masses does not contain a good cooking marker. Future high resolution PTR-MS measurements would indeed provide more resolved and comprehensive information on the gas-phase composition, which may aid the identification of specific cooking emission markers.
Concerning wood burning emissions (33 % of OA mass), a number of studies report acetonitrile (m/z 42, CH3CN+)
and acetic acid (m/z61, C2H4O+2)(Holzinger et al., 2005;
Jordan et al., 2009) as important gas-phase wood burn-ing tracers. However, in the present study m/z 42 was ex-cluded from the PTR-MS dataset due to local contamina-tion from the laboratory exhausts located on the roof of the LHVP building (acetonitrile was used in extraction sys-tems and for a high performance liquid chromatography (HPLC) detection method). Other VOCs reported to have wood burning as a major source include formaldehyde, (m/z 31, CH2O+), methanol (m/z 33, CH4O+), acetaldehyde
(m/z 45, C2H4O+), and acetone (m/z 59, (CH3)2CO+)
(Holzinger et al., 1999, 2005; Schauer et al., 2001; Chris-tian et al., 2003). In the present work, wood burning mainly contributed significantly to the following PTR-MS masses, consistent with the literature:m/z61 (acetic acid, as found by Jordan et al., 2009); m/z 97 (furan derivatives, C7
n-aldehydes fragment ion, as found by Schauer et al. (2001) and by Karl et al. (2007) with GC-PTRMS measurements); m/z 129 (naphthalene, C10H+9); m/z 137 (monoterpenes,
C10H+17); m/z 153 (C8H9O+3, vanillin and isomers, as
re-ported by Simoneit et al., 1999);m/z69 (isoprene (C5H+9)
and furan (C4H5O+)); m/z 71 (methacrolein (C4H7O+)
and/or methyl vinyl ketone (MVK, C4H7O+), alkane and
alkene fragments); m/z 85 (among possible candidates, ethyl vinyl ketone, alkanes and alkenes fragments, Akagi et al., 2011); andm/z 87 (among possible candidates, 2,3-butanedione, C4H7O+2, C-5 carbonyls, C5H11O+).
For the winter case, two secondary OA sources were sepa-rated, namely the LV-OOA and SV-OOA. LV-OOA was iden-tified as a major OA fraction, contributing 24 % to the total OA mass. Unsurprisingly, this fraction was found to dom-inate most of the oxygenated VOCs associated with long-range transported aged air masses, including, as possible can-didates, formic acid (m/z 47, CH3O+2), acetone (m/z 59,
C3H7O+), acetic acid (m/z61, C2H5O+2), methyl ethyl
ke-tone and methyl glyoxal (m/z 73, C4H9O+and C3H5O+2),
in agreement with the literature (Vlasenko et al., 2009; Jor-dan et al., 2009; Slowik et al., 2010; Bon et al., 2011). Inter-estingly, during wintertime LV-OOA was significantly cor-related with benzene (m/z 79), a tracer for anthropogenic emissions with a long lifetime (R2=0.47), and with peroxy-acetic nitric anhydride (R2=0.52) (PAN, CH3C(O)OONO2,
observed at m/z 77, corresponding to protonated perox-yacetic acid, C2H5O+3) produced by the oxidation of
and PAN were also mainly apportioned to the secondary sources (see Table 1). While benzene and PAN are thought to be mainly associated with traffic emissions, benzene can also be emitted from wood burning, and certain PANs can form from fire emissions as well, as shown by Crounse et al. (2009) for Mexico City. These results suggest that the air masses associated with LV-OOA were influenced by conti-nental/anthropogenic emissions, in agreement with previous findings for the Paris region, where air quality was found to be mainly affected by regional air masses (Beekmann et al., 2013).14C results revealed that the major fraction of OOA had a non-fossil origin (Beekmann et al., 2013), suggesting that biomass burning dominated the formation of this fraction compared to traffic. A possible explanation could be that the PTR-MS did not measure the relevant markers for biogenic oxidation products and therefore we cannot exclude the pres-ence of oxidation products coming from other sources (e.g., biogenic emissions) within the same air masses.
Finally, the SV-OOA factor represented 18 % of the total OA mass and was defined based on the observation that this fraction peaks during nighttime, showing an anti-correlation with the temperature, similar to nitrate.
3.1.2 Comparison of source apportionment methods (winter)
Comparisons between factor contributions and time series obtained by PMFAMS-PTRMS and PMFAMS are reported in
Fig. 4 and Fig. SI-1.1 of the Supplement. As noted above, PMFAMS-PTRMSand PMFAMSprovided qualitatively similar
factors; however, inclusion of VOC data in PMFAMS-PTRMS
reduced mixing between factors and improved correlations with independently measured tracer species. Even though no significant differences were obtained in terms of OA mass spectra between the two approaches, factor time series and contributions showed significant discrepancies.
Major differences within the primary sources were ob-tained for the wood burning factor, where much higher con-tributions were observed for PMFAMS-PTRMS. This increase
was caused by a clearer separation between the semi-volatile OA (termed OOA2-BBOA in Crippa et al., 2013a) and
WBOA, which were partially mixed in the PMFAMS solution
because they both increased during the night (Fig. SI-2.1). Including gas phase species in the PMF enhanced the cor-relation of SV-OOA and WBOA with NO−3 (e.g.,R2=0.55 for PMFAMS-PTRMSvs.R2=0.15 for the PMFAMS)and
lev-oglucosan (R2=0.83) (Fig. 3), respectively, suggesting that the PMFAMS-PTRMSsolution is more accurate. Finally, good
agreement between the two techniques was obtained for LV-OOA.
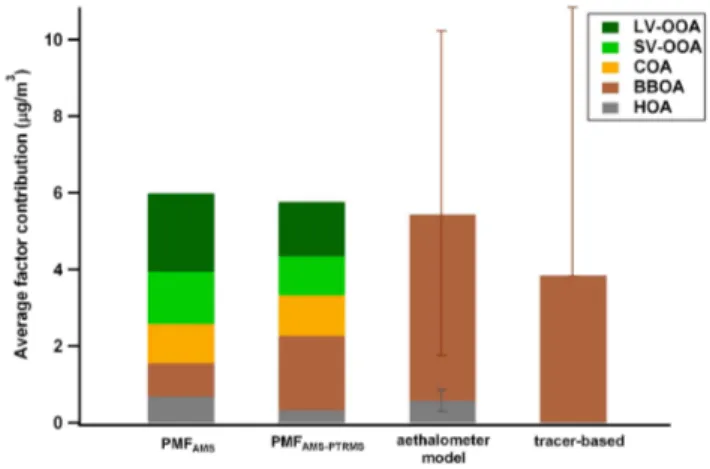
Figure 4 compares the PMFAMS-PTRMS and PMFAMS
with independent source apportionment approaches, includ-ing the aethalometer model and the tracer-based approaches. The comparison of all these techniques is crucial to es-timate the uncertainties associated with source
apportion-Fig. 4.Comparison of several source apportionment technique re-sults in estimating OA sources during wintertime. Note that the aethalometer and marker approaches were attempted only for HOA and WBOA.
ment, especially when considering different datasets and al-gorithms. Within the primary sources, the estimation of the cooking contribution was quite consistent between methods (PMFAMSvs. PMFAMS-PTRMS), as discussed above. On the
other hand, as traffic emits primary organic aerosols (HOA), black carbon and gaseous compounds (e.g., benzene, toluene, aromatics, etc.), different source apportionment techniques might be affected by the type of measurements used as in-put data. The HOA contribution provided by different appor-tionment methods varied between 0.29 and 0.69 µg m−3; the
biggest discrepancy is observed for the tracer-based estimate due to the variability in the assumption of the OM/BCtr
ra-tio. The comparison of WBOA contributions estimated using different methods clearly highlighted the uncertainties un-derlying the apportionment of this source: WBOA estimates spanned a wide range, between 0.87–4.8 µg m−3 (represent-ing from 15 to 83 % the total OA mass), depend(represent-ing on the apportionment technique considered. On one hand, PMFAMS
underestimates the WBOA contribution (0.87 µg m−3) due to the mixture of SOA and wood burning sources (Crippa et al., 2013a). On the other hand, including the gas phase species clearly enhanced the deconvolution of WBOA and increased its contribution (1.94 µg m−3), but WBOA esti-mated by PMFAMS-PTRMSremained lower than the estimates
obtained using the marker and aethalometer approaches (3.82 and 4.8 µg m−3, respectively). This is presumably
be-cause of an overestimation of the WBOA/levoglucosan and WBOA/BCwb ratios as represented by the error bars (note
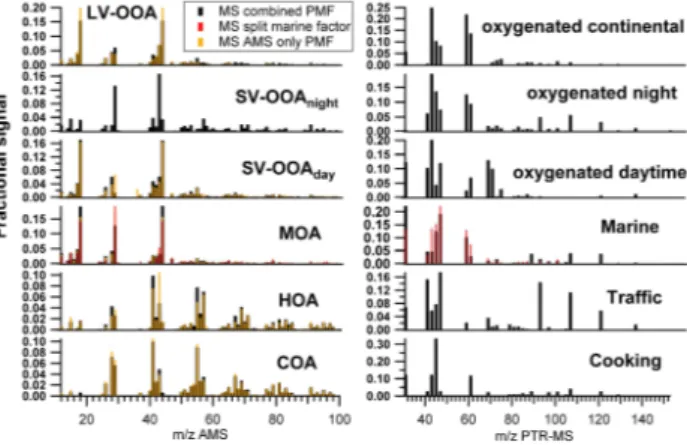
Fig. 5.Summertime AMS and PTR-MS source mass spectra sep-arated with the combined PMF approach. The spectra compari-son with the PMFAMSsolution is also represented (Crippa et al.,
2013b). In addition, in red the mass spectrum of the split marine factor from the 7-factor solution PMF is reported. Each mass spec-trum is normalized to 1 both for the AMS and PTR-MS.
Such an intercomparison exercise is very important; it highlights uncertainties related to the PMFAMSand marker
based approaches. While differences between these appor-tionment techniques were previously observed, especially in winter (Favez et al., 2010), our results highlight the potential of the combined PMFAMS-PTRMSin improving source
appor-tionment using PMF analysis. Meanwhile, there is a clear need for a better characterization of source emission profiles (marker to OA ratios) used in the apportionment.
3.2 The summer case
3.2.1 Summertime OA sources and VOC tracers
Combining the gas and particle phase datasets, we were able to distinguish seven factors. Two of them (HOA and COA) were identified as primary fractions. The others were related to secondary processes: LV-OOA (50 % of OA mass), nighttime SV-OOA (SV-OOAnight, 2 % of OA mass),
photochemistry-driven SV-OOA (SV-OOAday, 9 % of OA
mass) and marine OA (MOA, 13 % of OA mass). The PMF solution returned two marine factors, which were combined into a single factor. The MOA time series was calculated as the sum of the time series contributions of the correspond-ing factors, and the aggregate mass spectrum was calculated as the mass-weighted average of the corresponding MS. Fig-ure 1 shows the range of explored solutions as a function of the weighting parameterCPTR. The chosen solution
corre-sponds to aCPTRvalue of 0.8, providing a 1E= −0.053.
Figures 5 and 6 show the AMS and PTR-MS factor mass spectra and time series, respectively.
Traffic and cooking were identified as primary OA sources during summertime. The traffic factor mass spectrum is sim-ilar in summer and winter, as shown in Fig. SI-3.1 (see also
Fig. 6.Time series correlations between the retrieved PMF factors and external data (summer campaign). Green boxes delimit Atlantic polluted air masses identified with back trajectories, as reported by Freutel et al. (2013). PMF factors concentrations refer only to the AMS fraction. The PTR-MS factors have the same temporal varia-tion as the AMS ones but different absolute and relative contribu-tions.
Sect. 3.1.1). Likewise, the summer PTR-MS cooking spec-trum (see Table 2) shows non-negligible contributions from aromatics and acetaldehyde, consistent with the winter case and the findings of Slowik et al. (2010), although as dis-cussed above cooking activities are unlikely to constitute a major aromatic source. Further emission measurements are needed to characterize and quantify the contribution of gaseous emissions from cooking activities.
Concerning the secondary OA fractions, four components were separated during summertime (LV-OOA, SV-OOAnight,
SV-OOAday and MOA), although during some events these
SOA components showed a similar trend due to the role played by meteorology. As depicted in Fig. 6, during Atlantic polluted periods both the secondary sources and the HOA factor showed an increased mass concentration, meaning that during these events all factors were partially enhanced due to the contribution of polluted air masses. Similar to the winter case, LV-OOA represents the major OA fraction (50 %) and is mostly dominated by oxygenated VOCs (see Sect. 3.1.1 and Table 2). No insights about the anthropogenic or bio-genic origin of this fraction were retrieved due to the lack of PTR-MS measurements of oxidation products of anthro-pogenic and biogenic emissions. The LV-OOA factor does not correlate well with SO4, which is typically adopted as
sources to this factor peaking during the evening hours, as highlighted by its diurnal pattern (e.g., from cooking).
SV-OOAnightpeaks at night and shows an anti-correlation
with temperature, similar to nitrate. SV-OOAnightcontributes
very little (2 %) to the total OA mass in summer. However, it has major contributions to some of the VOCs. Compar-ing the SV-OOA MS obtained for the winter case with the SV-OOAnight MS from summer, them/z 44 tom/z 43
ra-tio of this fracra-tion varies substantially between summer and winter (0.20 and 1.39, respectively), suggesting different fea-tures between the 2 seasons. During summertime this SV-OOA fraction appears to be much more volatile than during wintertime, which could also explain its lower contribution in summer to total OA and the greater presence in the gas phase. During summertime the main VOC fragments contributing to this factor include (see Table 2)m/z 83, 129, 137, 151 and 153. Nighttime peaks of monoterpenes (m/z137) and their first generation products such as pinonaldehyde (m/z 151) were often observed in previous studies and were related to enhanced nighttime emissions during the warm season and reduced oxidation due to low OH levels (Talbot et al., 2005; Jordan et al., 2009).
From the comparison of summertime and wintertime SV-OOA, different gaseous tracers were identified, which sug-gests different governing processes. As discussed above, dur-ing summer this factor has a strong biogenic component. For winter, m/z 151 remains an important peak, but signals at m/z 41, 43, 45, 61, 73, 77, 79 suggest a possible anthro-pogenic origin.
SV-OOAday exhibited a correlation with ambient
temper-ature. Additional correlations with isoprene and its oxida-tion products suggest that this factor arises in large part from locally-formed biogenic SOA (although isoprene may be also emitted by anthropogenic sources such as oil and wood com-bustion, gasoline, tobacco etc., Adam et al., 2006). Isoprene (m/z 69), MVK/methacrolein (m/z 71) and monoterpenes (m/z 137) were the characteristic VOCs of this factor, in agreement with results reported by Jordan et al. (2009). Iso-prene and monoterpenes are in fact emitted by plants dur-ing daytime and with increasdur-ing temperatures, while MVK and methacrolein are the major isoprene oxidation products. These results are in agreement with14C measurements per-formed during the MEGAPOLI summer campaign, which show summertime SOA being primarily non-fossil (80 %) (Beekmann et al., 2013).
Finally, marine organic aerosol was found to contribute 13 % to the total OA mass during the summer campaign, pos-sibly due to high biological activity of the ocean in this sea-son and the occurrence of oceanic air masses impacting the continent. Interestingly, marine emissions seem to dominate several secondary VOCs, including formaldehyde (m/z31) and formic acid (m/z47) in summer. Vlasenko et al. (2010) observed formaldehyde sensitivity being affected by humid-ity effects; however, we did not find an indication of
overes-timation due to a correlation with RH or water clusters (m/z 39 and 55) measured by the PTR-MS.
3.2.2 Comparison of source apportionment methods (summer)
Similarly to the winter case, results are here compared to sev-eral AMS-PMF estimates previously proposed for the same campaign (Fig. 7). Freutel et al. (2013) proposed a three-factor solution consisting of OOA, HOA and COA, based on unit mass resolution (UMR) PMF analysis. PMF analysis of high resolution AMS data for the same campaign at an-other site in Paris (SIRTA, Paris urban background) (Crippa et al., 2013b) yielded a five-factor solution: COA, HOA, con-tinental LV-OOA, concon-tinental SV-OOA, and a marine factor (MOA) associated with oceanic air masses. Because aerosol composition was shown to be remarkably similar throughout the Paris region (Beekmann et al., 2013), it is reasonable to compare these results to the apportionment obtained in the present work. Since no additional sources could be clearly separated by the UMR PMF applied to the AMS data only, for comparison, the three- (COA, HOA and OOA) and the five- (COA, HOA, MOA, SV-OOA, LV-OOA) factors UMR PMFAMSsolutions for the LHVP site are presented here.
Figure SI-1.2 shows good agreement between the PMFAMSand PMFAMS-PTRMSsolutions for the two primary
components HOA and COA and for LV-OOA, identified on the basis of their OA mass spectra (Fig. 5), diurnal cycles (re-flecting the boundary layer evolution and the peak emission hours, Fig. SI-2.2) and correlation with external data (Fig. 6). MOA, previously identified by Crippa et al. (2013b) due to its high correlation with MSA (methanesulfonic acid) and the predominance of sulfur containing fragments in its high resolution MS, is less well separated in PMFAMS-PTRMS
without the high resolution information, as shown by the reduced correlation between MOAAMS-PTRMS and MSA
(Fig. 6). Presumably this separation could be improved if high-resolution AMS data was available for incorporation into PMFAMS-PTRMS.
A local semi-volatile OOA (SV-OOA) was previously identified by the PMF-AMS analysis (Crippa et al., 2013b). However, this factor appeared to be the product of two different processes: a temperature-driven partitioning and a production during peak photochemistry. By adding the gas phase species into the PMFAMS-PTRMS analysis, these
pro-cesses were decoupled, yielding two OOA factors: SV-OOAday and SV-OOAnight. On average, SV-OOAday mass
builds steadily during the day, despite the development of the boundary layer, and significantly correlates with ozone and methacrolein + methyl vinyl ketone (m/z 71), short-lived early generation products of isoprene oxidation. This factor can be interpreted as stemming from the production of short-lived secondary organic compounds during peak photochem-istry. By contrast, SV-OOAnightcontribution is enhanced
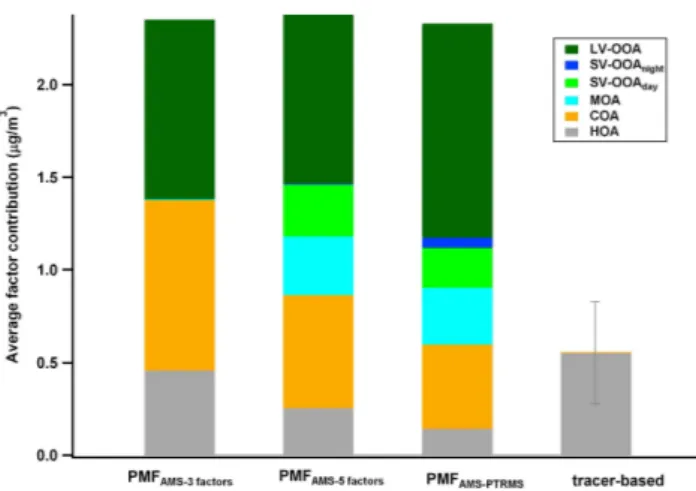
Fig. 7.Comparison of several source apportionment technique re-sults in estimating OA sources during summertime. Note that the tracer-based approach was attempted only for HOA.
of relative humidity. This suggests that, similar to nitrate, this factor may be related to the partitioning of semi-volatile SOA into the particle phase.
Figure 7 presents the comparison of the different source apportionment results obtained by PMFAMS-PTRMS (six
sources, present study), UMR PMFAMS(three factors,
Freu-tel et al., 2013) and high resolution PMFAMSsuggested for
the SIRTA site (five factors, Crippa et al., 2013b). For HOA, a marker-based approach is also presented using BC as a specific tracer in absence of other combustion sources (see method 4 presented in Sect. 2.3). The three-factor solution shows higher contributions for COA, HOA and LV-OOA compared to the other cases, as they encompass the contri-butions of the other oxygenated components. When compar-ing the high resolution PMFAMS and the PMFAMS-PTRMS
for the primary sources,∼25 % and 47 % difference can be observed (COA and HOA, respectively). Better agreement between the two techniques is obtained for the secondary components: LV-OOA, MOA, SV-OOA represent 0.92–1.16, 0.31–0.32 and 0.22–0.28 µg m−3, respectively (the latter con-sidering the sum of SV-OOAday and SV-OOAnight for the
PMFAMS-PTRMS).
4 Discussion and conclusions
Positive matrix factorization of aerosol mass spectra is a use-ful tool for identification of the contribution of both primary and secondary organic components (Zhang et al., 2011). However, for the secondary fraction, AMS-only PMF anal-ysis typically reports OA only in terms of SV-OOA and LV-OOA fractions, which are distinguished mainly by volatil-ity and degree of oxygenation but are difficult to further interpret. In this study a detailed investigation of organic aerosol sources was performed using positive matrix factor-ization applied to the combined AMS-PTRMS dataset
dur-ing summertime and wintertime in Paris. This technique, im-plemented and tested within a new toolkit (Canonaco et al., 2013), was shown to be a useful and nonconventional ap-proach within source apportionment methods. This apap-proach was based on the treatment of data measured by several in-struments and a weighting procedure in order to assure an equal model description of the observation over all instru-ments (in our case two).
However, a combined gas-particle phase source apportion-ment is a critical technique since it involves species with different lifetimes and several dynamic processes. This ap-proach is suitable for a clearer identification of primary sources, where particulate and gaseous pollutants are co-emitted. On the other hand, secondary gas and particle phase species form and decay at different timescales; hence their covariance does not allow discrimination between different secondary sources, but instead may be used to infer the for-mation timescales and lifetimes of OOA species. A precur-sor concentration can be low because there is little emission of it or because it has high reactivity. In the first case the condensed species would be low, while in the second case the condensed species would be high. Such methodology has been successfully used in several works (Slowik et al., 2010; El Haddad et al., 2013), which have given valuable insights into the formation and aging processes of OOA.
Finally, a cleaner separation of primary sources by using a combined gas-particle phase source apportionment also al-lows a better separation of secondary sources (as demon-strated in our work for the winter case where the SV-OOA component is completely separated from the BBOA one dif-ferently from the PMFAMS).
In our study, this technique provided insights on the sec-ondary organic aerosol components, compared with previous studies performed on the same dataset. In fact, the combina-tion of contemporary particle and gas phase measurements emitted by the same sources allowed a clearer discrimina-tion of both primary and secondary OA, the identificadiscrimina-tion of their natural or anthropogenic/continental origin and gaseous tracers. Specifically, SOA constituted more than 50 % of the OA mass in the Paris area and was classified in terms of continental, photochemistry-driven, volatility/nighttime-driven and marine components (though the continental vs. marine split is also possible through high-resolution analysis of AMS-only mass spectra).
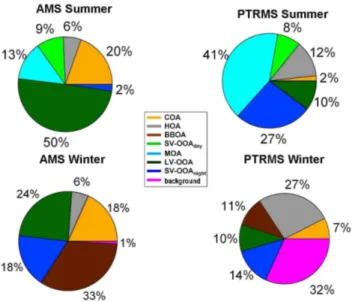
Fig. 8. Average AMS and PTR-MS source contributions for the summer and winter campaigns. The AMS relative contributions re-fer to the total organic aerosol mass, while the PTR-MS contribu-tions refer to the total measured gas phase.
SOA constituted the major fraction of OA for both sea-sons (Freutel et al., 2013; Crippa et al., 2013a) and it was mainly formed from continental emissions oxidation and as-sociated with the occurrence of aged air masses (especially during wintertime), contributing in winter 24 % and in sum-mer 50 % to the total OA mass.
Continental SOA was previously classified by PMFAMS
according to degree of oxygenation and volatility as local semi-volatile OOA (SV-OOA) and regional aged OOA (LV-OOA), but without source-specific information on the pre-cursors of these fractions. Beekmann et al. (2013) confirmed the regional behavior of OA sources, but did not relate the regional aged OA to specific time-of-day related processes. This is the new feature of the analysis in this paper. Another regional SOA factor derived from marine air masses could be observed only during summertime due to particular air mass regimes, contributing 13 % to the total OA mass, coherently with Crippa et al. (2013b).
With our work, we demonstrated the possibility to separate the SV-OOA source into a daytime and nighttime fraction by joining the gas and particle phase information provided by the PTR-MS and AMS data. A secondary nighttime compo-nent correlating with nitrate was separated, representing only 2 % of total OA during summer and 18 % in winter.
A smaller fraction of SOA was indeed produced locally, both during daytime (9 %) and nighttime (2 %) in summer. Daytime SOA was mainly produced by photochemistry, as confirmed by the correlation with isoprene, MVK, monoter-penes, temperature and solar radiation. Concerning the night-time SOA, it was mainly associated with lower temperatures and it most probably implied nighttime chemistry
involv-ing monoterpenes and nitrates, etc. Finally, a cleaner SV-OOA factor was also separated during the winter measure-ments compared with the PMFAMSsolution where an
oxy-genated factor containing wood burning features was identi-fied (OOA2-BBOA).
As already mentioned,14C results showed that the major fraction of secondary OA had non-fossil origin during sum-mertime (80 %) and wintertime (90 %) in Paris (Beekmann et al., 2013). Within the uncertainties associated with 14C and other source apportionment methods, our summer results seem to be coherent with the14C findings due to the identi-fication of a photochemistry driven and marine SOA sources in addition to a continental fraction, which might also be par-tially related to non-fossil origin.
Finally, concerning the winter solution, the presence of benzene and PAN in our LV-OOA factor suggests that this secondary fraction of OA could come from or form from biomass smoke in aged air masses, or that aged continen-tal air masses influenced by anthropogenic emissions from traffic and biomass burning impacted the site, bringing ben-zene and PANs (from traffic) and LV-OOA (biomass burning SOA), coherently with14C data.
Supplementary material related to this article is
available online at: http://www.atmos-chem-phys.net/13/ 8411/2013/acp-13-8411-2013-supplement.pdf.
Acknowledgements. This research, which was conducted in the context of the MEGAPOLI project, is mainly financially supported by the European Community’s Framework Program FP/2007-2011 under grant agreement no. 212520, as well as the Swiss National Science Foundation and the French ANR project MEGAPOLI – PARIS under the grant agreement ANR-09-BLAN-0356. P. F. De-Carlo is grateful for postdoctoral fellowship support from a NSF International Postdoctoral Fellowship (0701013).
Edited by: A. Baklanov
References
Adam, T., Mitschke, S., Streibel, T., Baker, R. R., and Zimmer-mann, R.: Quantitative puff-by-puff-resolved characterization of selected toxic compounds in cigarette mainstream smoke, Chem. Res. Toxicol., 19, 511–520, 2006.
Akagi, S. K., Yokelson, R. J., Wiedinmyer, C., Alvarado, M. J., Reid, J. S., Karl, T., Crounse, J. D., and Wennberg, P. O.: Emis-sion factors for open and domestic biomass burning for use in atmospheric models, Atmos. Chem. Phys., 11, 4039–4072, doi:10.5194/acp-11-4039-2011, 2011.
Allan, J. D., Delia, A. E., Coe, H., Bower, K. N., Alfarra, M. R., Jimenez, J. L., Middlebrook, A. M., Drewnick, F., Onasch, T. B., Canagaratna, M. R., Jayne, J. T., and Worsnop, D. R.: A generalised method for the extraction of chemically resolved mass spectra from Aerodyne aerosol mass spectrometer data, J. Aerosol Sci., 35, 909–922, 2004.
Beekmann, M., Prevot, A. S. H., Drewnick, F., Sciare, J., Pan-dis, S. N., Denier van der Gon, H. A. C., Crippa, M., Freutel, F., Poulain, L., Ghersi, V., Rodriguez, E., Beirle, S., Zotter, P., von der Weiden-Reinm¨uller, S.-L., Bressi, M., Fountoukis, C., Petetin, H., Szidat, S., Schneider, J., Rosso, A., El Haddad, I., Megaritis, A., Zhang, Q. J., Slowik, J. G., Moukhtar, S., Kolmo-nen, P., Stohl, A., Eckhardt, S., Borbon, A., Gros, V., Marchand, N., Jaffrezo, J. L., Schwarzenboeck, A., Colomb, A., Wieden-sohler, A., Borrmann, S., Lawrence, M., Baklanov, A., and Bal-tensperger, U.: Regional emissions control fine particulate matter levels in the Paris Megacity, P. Natl. Acad. Sci., in preparation, 2013.
Bon, D. M., Ulbrich, I. M., de Gouw, J. A., Warneke, C., Kuster, W. C., Alexander, M. L., Baker, A., Beyersdorf, A. J., Blake, D., Fall, R., Jimenez, J. L., Herndon, S. C., Huey, L. G., Knighton, W. B., Ortega, J., Springston, S., and Vargas, O.: Measurements of volatile organic compounds at a suburban ground site (T1) in Mexico City during the MILAGRO 2006 campaign: mea-surement comparison, emission ratios, and source attribution, Atmos. Chem. Phys., 11, 2399–2421, doi:10.5194/acp-11-2399-2011, 2011.
Canonaco, F., Crippa, M., Slowik, J. G., Baltensperger, U., and Pr´evˆot, A. S. H.: SoFi, an Igor based interface for the efficient use of the generalized multilinear engine (ME-2) for source ap-portionment: application to aerosol mass spectrometer data, At-mos. Meas. Tech. Discuss., 6, 6409–6443, doi:10.5194/amtd-6-6409-2013, 2013.
Chirico, R., DeCarlo, P. F., Heringa, M. F., Tritscher, T., Richter, R., Pr´evˆot, A. S. H., Dommen, J., Weingartner, E., Wehrle, G., Gysel, M., Laborde, M., and Baltensperger, U.: Impact of af-tertreatment devices on primary emissions and secondary or-ganic aerosol formation potential from in-use diesel vehicles: re-sults from smog chamber experiments, Atmos. Chem. Phys., 10, 11545–11563, doi:10.5194/acp-10-11545-2010, 2010.
Christian, T. J., Kleiss, B., Yokelson, R. J., Holzinger, R., Crutzen, P. J., Hao, W. M., Saharjo, B. H., and Ward, D. E.: Comprehen-sive laboratory measurements of biomass-burning emissions: 1. Emissions from Indonesian, African, and other fuels, J. Geophys. Res.-Atmos., 108, 4719, doi:10.1029/2003JD003704, 2003. Crippa, M., DeCarlo, P. F., Slowik, J. G., Mohr, C., Heringa, M.
F., Chirico, R., Poulain, L., Freutel, F., Sciare, J., Cozic, J., Di Marco, C. F., Elsasser, M., Nicolas, J. B., Marchand, N., Abidi, E., Wiedensohler, A., Drewnick, F., Schneider, J., Borrmann, S., Nemitz, E., Zimmermann, R., Jaffrezo, J.-L., Pr´evˆot, A. S. H., and Baltensperger, U.: Wintertime aerosol chemical compo-sition and source apportionment of the organic fraction in the metropolitan area of Paris, Atmos. Chem. Phys., 13, 961–981, doi:10.5194/acp-13-961-2013, 2013a.
Crippa, M., El Haddad, I., Slowik, J. G., DeCarlo, P. F., Mohr, C., Heringa, M., Chirico, R., Marchand, N., Sciare, J., Bal-tensperger, U., and Pr´evˆot, A. S. H.: Identification of marine and continental aerosol sources in Paris using high resolution aerosol mass spectrometry, J. Geophys. Res., 118, 1950–1963,
doi:10.1002/jgrd.50151, 2013b.
Crounse, J. D., DeCarlo, P. F., Blake, D. R., Emmons, L. K., Cam-pos, T. L., Apel, E. C., Clarke, A. D., Weinheimer, A. J., Mc-Cabe, D. C., Yokelson, R. J., Jimenez, J. L., and Wennberg, P. O.: Biomass burning and urban air pollution over the Cen-tral Mexican Plateau, Atmos. Chem. Phys., 9, 4929–4944, doi:10.5194/acp-9-4929-2009, 2009.
de Gouw, J. and Warneke, C.: Measurements of volatile organic compounds in the earth’s atmosphere using proton-transfer-reaction mass spectrometry, Mass Spectrom. Rev., 26, 223–257, 2007.
de Gouw, J. A., Goldan, P. D., Warneke, C., Kuster, W. C., Roberts, J. M., Marchewka, M., Bertman, S. B., Pszenny, A. A. P., and Keene, W. C.: Validation of proton transfer reaction-mass spec-trometry (PTR-MS) measurements of gas-phase organic com-pounds in the atmosphere during the New England Air Quality Study (NEAQS) in 2002, J. Geophys. Res.-Atmos., 108, 4682, doi:10.1029/2003JD003863, 2003.
DeCarlo, P. F., Kimmel, J. R., Trimborn, A., Northway, M. J., Jayne, J. T., Aiken, A. C., Gonin, M., Fuhrer, K., Horvath, T., Docherty, K. S., Worsnop, D. R., and Jimenez, J. L.: Field-deployable, high-resolution, time-of-flight aerosol mass spectrometer, Anal. Chem., 78, 8281–8289, 2006.
Donahue, N. M., Robinson, A. L., Stanier, C. O., and Pandis, S. N.: Coupled partitioning, dilution, and chemical aging of semivolatile organics, Environ. Sci. Technol., 40, 2635–2643, 2006.
Donahue, N. M., Epstein, S. A., Pandis, S. N., and Robinson, A. L.: A two-dimensional volatility basis set: 1. organic-aerosol mixing thermodynamics, Atmos. Chem. Phys., 11, 3303—3318, doi:10.5194/acp-11-3303-2011, 2011.
Donahue, N. M., Henry, K. M., Mentel, T. F., Kiendler-Scharr, A., Spindler, C., Bohn, B., Brauers, T., Dorn, H. P., Fuchs, H., Till-mann, R., Wahner, A., Saathoff, H., NauTill-mann, K. H., Mohler, O., Leisner, T., Muller, L., Reinnig, M. C., Hoffmann, T., Salo, K., Hallquist, M., Frosch, M., Bilde, M., Tritscher, T., Barmet, P., Praplan, A. P., DeCarlo, P. F., Dommen, J., Prevot, A. S. H., and Baltensperger, U.: Aging of biogenic secondary organic aerosol via gas-phase OH radical reactions, Proc. Natl. Acad. Sci. USA, 109, 13503–13508, 2012.
El Haddad, I., D’Anna, B., Temime-Roussel, B., Nicolas, M., Bo-reave, A., Favez, O., Voisin, D., Sciare, J., George, C., Jaffrezo, J.-L., Wortham, H., and Marchand, N.: Towards a better under-standing of the origins, chemical composition and aging of oxy-genated organic aerosols: case study of a Mediterranean industri-alized environment, Marseille, Atmos. Chem. Phys., 13, 7875– 7894, doi:10.5194/acp-13-7875-2013, 2013.
Elsasser, M., Crippa, M., Orasche, J., DeCarlo, P. F., Oster, M., Pitz, M., Cyrys, J., Gustafson, T. L., Pettersson, J. B. C., Schnelle-Kreis, J., Pr´evˆot, A. S. H., and Zimmermann, R.: Organic molec-ular markers and signature from wood combustion particles in winter ambient aerosols: aerosol mass spectrometer (AMS) and high time-resolved GC-MS measurements in Augsburg, Ger-many, Atmos. Chem. Phys., 12, 6113–6128, doi:10.5194/acp-12-6113-2012, 2012.
aerosols during wintertime in an Alpine city (Grenoble, France), Atmos. Chem. Phys., 10, 5295–5314, doi:10.5194/acp-10-5295-2010, 2010.
Freutel, F., Schneider, J., Drewnick, F., von der Weiden-Reinm¨uller, S.-L., Crippa, M., Pr´evˆot, A. S. H., Baltensperger, U., Poulain, L., Wiedensohler, A., Sciare, J., Sarda-Est`eve, R., Burkhart, J. F., Eckhardt, S., Stohl, A., Gros, V., Colomb, A., Michoud, V., Doussin, J. F., Borbon, A., Haeffelin, M., Morille, Y., Beekmann, M., and Borrmann, S.: Aerosol particle measurements at three stationary sites in the megacity of Paris during summer 2009: meteorology and air mass origin dominate aerosol particle com-position and size distribution, Atmos. Chem. Phys., 13, 933–959, doi:10.5194/acp-13-933-2013, 2013.
Grieshop, A. P., Logue, J. M., Donahue, N. M., and Robinson, A. L.: Laboratory investigation of photochemical oxidation of or-ganic aerosol from wood fires 1: measurement and simulation of organic aerosol evolution, Atmos. Chem. Phys., 9, 1263–1277, doi:10.5194/acp-9-1263-2009, 2009.
Hallquist, M., Wenger, J. C., Baltensperger, U., Rudich, Y., Simp-son, D., Claeys, M., Dommen, J., Donahue, N. M., George, C., Goldstein, A. H., Hamilton, J. F., Herrmann, H., Hoff-mann, T., Iinuma, Y., Jang, M., Jenkin, M. E., Jimenez, J. L., Kiendler-Scharr, A., Maenhaut, W., McFiggans, G., Mentel, Th. F., Monod, A., Pr´evˆot, A. S. H., Seinfeld, J. H., Surratt, J. D., Szmigielski, R., and Wildt, J.: The formation, properties and im-pact of secondary organic aerosol: current and emerging issues, Atmos. Chem. Phys., 9, 5155–5236, doi:10.5194/acp-9-5155-2009, 2009.
He, L.-Y., Lin, Y., Huang, X.-F., Guo, S., Xue, L., Su, Q., Hu, M., Luan, S.-J., and Zhang, Y.-H.: Characterization of high-resolution aerosol mass spectra of primary organic aerosol emis-sions from Chinese cooking and biomass burning, Atmos. Chem. Phys., 10, 11535–11543, doi:10.5194/acp-10-11535-2010, 2010. Healy, R. M., Sciare, J., Poulain, L., Kamili, K., Merkel, M., M¨uller, T., Wiedensohler, A., Eckhardt, S., Stohl, A., Sarda-Est`eve, R., McGillicuddy, E., O’Connor, I. P., Sodeau, J. R., and Wenger, J. C.: Sources and mixing state of size-resolved elemental carbon particles in a European megacity: Paris, Atmos. Chem. Phys., 12, 1681–1700, doi:10.5194/acp-12-1681-2012, 2012.
Heringa, M. F., DeCarlo, P. F., Chirico, R., Tritscher, T., Dommen, J., Weingartner, E., Richter, R., Wehrle, G., Pr´evˆot, A. S. H., and Baltensperger, U.: Investigations of primary and secondary particulate matter of different wood combustion appliances with a high-resolution time-of-flight aerosol mass spectrometer, At-mos. Chem. Phys., 11, 5945–5957, doi:10.5194/acp-11-5945-2011, 2011.
Heringa, M. F., DeCarlo, P. F., Chirico, R., Tritscher, T., Clairotte, M., Mohr, C., Crippa, M., Slowik, J. G., Pfaffenberger, L., Dom-men, J., Weingartner, E., Pr´evˆot, A. S. H., and Baltensperger, U.: A new method to discriminate secondary organic aerosols from different sources using high-resolution aerosol mass spec-tra, Atmos. Chem. Phys., 12, 2189–2203, doi:10.5194/acp-12-2189-2012, 2012.
Holzinger, R., Warneke, C., Hansel, A., Jordan, A., Lindinger, W., Scharffe, D. H., Schade, G., and Crutzen, P. J.: Biomass burn-ing as a source of formaldehyde, acetaldehyde, methanol, ace-tone, acetonitrile, and hydrogen cyanide, Geophys. Res. Lett., 26, 1161–1164, 1999.
Holzinger, R., Williams, J., Salisbury, G., Kl¨upfel, T., de Reus, M., Traub, M., Crutzen, P. J., and Lelieveld, J.: Oxygenated compounds in aged biomass burning plumes over the East-ern Mediterranean: evidence for strong secondary production of methanol and acetone, Atmos. Chem. Phys., 5, 39–46, doi:10.5194/acp-5-39-2005, 2005.
Jimenez, J. L., Canagaratna, M. R., Donahue, N. M., Prevot, A. S. H., Zhang, Q., Kroll, J. H., DeCarlo, P. F., Allan, J. D., Coe, H., Ng, N. L., Aiken, A. C., Docherty, K. S., Ulbrich, I. M., Grieshop, A. P., Robinson, A. L., Duplissy, J., Smith, J. D., Wil-son, K. R., Lanz, V. A., Hueglin, C., Sun, Y. L., Tian, J., Laak-sonen, A., Raatikainen, T., Rautiainen, J., Vaattovaara, P., Ehn, M., Kulmala, M., Tomlinson, J. M., Collins, D. R., Cubison, M. J., Dunlea, E. J., Huffman, J. A., Onasch, T. B., Alfarra, M. R., Williams, P. I., Bower, K., Kondo, Y., Schneider, J., Drewnick, F., Borrmann, S., Weimer, S., Demerjian, K., Salcedo, D., Cot-trell, L., Griffin, R., Takami, A., Miyoshi, T., Hatakeyama, S., Shimono, A., Sun, J. Y., Zhang, Y. M., Dzepina, K., Kimmel, J. R., Sueper, D., Jayne, J. T., Herndon, S. C., Trimborn, A. M., Williams, L. R., Wood, E. C., Middlebrook, A. M., Kolb, C. E., Baltensperger, U., and Worsnop, D. R.: Evolution of organic aerosols in the atmosphere, Science, 326, 1525–1529, 2009. Jordan, C., Fitz, E., Hagan, T., Sive, B., Frinak, E., Haase, K.,
Cottrell, L., Buckley, S., and Talbot, R.: Long-term study of VOCs measured with PTR-MS at a rural site in New Hamp-shire with urban influences, Atmos. Chem. Phys., 9, 4677–4697, doi:10.5194/acp-9-4677-2009, 2009.
Karl, T. G., Christian, T. J., Yokelson, R. J., Artaxo, P., Hao, W. M., and Guenther, A.: The Tropical Forest and Fire Emis-sions Experiment: method evaluation of volatile organic com-pound emissions measured by PTR-MS, FTIR, and GC from tropical biomass burning, Atmos. Chem. Phys., 7, 5883–5897, doi:10.5194/acp-7-5883-2007, 2007.
Kroll, J. H., Smith, J. D., Che, D. L., Kessler, S. H., Worsnop, D. R., and Wilson, K. R.: Measurement of fragmentation and function-alization pathways in the heterogeneous oxidation of oxidized or-ganic aerosol, Phys. Chem. Chem. Phys., 11, 8005–8014, 2009. Lanz, V. A., Alfarra, M. R., Baltensperger, U., Buchmann, B.,
Hueglin, C., and Pr´evˆot, A. S. H.: Source apportionment of sub-micron organic aerosols at an urban site by factor analytical mod-elling of aerosol mass spectra, Atmos. Chem. Phys., 7, 1503– 1522, doi:10.5194/acp-7-1503-2007, 2007.
Lanz, V. A., Pr´evˆot, A. S. H., Alfarra, M. R., Weimer, S., Mohr, C., DeCarlo, P. F., Gianini, M. F. D., Hueglin, C., Schneider, J., Favez, O., D’Anna, B., George, C., and Baltensperger, U.: Char-acterization of aerosol chemical composition with aerosol mass spectrometry in Central Europe: an overview, Atmos. Chem. Phys., 10, 10453–10471, doi:10.5194/acp-10-10453-2010, 2010. Lindinger, W., Hansel, A., and Jordan, A.: Proton-transfer-reaction mass spectrometry (PTR-MS): on-line monitoring of volatile or-ganic compounds at pptv levels, Chem. Soc. Rev., 27, 347–354, 1998.