ABDUL FATAH ABBASI*, MUJEEBUDDIN MEMON**, AND DUR MUHAMMAD PATHAN* RECEIVED ON 14.02.2012 ACCEPTED ON 18.09.2012
ABSTRACT
This paper provides the finite-difference solutions for closed contra-rotating discs flows at different disc speed ratios for a fixed value of rotational Reynolds number of order five. The flow structure reveals that when two discs rotate in opposite directions, the fluid mass outside the boundary layers is divided between two regions, which give rise to the formation of two-cell flow structure. In order to assess the different level of closures, two turbulence models low Reynolds number k-εεεεε model and low Reynolds number second moment closure have been employed to predict the essential features of the closed contra-rotating disc system. The most significant differences between the predictions of the two turbulence models occur at the peak of slower disc boundary layer, because flow is more complex and turbulent on this side. The comparison of predicted velocity profiles of two turbulence models show that the low Reynolds number second moment closure produce a better agreement with measurements, particularly along the boundary layers and in the central core region.
Key Words: Contra-Rotating Disc Flows, Low Reynolds Number Second Moment Closure.
*Assistant Professor, and **Professor,
Department of Mechanical Engineering, Mehran University of Engineering & Technology, Jamshoro.
1
INTRODUCTION
difference isothermal predictions of the sealed contra-rotating disc system as shown in Fig. 1, where two discs of the outer radius b are separated by an axial distance s and rotating with angular velocity Ω in opposite directions.
In an isothermal sealed rotating cavity flow, when the two discs rotate with different speeds then the corresponding flow structures are influenced by the rotation ratio of the discs and by non-dimensional parameters such as rotational Reynolds number (Reθ) and gap ratio (G). This rotation ratio is defined as:
R L Ω Ω = Γ
finite-Whereas ΩL is speed of left side disc, ΩR is speed of right side disc and Γ is disc speed ratio, thus Γ=0 for the rotor-stator, while Γ > 0 for corotation and Γ < 0 for contra-rotation.
In the present study, the effects of varying disc speed ratio in the range 0 > Γ > -1is considered through fixing the rotational speed of the right-hand disc and the shroud, based on the value of rotational Reynolds number Reθ=1x10⁵ and gap ratio, G=0.12.
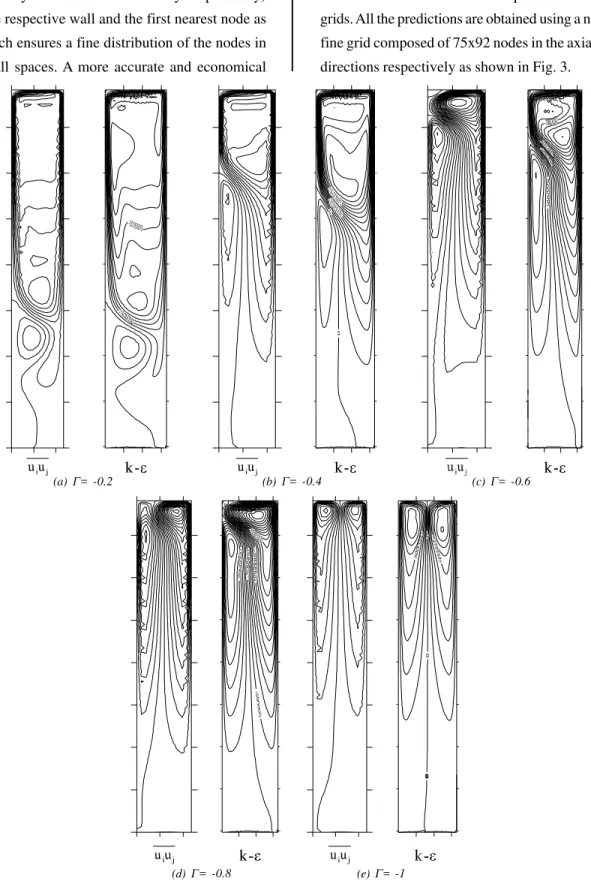
The main characteristics of this sealed contra-rotating disc flow are shown through a series of flow structures in Fig. 2 which correspond to the values of disc speed ratio i.e. =02, Γ-0.4, -0.6 and -1. These flow structures show the two divided regions of flow, where core regions are developed between the boundary layers at the mid-axial plane and the discs. For lower values of the disc speed ratio (Γ > -0.4), the fluid flow in the cavity is dominated by the right-hand disc, which rotates faster than the left-hand disc. Thus, the relatively stronger centrifugal effects on the side of the right-hand disc give rise to a radially outwards flow along this disc. In
contrast, a weaker radial outflow occurs near the axis of rotation on the side of the left-hand disc. Radially outwards flow along the right-hand disc moves axially across the shroud and radially inwards along the left-hand disc. A position, where this radially inwards flow cancels with weaker radially outwards flow along the slower-rotating disc is called a stagnation point. This point moves radially outwards as the speed of the slower rotating disc or the rotation ratio of the discs increases. This fact has been supported in the higher speed ratio cases (Γ < -0.8), where a radially outwards flow along the slower-rotating disc is stronger than the previous cases, which cancels out the radially inwards flow near the outer radius of the cavity. These trends are found to be in agreement with previous studies of Soong, et. al. [6], Wiktwski, et. al. [7] and Poncet, et. al. [8].
2.
COMPUTATIONAL PROCEDURE
The computational procedure uses a finite volume technique and adopts the line-by-line method based on the TDMA (Tri-Diagonal Matrix Algorithm) to solve the discretised transport equations. All the variables are solved at the main grid nodes, except the axial and radial momentum equations, which are solved by using the staggered grid arrangement. This numerical method also adopts the SIMPLEC algorithm of Van, et. al. [9] to update the pressure field and correct the velocity values to satisfy the mass continuity.
Following the works of Morse, [10-11], Memon, [12], Memon, et. al. [13-16] and Abbasi, et. al. [17], the transport equations are discretised using the control volume formulation and a higher order linear upwind-differencing scheme of Castro, et. al. [18] is used to interpolate the variables from the main grid nodes onto the control volume faces. Near-wall (discs and shroud) refinement has been set to provide the non-dimensional wall distance (i.e. y+=yU
τ/ν, where y, Uτ and ν are generalised wall distance,
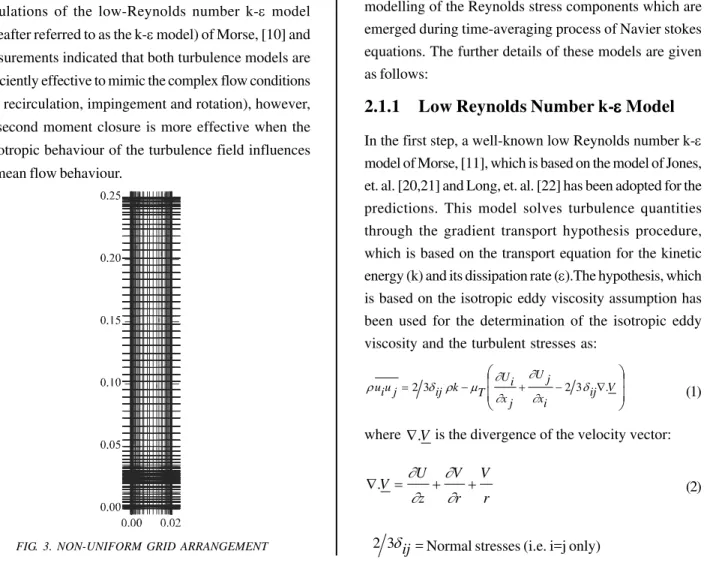
friction velocity and kinematic viscosity respectively) between the respective wall and the first nearest node as y+<0.5, which ensures a fine distribution of the nodes in the near-wall spaces. A more accurate and economical
solution can be obtained with a practice of non-uniform grids. All the predictions are obtained using a non-uniform fine grid composed of 75x92 nodes in the axial and radial directions respectively as shown in Fig. 3.
FIG. 2. COMPUTED FLOW STRUCTURES OF TWO MODELS FOR VARIOUS DISC SPEED RATIOS,
(a) Γ= -0.2 (b) Γ= -0.4 (c) Γ= -0.6
2.1
Turbulence Models
Memon, [12,16] developed a low Reynolds number second moment closure (hereafter referred to as the uiuj model) to compute the turbulence process more realistically in rotating disc flows. Particular emphasis has been given to the near-wall modelling of the pressure-strain and the viscous dissipation processes, as these are important in predicting the correct anisotropic behaviour of the Reynolds stress components. Predictions of the flat-plate boundary layer flow [16] including the turbulent shear stress, the friction coefficients and the near-wall stress ratios ⎜⎝⎛ui2 k⎟⎠⎞, were found to be in excellent agreement
with measurements. As a next step, the model has been applied to the computations of rotor-stator [12-13] and rotating cavity flows [15]. Comparison of predictions with calculations of the low-Reynolds number k-ε model (hereafter referred to as the k-ε model) of Morse, [10] and measurements indicated that both turbulence models are sufficiently effective to mimic the complex flow conditions (e.g. recirculation, impingement and rotation), however, the second moment closure is more effective when the anisotropic behaviour of the turbulence field influences the mean flow behaviour.
Thus, in order to further extend the validity of the present code and to assess the different levels of the closure, predictions obtained with two low Reynolds number models, the k-ε model of Morse, [10] and the second moment closure of Memon, [12]. Predictions of both the models are compared with the available data of Kilic, et. al. [19] for the sealed contra-rotating.
Regarding the overall CPU time for typical solutions of two turbulence models, it was found that the solution obtained by low Reynolds number second moment closure cost 35% higher CPU time than the same obtained by the low Reynolds number k-ε model. The memory space required for the uiuj model and the k-ε model for these
solutions was 245 and 171 KB respectively.
These models can be categorised according to the modelling of the Reynolds stress components which are emerged during time-averaging process of Navier stokes equations. The further details of these models are given as follows:
2.1.1
Low Reynolds Number k-
εεεεε
Model
In the first step, a well-known low Reynolds number k-ε model of Morse, [11], which is based on the model of Jones, et. al. [20,21] and Long, et. al. [22] has been adopted for the predictions. This model solves turbulence quantities through the gradient transport hypothesis procedure, which is based on the transport equation for the kinetic energy (k) and its dissipation rate (ε).The hypothesis, which is based on the isotropic eddy viscosity assumption has been used for the determination of the isotropic eddy viscosity and the turbulent stresses as:
⎟ ⎟ ⎠ ⎞ ⎜ ⎜ ⎝ ⎛ ∇ − + −
= ij V
i x j U j x i U T k ij j u i
u 23 23δ .
∂ ∂ ∂ ∂ μ ρ δ ρ (1)
where ∇.V is the divergence of the velocity vector:
r V r V z U
V = + +
∇ ∂ ∂ ∂ ∂ . (2)
2 3δij= Normal stresses (i.e. i=j only)
2.1.2
Low Reynolds Number Second
Moment Closure
In the second step, the low Reynolds number second moment closure of Memon, [12,16], which is based on the suggestions of Lai, et. al. [23], has been adopted for predictions.
The exact equation governing the Reynolds stress tensor transport can be expressed in Cartesian tensor as:
(
)
(
)
k x j u k x i u 2 i x p j u j x p i u k x j U k u i u k x i U k u j u k u j u i u k x k x j u i u k x j u i u k U k x ∂ ∂ ∂ ∂ μ ∂ ∂ ∂ ∂ ∂ ∂ ∂ ∂ ρ ρ ∂ ∂ ∂ ∂ μ ∂ ∂ ρ ∂ ∂ − + − + − − + = ⎟ ⎟ ⎠ ⎞ ⎜ ⎜ ⎝ ⎛ ⎟ ⎟ ⎠ ⎞ ⎜ ⎜ ⎝ ⎛ ⎟ ⎟ ⎠ ⎞ ⎜ ⎜ ⎝ ⎛ (3)or symbolically as:
ij ij ij P T ij D ij D ij
C = ν + + +Π −ε (4)
Where the terms from left to the right can be read as convection, viscous diffusion, turbulent diffusion, and production by mean strain, redistribution and diffusion due to the pressure interactions and viscous dissipation of the Reynolds stresses respectively. For full detail of these terms, see references Memon, [12,16] and Lai, et. al. [23].
2.2
Boundary Conditions
To provide a well-posed specification for such complex flow problem, it is necessary to prescribe appropriate boundary conditions. Simulations commence from a quiescent initial state. In this particular case, there is no superimposed radial outflow and inflow, therefore, inlet and outlet boundary conditions are supposed to be zero. No-slip boundary conditions are assumed on solid walls. In general the boundary conditions for this case were set
as follows:
U=V=0 W=ΩLr at z=o
U=V=0 W=Ω
Rr at z=s U=V=0 W=ΩRr at r=b, z=s
In the above conditions, U, V and W are the mean velocities in axial, radial and tangential directions respectively, whereas, ΩL, ΩR, b, r, s and z are the rotational speeds of the left-hand and the right-hand discs outer radius, radial distance, disc spacing and axial distance respectively.
3.
DISCUSSION OF NUMERICAL
RESULTS
The computations are carried out for a range of speed ratio 0 > Γ > -1 at a fixed value of rotational Reynolds number, Reθ=1x10⁵. This lower value of rotational Reynolds number is opted due to the availability of relevant experimental data otherwise both turbulence models have been tested for higher values of rotational Reynolds numbers by Morse, [10] and Memon, [12]. Also, the geometric dimensions of the cavity used in the computations are the same as in the relevant experimental work of Kilic, et. al. [19].
3.1
Stagnation Point
The main characteristic of the sealed contra-rotating disc flow is the appearance of a stagnation point at the slower-rotating disc. Formation of this point was addressed through the presentation of flow structures in Fig. 2. The stream lines of inward-outward flow cancel each other on a stagnant point on slower disc and that moves radially outwards in accordance to the disc speed ratio.
increase in the absolute value of disc speed ratio. The stagnation point moves outward on slower disc according to disc speed ratio (Γ) as identified by Gan, et. al. [2]. For pure contra-rotation case (Γ= -1), the two-cell flow structure gradually turned into two lager cells of same magnitude and size, these cells are stagnant in the centre of cavity at mid-axial plane. The same trend of the flow structure was also noted in the numerical work of Poncet, et. al. [8] and Hill, et. al.[24,25]. In relevance to the predictions of velocity profiles, the predicted stagnation points of the two models are showing noticeable differences for the range of disc speed ratio -0.2 > Γ > -0.8, where the uiuj model predicts
higher radial locations of stagnation point than the k-ε model as shown in Fig. 4.
Though there is no availability of experimental data for the stagnation points, however, in order to reveal the general trends of appearance of stagnant points with the variation of disc speed ratio, those are presented in Fig. 4.
3.2
Computed Velocity Profiles
Predictions of the radial and tangential velocities for the case are compared with the relevant measurements at two radial locations r/b=0.6 and 0.85 in Fig. 5(a-b) respectively. Both the measurements and the computations show
satisfactorily the essential features of the contra-rotating disc system and fully support the two-cell flow structures as earlier presented in Fig. 1. It can be seen that the computations and measurements for radial velocity profiles show outward boundary layer on faster disc and inward boundary layer on slower disc, between these boundary layers recirculating core region has been developed, where radial velocity is almost zero. Both models overpredicted the radial velocity profiles near the slower disc in contrast to measurements which show the earlier inflow on this side. Computed tangential velocity profiles of both the models are found to be in good agreement with data except with overprediction in central core region at r/b=0.85. Due to lower value of rotation ratio i.e Γ= -0.2, the trends of velocity profiles reflect the rotor-stator behaviour as earlier presented in the studies of Memon, [11], Morse, [12], Abbasi, et. al. [17] and Launder, et. al. [26].
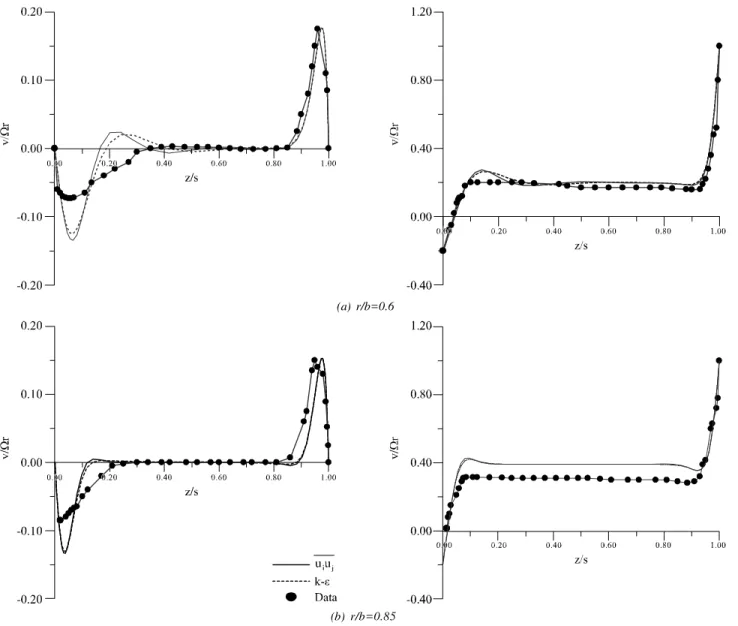
Fig. 6(a-b) shows the axial variation of radial and tangential velocity component for disc speed ratio Γ= -0.4. The
predicted velocity profiles at both radial locations show the sign of change or a double transition flow as reported by Kilic, et. al. [19]. The predictions of the uiuj model for
radial velocity profiles at radial locations r/b =0.6 show the radial out flow on both the discs and radial inflow in central region of the cavity where radial velocity is almost negative and this trend is found to be in closer agreement with measurements. In contrast predictions of the k-ε model show overprediction in central region and slower disc side. Similarly, the tangential velocity profiles predicted through the uiuj model show better agreement
with measurements in comparison to those predicted by the k-ε model.
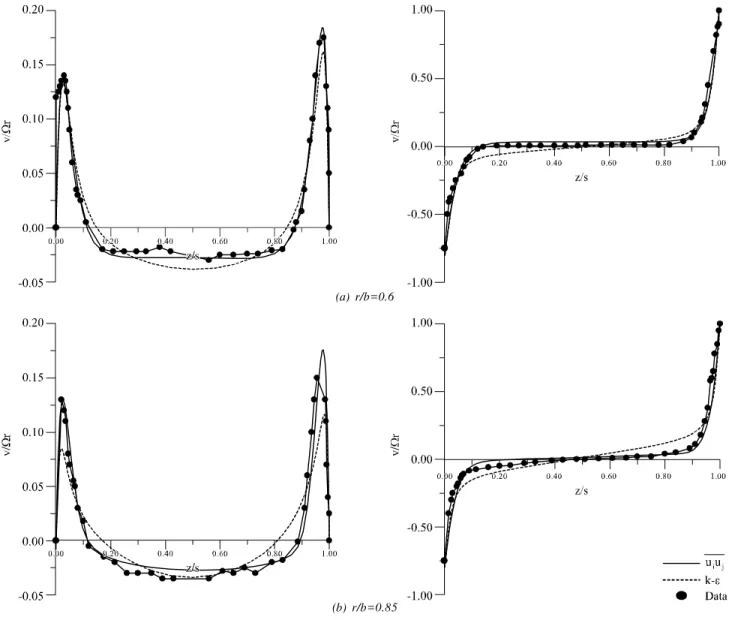
Further noticeable differences between the results of two models are evidenced in Fig. 7(a-b) for the higher value of disc speed ratio Γ= -0.6. For the predicted radial velocity profiles the Reynolds stress model shows radial out flow
on both the discs and inflow in central core region, this trend of flow confirms the double transition flow and form two cell structures in between two discs (Kilic, et. al. [3] and Dijkstra, et. al. [27]). The Reynolds stress model shows the closer agreement with the measurement in all flow regions.This suggests that as the flow become more complex, the uiuj model confirms its superiority over the
k-ε model. In particular, Fig. 8(b) shows that the k-ε model predicts an earlier transition from radial inflow to outflow i.e. at z/s=0.65, in comparison to the uiuj closure and the
measurements i.e. z/s=0.89.
In comparison to earlier presented cases, Fig. 8 reveals that the increased in the speed ratio has extended the thickness of the boundary layers on the slower rotating disc and subsequently a tendency towards the development of symmetrical boundary layers flow on the two discs. This is also evidenced by the reduction in the difference of the peak of radial velocity component on the two discs. Corresponding comparison of the tangential velocity profiles presented in Figs. 5-7 show that in the lower disc speed ratio cases, the higher portion of the fluid rotates in the same direction as the right hand disc.
(a) r/b=0.6
(b) r/b=0.85
FIG. 5. CASE-1 COMPARISON BETWEEN RADIAL AND TANGENTIAL VELOCITY PROFILES IN AXIAL DIRECTION FOR Reθ=1x10⁵,
However, this effect has been substantially reduced in the case of the higher speed ratio, where fluid is rotating almost symmetrically. Thus, the position where the direction of the rotation is reverses and moves towards the mid-axial position. Overall, Fig. 8(a-b) show that the same model-dependent behaviour still persists for disc speed ratio Γ= -0.8. However, it can be seen that the tangential velocity predictions of both models and measurements are very close to each other which is in agreement to their behaviour with relevant flow structures where two-cell flow formation was suppressed and consequently the scale of the complexity of the flow is reduced.
Fig. 9(a-b) show the performance of both models for pure contra-rotating case i.e. Γ= -1.0, where both discs are rotating at the same speed but in opposite direction. The predicted radial velocity profiles and measurements at both radial location r/b=0.6 and 0.85 show laminar boundary layers on both discs and between these boundary layers there is a core region where radial velocity components are almost negative which attributes the reverse and turbulent type of flow in the core region of the cavity. Computations and measurements show the same peak on the two discs and a fully developed core region, however, the k-ε model predicts earlier departure from the central
(a) r/b=0.7
(b) r/b=0.85
FIG. 6. CASE-2 COMPARISON BETWEEN RADIAL AND TANGENTIAL VELOCITY PROFILES IN AXIAL DIRECTION FOR Reθ=1x10⁵,
core region towards the right hand disc in comparison to the predictions of the uiuj model and measurements.
The overall comparison of both the models shows that the Second moment closure has the closer agreement with the measurements than that of the k-ε model. The significant differences are noted in near-wall region and in core region. In core region flow is more complex than other regions because transition takes place in this region. The low Reynolds number second moment closure is more effect than the k-ε model for such type of complex flows.
(a) r/b=0.6
(b) r/b=0.85
FIG. 7. CASE-3 COMPARISON BETWEEN RADIAL AND TANGENTIAL VELOCITY PROFILES IN AXIAL DIRECTION FOR Reθ=1x10⁵,
Γ= -0.6, G=0.12, AT RADIAL LOCATION
From the discussion, it is attributed that the second moment closure model is more capable to be used for complex and wall bounded shear flows.
3.3
Computed Moment Coefficients
Further appraisal of computational results of two models is carried out through the comparison of the predicted variation of moment coefficients ( 25
2
1 b
M m C
Ω =
ρ , where
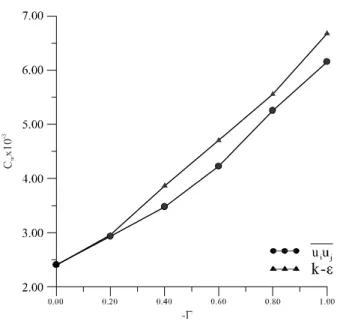
computed moment coefficients at slower and faster discs respectively. The general pattern of computed moment coefficient for contra-rotating disc depends on the disc speed ratio, it increases and decreases monotonically on variation of disc speed ratio (Γ). Positive value of moment coefficient (Cm) creates drag on rotating disc whereas negative value drives the disc as mention by Kilic, et. al. [3]. The same trend of variation in computed moment coefficient was noted in the work of Kilic, et. al. [19] and Morse, [11].
Table 1 and Fig. 10 show the comparison of computed moment coefficients by adopting two models for different disc speed ratios (Γ= -0.2, -0.4, -0.6, -0.8 and -1) and at fixed rotational Reynolds number. It can be seen that the magnitude of predicted moment coefficients (Cm1, Cm2) increases and decreases with respect to disc speed ratios (Γ). Predicted moment coefficients of both models for disc speed ratios Γ=0 and -0.2 show the same level of the agreement. As disc speed ratio changes from Γ= -0.4 to Γ= -0.8 to difference between two models is evident and the k-ε model over estimated than the uiuj model. For
(a) r/b=0.6
(b) r/b=0.85
FIG. 8. CASE-4 COMPARISON BETWEEN RADIAL AND TANGENTIAL VELOCITY PROFILES IN AXIAL DIRECTION FOR Reθ=1x10⁵,
disc speed ratio Γ= -1, the computed moment coefficient on right hand disc is slightly decreased, the reason for this relatively small deviation is not known.
The overall performance of both the models shows consistency with basic trend of variation in moment coefficient corresponding to disc speed ratio (Γ= -0.2, -0.4, -0.6, -0.8 and -1) as mentioned in the computational work of Kilic, et. al. [3]. Again, there is no availability of experimental data for the computed moment otherwise that would have more interesting level of comparison.
TABLE 1. COMPUTED MOMENT COEFFICIENT FOR Reθθθθθ=1x10⁵, -1 < ΓΓΓΓΓ < 0
Disc Speed Reynolds Stress Model k-ε Model
Ratio (Cmx10
-3) (C
mx10 -3)
(Γ) (LHS) Cm1 (RHS) Cm2 (LHS) Cm1 (RHS) Cm2
- 1 6.156 6.491 6.667 6.984
-0.8 5.252 6.637 5.555 7.157
-0.6 4.211 6.341 4.704 6.758
-0.4 3.724 5.925 3.865 6.182
-0.2 2.930 5.441 2.959 5.459
0 2.406 4.951 2.401 4.946
(a) r/b=0.6
(b) r/b=0.85
FIG. 9. CASE-5 COMPARISON BETWEEN RADIAL AND TANGENTIAL VELOCITY PROFILES IN AXIAL DIRECTION FOR Reθ=1x10⁵,
4.
CONCLUSIONS
Computations have been conducted for closed contra rotating disc systems by adopting two turbulent models. A series of disc speed ratios Γ= -0.2, -0.4, -0.6,
-0.8 and -1 was considered and the effects of these ratios on flow structures, stagnation points, velocity profiles and computed moment coefficient were investigated. The computations have shown that when two discs rotate in opposite directions, the fluid mass outside the boundary layers is divided between the two regions, which give rise to the formation of two-cell flow structure for contra-rotating disc system. Comparisons of the velocity profiles and the flow structures for a wide range of discs speed ratio suggested that a tendency of a flow symmetry on booth discs increases with increase in the absolute value of disc speed rotation ratio. Also with increase in the absolute value of this parameter, a stagnation point that appears on slower-rotating disc moves radially outwards. The values of computed moment coefficients increase monotonically according to the absolute value of disc speed rotation ratio.
The comparison of two levels of closure with the relevant experimental data indicated that both models are capable of predicting correctly the characteristics of this system. The significant differences between the predictions of two models occurred for a range of disc speed ratio -0.2 > Γ> -0.8 where transitional effects were dominant. Overall, the predictions were found to be in good agreement with measurements; however, the uiuj model produced a closer
agreement with data in comparison to the k-ε model.
5.
NOMENCLATURE
b outer radius of cavity
5 2 2
1 b
M m
C = ρΩ moment coefficient
G=s/b cavity gap ratio
k turbulent kinetic energy
M frictional moment
ν
θ 2
Re =Ωb rotational Reynolds number
r radial co-ordinate
r/b non-dimensional radial co-ordinate
ri inner disc radius
s axial gap between the discs
Sc clearance between the disc and shroud U,V,W mean velocity components in z, r, direction U+=U/U
τ dimensionless velocity
j u i
u Reynolds stress tensor
z axial co-ordinate
z/s non-dimensional axial co-ordinate ε dissipation rate of turbulent kinetic energy
θ circumferential co-ordinate
Γ rotation ratio of the discs and diffusivity
ν kinematic viscosity
μ dynamic viscosity
Φ generalised transport variable
ΩL and ΩR rotational speed of the left hand disc and right
hand disc
ρ density
ACKNOWLEDGEMENTS
This work acknowledges the support of HEC (Higher Education Commission), Pakistan for providing financial assistance to fulfil this task. Authors are also thankful to the MUET (Mehran University of Engineering & Technology) and Faculty members Department of Mechanical Engineering, MUET, Jamshoro, Pakistan, for their encouragement and moral support.
REFRENCES
[1] Gan, X., Kilic, M., and Owen, J.M., "Superposed Flow
Between Two Discs Contra-Rotating at Differential
Speeds", International Journal of Heat Fluid Flow,
Volume 15, pp. 438-446, 1994.
[2] Gan, X., Kilic, M., and Owen, J.M., "Flow Between
Contra-Rotating Discs", Journal of Turbomachinery,
Volume 119, pp. 298-305, 1995.
[3] Kilic, M., and Owen, J.M., "Computation of Flow
Between Two Discs Rotating at Different Speeds". Journal
of Turbomachinery, Volume 125, pp. 394-400, 2003.
[4] Kilic, M., Gan, X., and Owen, J.M., "Turbulence Flow
Between Two Discs Contra-Rotating at Different
Speeds", Journal of Turbomchinery, Volume 118,
pp. 408-413, 1996.
[5] Chen, X., Gan, X., and Owen, J.M., "Heat Transfer from
Air-Cooled Contrarotating Discs", Journal of
Turbomachinery, Volume 117, pp. 61-67, 1997.
[6] Soong, C.Y., Wu, C.C., Liu, T.P., and Liu, T.P., "Flow
Structure Between Two Co-Axial Discs Rotating
Independently", Experimental Thermal and Fluid
Science, Volume 27, pp. 295-313, 2003.
[7] Witkowski, L.M., Delbende, I., Walker, J.S., and Le,
Q.P., "Axisymmetric Stability of the Flow Between Two
Exactly Counter-Rotating Disks with Large Aspect
Ratio", Journal of Fluids Mechanics, Volume 546,
pp. 193-202, 2006.
[8] Poncet, S., Schiestel, R., and Monchaux, R., "Turbulenc
Modelling of the Von Karman Flow: Viscous and Inertial
Stirrings", International Journal of Heat and Fluid Flow,
Volume 29, pp. 62-71, 2008.
[09] Van Doormal, J.P., and Raithby, G.D., "Enhancement of
the SIMPLE Method for Predicting Incompressible
Fluid Flow", Numerical Heat Transfer, Volume 7,
pp. 147-163, 1984.
[10] Morse, A.P., "Application of a Low Reynolds Number
k-ε Turbulence Model to High-Speed Rotating
Cavity Flows", Journal Turbomachinery, Volume 113,
pp. 98-105, 1991
[11] Morse, A.P., "Assessment of Laminar-Turbulent
Transition in Closed Disc Geometries", Journal
Turbomachinery, Volume 113, pp. 131-138, 1991.
[12] Memon, M.D., "Numerical Modelling and Prediction of
Fluid Flow and Heat Transfer in Rotating Disc
Geometries", Ph.D. Thesis, University of Sussex, 1995.
[13] Memon, M.D., Memon, A.A., and Jokhio, M.H.,
"Application of the Low Reynolds Number Second
Moment Closure to the Closed Rotor-Stator Flows",
Mehran University Research Journal of Engineering &
Technology, Volume 18, No. 2, pp. 117-121, Jamshoro,
Pakistan, April, 1999.
[14] Memon, M.D., Shah, M.A., and Wadho, J.M., "Numerical
Prediction of the Frictional Torque Coefficients in the
Closed Rotor-Stator System", Mehran University
Research Journal of Engineering & Technology, Volume
19, No. 2, pp. 97-103, Jamshoro, Pakistan, April, 2000.
[15] Memon, M.D., and Uqaili, M.A., "Computation of Fluid
Flow and Heat Transfer in Sealed Rotating Cavity",
Mehran University Research Journal of Engineering &
Technology, Volume 21, No. 2, pp. 97-102, Jamshoro,
Pakistan, April, 2002.
[16] Memon, M.D., "Development of the Low Reynolds
Number Second Moment Closure", Mehran University
Research Journal of Engineering & Technology, Volume
18, No. 1, pp. 33-37, Jamshoro, Pakistan, January, 1999.
[17] Abbasi, A.F., Memon, M.D., and Baloch, A., "Modelling
and Predictions of Isothermal Flow Inside the Closed
Rotor-Stator Flows", Mehran University Research
Journal of Engineering & Technology, Volume 31,
No. 1, pp. 83-94, Jamshoro, Pakistan, January, 2012.
[18] Castro, I.P., and Jones, J.M., "Studies in Numerical
Computations of Recirculating Flows", International
Journal of Numerical Methods in Fluids, Volume 7,
pp. 793-802, 1987.
[19] Kilic, M., Gan, X., and Owen, J.M., "Transitional Flow
Between Contra-Rotating Discs", Journal of Fluid
[20] Jones, W.P., and Launder, B.E., "The Calculation of
Low Reynolds Number Phenomena with a Two-Equation
Model of Turbulence", International Journal of Heat
and Mass Transfer, Volume 16, pp. 1119-1130, 1973.
[21] Jones, W.P., and Launder, B.E., "The Prediction of
Laminarization with a Two-Equation Model of
Turbulence", International Journal of Heat and Mass
Transfer, Volume 15, pp. 301-314, 1972.
[22] Long, C.A., Morse, A.P., and Zafiropoulos, N.,
"Buoyancy-Affected Flow and Heat Transfer in
Asymmetrically-Heated Rotating Cavities", Journal of
Turbo-Machinery, Volume 117, pp. 461-478, 1995.
[23] Lai, Y.G., and So, R.M.C., "On Near-Wall Turbulent
Flow Modelling", Journal of Fluid Mechanicsl,
Volume 221, pp. 641-673, 1990.
[24] Hill, R.W., and Ball, K.S., "Chebyshev Collocation
Analysis of Axisymmetric Flow and Heat Transfer
Between Counter-Rotating Discs", ASME, Journal of
Fluids Engineering, Volume 119, pp. 940- 947, 1997.
[25] Hill, R.W., and Ball, K.S., "Direct Numerical Simulations
of Turbulent Forced Convection Between
Counter-Rotating Discs", International Journal of Heat and Fluid
Flow, Volume 20, pp. 208-221, 1999.
[26] Launder, B.E., Poncet, S., and Serre, E., "Transition and
Turbulence in Rotor Stator Flows", Annual Review Fluid
Mechanics, Volume 42, pp. 229-248, 2010.
[27] Dijkstra, D., and Van Heijst, G.J.F., "The Flow Between
Two Finite Rotating Discs Enclosed by a Cylinder",
Journal of Fluid Mechanics, Volume 128 , pp. 123-154,