www.atmos-chem-phys.net/8/7181/2008/ © Author(s) 2008. This work is distributed under the Creative Commons Attribution 3.0 License.
Chemistry
and Physics
Saharan dust levels in Greece and received inhalation doses
C. Mitsakou1, G. Kallos1, N. Papantoniou1, C. Spyrou1, S. Solomos1, M. Astitha1, and C. Housiadas2
1National and Kapodistrian University of Athens, Department of Physics, Athens, Greece
2National Centre for Scientific Research “Demokritos”, Inst. of Nuclear Technology and Radiation Protection, Athens, Greece
Received: 7 March 2008 – Published in Atmos. Chem. Phys. Discuss.: 16 June 2008 Revised: 29 October 2008 – Accepted: 31 October 2008 – Published: 9 December 2008
Abstract. The desert of Sahara is one of the major sources
of mineral dust on Earth, producing around 2×10⁸tons/yr.
Under certain weather conditions, dust particles from Saha-ran desert get tSaha-ransported over the MediterSaha-ranean Sea and most of Europe. The limiting values set by the directive EC/30/1999 of European Union can easily be exceeded by the transport of desert dust particles in the south European Region and especially in urban areas, where there is also significant contribution from anthropogenic sources. In this study, the effects of dust transport on air quality in several Greek urban areas are quantified. PM10 concentration
val-ues from stationary monitoring stations are compared to dust concentrations for the 4-year period 2003–2006. The dust concentration values in the Greek areas were estimated by the SKIRON modelling system coupled with embedded algo-rithms describing the dust cycle. The mean annual dust con-tribution to daily-averaged PM10 concentration values was
found to be around or even greater than 10% in the urban areas throughout the years examined. Natural dust trans-port may contribute by more than 20% to the annual num-ber of exceedances – PM10 values greater than EU limits –
depending on the specific monitoring location. In a second stage of the study, the inhaled lung dose received by the res-idents in various Greek locations is calculated. The parti-cle deposition efficiency of mineral dust at the different parts of the human respiratory tract is determined by applying a lung dosimetry numerical model, which incorporates inhala-tion dynamics and aerosol physical processes. The inhalainhala-tion dose from mineral dust particles was greater in the upper res-piratory system (extrathoracic region) and less significant in the lungs, especially in the sensitive alveolar region. How-ever, in cases of dust episodes, the amounts of mineral dust deposited along the human lung are comparable to those re-ceived during exposure in heavily polluted urban or smoking areas.
Correspondence to:G. Kallos
1 Introduction
Mineral dust, produced by wind erosion, over arid and semi-arid areas of North Africa, is transported over the Mediter-ranean Sea and most of Europe, under certain weather con-ditions. Desert dust particles affect the atmosphere and cli-mate. By scattering and absorbing solar radiation they mod-ify the planetary albedo and reduce the amount of radiation reaching the Earth’s surface (Yu et al., 2001). Aerosols act as cloud condensation nuclei (CCN), thus modifying the mi-crophysical, micro-chemical and, hence, optical and radia-tive properties of clouds (Charlson et al., 1991). They can also influence the nutrient dynamics and biogeochemical cy-cling of both terrestrial and oceanic ecosystems (Herut et al., 2001).
In the past decades, several studies indicated a clear con-nection between suspended particulate matter and health effects (Dockery and Pope, 1994). Therefore, the Euro-pean Community has established the Air Quality Directive 1999/30/EC limiting the concentration levels of PM10; mean
annual PM10 concentrations should not exceed 40µg m−3,
and the daily limit value of 50µg m−3 should not be
ex-ceeded more than 35 days/yr. The above standards had to be accomplished by the year 2005. These limiting values can easily be exceeded by naturally produced aerosols (desert dust) for many days during the year in all southern Euro-pean areas and especially in urban locations, where the con-tribution from anthropogenic sources is always considerable. Thus, many recent studies have focused on the estimation of the influence of the African dust on air quality in south-ern European countries and especially in Spain and Italy (Querol et al., 2001; Rodr´ıguez et al., 2003; Escudero et al., 2007; Perrino et al., 2008). A recent analysis of Kallos et al. (2007a) and Astitha et al. (2008) showed that for approx-imately 50% of the days with daily PM10 exceedance there
The first objective of this study is to quantify the effects of dust transport on air quality in several Greek urban areas us-ing a large number of data from PM monitorus-ing stations and air quality model outputs. The model used is the SKIRON weather forecasting system with the desert dust module (Kal-los et al., 1997; Nickovic et al., 2001). The second objective is to investigate the inhaled doses of dust received by the residents in the Greek urban areas during various exposure conditions. Inhaled dust particles may be deposited at dif-ferent parts of the human respiratory tract (nasopharyngeal, tracheobronchial, alveolar region). The determination of the particle deposition at different parts of the respiratory sys-tem is an essential step in investigating possible risks from exposure to desert dust. To this end, a recently developed dosimetry model (Mitsakou et al., 2005) is applied. The model calculates deposited inhaled aerosols in the various regions of the human respiratory tract, taking into account the aerosol properties (e.g. size distribution, hygroscopicity) and the physiological conditions of the individual.
The methodology adopted for the air quality and dosime-try analyses is described in Sect. 2, while Sect. 3 provides discussion of the results. Finally, the concluding remarks of the study are summarized in Sect. 4.
2 Methodology
2.1 Air quality analysis
For the purpose of this study, the operational runs of the SK-IRON system and the daily-averaged PM10mass
concentra-tion measurements from air quality monitoring staconcentra-tions of the Greek Ministry of Environment City Planning and Pub-lic Works (MECPPW) have been analyzed. Correlations be-tween the model outputs and the PM10 measurements from
the monitoring stations can help identifying the dust con-tribution to the air quality in the Greek urban areas. The model predictions and the experimental measurements cover the four-year period of 2003–2006. A brief description of the implemented tools is given below.
2.1.1 SKIRON modelling system
In this study, the SKIRON atmospheric modelling system was used (Kallos et al., 1997; Papadopoulos et al., 2002). SKIRON is a modified version of the Eta/NCEP regional at-mospheric model, fully coupled with a module for describ-ing the desert dust cycle in the atmosphere. The Eta model is well-documented and detailed descriptions of its dynam-ical and physdynam-ical components can be found in several stud-ies (e.g., Mesinger et al., 1988; Janjic, 1994, and references therein). This initial version has been further improved by incorporating high resolution sea surface temperature SST fields, spatial distributions of clay amounts, non-hydrostatic corrections, as suggested by Janjic et al. (2001), in-cloud de-position efficiency, etc. During the SKIRON and
POSEI-DON projects, the atmospheric radiation and surface pro-cesses have been tested and updated (Papadopoulos et al., 2002).
The first dust cycle module was developed at the Univer-sity of Athens in the framework of the MEDUSE project and further tested and developed during the ADIOS project. In Nickovic et al. (2001), it was given the name DREAM (Dust REgional Atmospheric Model). The present version incor-porates several state-of-the-art parameterizations for the de-scription of the production, transport and removal processes of the desert dust cycle, while several inconsistencies in the initial version described in Nickovic et al. (2001) have been corrected. For the definition of the areas that are poten-tially active, global datasets are used for the vegetation (Ol-son World Ecosystems with 30×30 resolution) and soil tex-ture (FAO/UNESCO with 2×2 resolution). The soil texture dataset has been enhanced by using the concept of rocky soil. Also, the soil moisture and turbulent state of the atmosphere play a critical role in the amount of dust uplifted and injected into the air. Since the dust cycle module is dynamically cou-pled to the atmospheric model, the prognostic atmospheric and hydrological conditions are used to calculate the effec-tive rates of the injected dust at each time step.
The initial version was using a single particle size (1997– 2003). The model version used in the present study had four size bins with centered diameters of 1.5, 12, 36, and 76µm (Tegen and Fung, 1994). For the present analysis, the model outputs that correspond to the two smaller-diameter (1.5 and 12µm) size bins are taken into account in order to approach the PM10 African dust. The ability of the model to
pre-dict the dust concentration for a long period has been tested for long-range transport of Saharan dust across the Atlantic Ocean (Kallos et al., 2006). The simulated dust concentra-tion values appeared to agree satisfactorily with the avail-able observations. Moreover, the evaluation of dust transport simulations with the SKIRON system proceeded with the aid of ground dust concentration measurements in Haifa, Israel and LIDAR measurements performed from 2001 to 2003 in Rome, Italy. More details on the evaluation of the system can be found in the works of Kishcha et al. (2007) and Kallos et al. (2007b). In addition, the various versions of SKIRON (also known as DREAM) model have been widely applied for the determination of African dust production, transport and deposition in the last years with satisfactory predictions (Rodr´ıguez et al., 2001; Rodr´ıguez et al., 2003; Viana et al., 2005; Astitha et al., 2008; Papayannis et al., 2008).
et al. (2003), together with several other improvements has replaced the operational one. In the present work, the long time series of desert dust data with four size bins are used to quantify the effects of naturally produced aerosols in PM10
monitoring stations in Greece. 2.1.2 Experimental data
The MECPPW has a relatively dense monitoring network in Athens and in major Greek urban areas. However, in many of them there are long gaps in the monitoring procedure. Thus, four monitoring sites were selected for the present analysis based on the data availability and geographical location. The selection criteria were related to the length of the time se-ries, the location of the stations and the representativeness of the greater urban conglomerate. Each monitoring station is situated in populated Greek urban areas, namely, Athens, Patra, Volos, Heraklion. The locations of the monitoring stations are displayed in Fig. 1. According to the criteria proposed by the European Environment Agency, the moni-toring station of Athens located northwest of the city center (Thrakomakedones) is a suburban-background station. Thus, the contribution of local PM sources (traffic, construction works and other anthropogenic activities) to air quality at the specific area is limited and the contribution of the nat-ural sources is more easily detectable. However, no subur-ban monitoring stations have been placed in the other ursubur-ban areas (Patra, Volos, Heraklion). These cities are relatively small (150 000–300 000 inhabitants) and therefore, the anal-ysis was conducted with the data collected from the urban monitoring stations of the three areas. The concentration of PM10 aerosol particles is monitored at the above-mentioned
sites by usingβ-attenuation systems. 2.1.3 SKIRON output processing
The forecast model generates hourly dust concentrations. Thus, the daily-averaged values of dust concentration had to be calculated based on the hourly values for the comparison with the experimental ones from the monitoring stations. The model domain covers the area from 24◦
W to 41◦
E and from 9◦
N to 60◦
N. The horizontal grid increment of the model do-main is 0.24◦
(approximately 25 km). In the vertical, 32 lev-els were used stretching from the ground to the model top (20 km). The determination of the simulated dust concentra-tion at the specific measuring points of the MECPPW sta-tions was achieved by applying linear interpolation to the model outputs. More specifically, the aerosol concentration at the measuring points was approximated by the relative contribution of the closest grid points of SKIRON domain introducing a weight function (inverse distance weighting) for the contribution of the grid points to the actual location of the MECPPW station.
Fig. 1. Location of the Greek monitoring stations, 1: Heraklion, 2: Athens suburb, 3: Patra, 4: Volos. (Source: www.googleearth. com).
2.2 Dosimetry analysis
For the dosimetric calculations a mechanistic inhalation dosimetry model is used, which includes both inhalation and aerosol dynamics (Mitsakou et al., 2005). The model solves the aerosol general dynamic equation (GDE) along the flow direction (in one dimension). The size distribution is de-scribed with a sectional representation, which allows for ar-bitrary functional forms of the size distribution. The descrip-tion of the respiratory tract is based on Weibel’s morphome-tric model “A” (Weibel, 1963), incorporating time-varying alveolar region during breathing (expanding and contracting rhythmically during respiration). The particle deposition is assumed to be the result of the mechanisms of gravitational settling, Brownian diffusion and inertial impaction, acting si-multaneously. The air velocity in the airways is determined by solving the equation of continuity.
The deposition rate of inhaled particles in the respiratory tract is calculated by summing up the calculated rate for each size bin, taking into account the tidal volume (volume of air inspired and expired during each respiratory cycle) and the breathing frequency (number of breaths per time), as follows Deposition rate=X
i
Janu ary
Febru
ary
March April May June JulyAugust
Septe mber Octob er Novem ber Dece mber 0 100 200 300 400 P M10 c o n c e n tr a ti o n ( g m -3) Months
JanuaryFebru
aryMarch April May June July
Augu
st
Septe
mberOctober
Novem
ber
Decemb
er 0 100 200 300 400 P M10 c o n c e n tr a ti o n ( g m -3) Months Janu ary Febru ary
March April May June JulyAugust
Septe mber Octob er Novem ber Dece mber 0 100 200 300 400 d c b P M10 c o n c e n tr a ti o n ( g m -3) Months a
JanuaryFebru
aryMarch April May June JulyAugust
Septe
mberOctober
Novemb
er
Decemb
er 0 100 200 300 400 P M1 0 c o n c e n tr a ti o n ( g m -3) Months
Fig. 2.Box plots of PM10concentration values for the sites of(a)Heraklion,(b)Athens suburb,(c)Patra,(d)Volos, for the period 2003–
2006 (for Heraklion 3-year period: 2003–2005). Upper and lower bars indicate 90th and 10th percentiles, the bars and the markers inside the boxes indicate the median and the mean values respectively and the whiskers range between minimum and maximum values.
whereDFis the calculated deposited fraction,nithe particle
number concentration of theith size section at the entrance of the respiratory tract,VT the tidal volume andf the breathing
frequency. The physiological parametersVT andf depend
on the level of physical exertion. The values utilized in our calculations are taken from ICRP (1994), as recommended for an adult Caucasian male under the typified conditions of light exercise (VT=1250 ml,f=20 min−1).
3 Results and discussions
3.1 Natural dust transport
A first approach for the origin of the urban particulate mat-ter is attempted via a statistical analysis of the PM10
con-centration values from the monitoring stations. The box plots in Fig. 2a–d illustrate the statistical parameters (min-imum/maximum, mean, median values, 10th and 90th per-centiles) of the monthly concentration of PM10
measure-ments for each monitoring station. These values were calcu-lated from the measured concentrations obtained during the respective months of the 4-year database (3-year database for Heraklion, measurements for 2006 are missing).
Peak PM10values can be identified mostly during the
tran-sition seasons (spring and autumn) and secondarily in win-ter in almost all monitoring sites, while minimum values are
usually noticed during the summer period due to the prevail-ing northerly wind patterns (etesian winds, see Kallos et al., 1993). For example, the monthly averaged PM10
concen-trations for the Athens suburban station have maximum in April, when African dust concentrations are also high (see Figs. 2, 3). Maximum PM10 concentration values exceed
400µg m−3during April in Athens and Heraklion. The most
significant sources of PM10 could be natural (Saharan dust,
sea salt, pollen from pine and olive trees during spring), but also anthropogenic (central heating, traffic, industry), as mentioned in previous studies (e.g. Querol et al., 2004). The maximum sea salt concentration occurs during the winter period due to the high sea spray production (Koc¸ak et al., 2007). Moreover, the use of central heating reaches a peak load during winter. Increased dust transport takes place in the transition seasons (spring and autumn, Gerasopoulos et al., 2006; Kallos et al., 2007b). According to the above analysis, PM10 maximum values in spring or autumn months could
be attributed mainly to mineral dust transport. It should be noted here, that there is accumulated contribution from local sources (e.g. traffic), but the seasonal variability is not con-sidered as important as compared to dust amounts reaching the Greek areas during episodes. On the other hand, PM10
D
u
st
c
o
n
c
e
n
tra
ti
o
n
(
g
m
-3) 0 50 1 00 1 50 2 00 2 50 3 00
0 50 100 150 200 250 300
01.01.03 02.07.03 01.01.04 01.07.04 31.12.04 01.07.05 31.12.05 01.07.06 31.12.06
0 50 100 150 200 250 300
0 50 100 150 200 250 300
0 5 0 1 0 0 1 5 0 2 0 0 2 5 0 3 0 0
0 5 0 1 0 0 1 5 0 2 0 0 2 5 0 3 0 0
0 5 0 1 0 0 1 5 0 2 0 0 2 5 0 3 0 0
Jan03 Jul03 Jan04 Jul04 Jan05 Jul05 Jan06 Jul06 Jan07
Jan03 Jul03 Jan04 Jul04 Jan05 Jul05 Jan06 Jul06 Jan07
Jan03 Jul03 Jan04 Jul04 Jan05 Jul05 Jan06 Jul06 Jan07
Jan03 Jul03 Jan04 Jul04 Jan05 Jul05 Jan06 Jul06 Jan07
0 50 100 150 200 250 300 350 400 450 500 0 50 100 150 200 250 300 350 400 450 500
0 100 200 300 400 500
0 100 200 300 400 500
0 20 40 60 80 100 120 140 160 180
0 20 40 60 80 100 120 140 160 180
0 50 100 150 200 250 300
0 50 100 150 200 250 300 S im u la te d du st co nc e n tr a ti o n ( µ g m -3)
Observed PM10 concentration (µg m -3
)
a y = 0.39 x - 16.10
R = 0.52
b y = 0.28 x - 3.00
R = 0.65
S im u la te d du st co nce n tr at io n ( µ g m -3)
Observed PM10 concentration (µg m -3
)
c y = 0.74 x - 35.05
R = 0.47
S im u la te d du st co nc e n tr a ti o n ( µ g m -3) Observed PM
10 concentration (µg m -3)
d y = 0.14 x - 4.46
R = 0.26
S im u la te d du st co nc e n tr at io n ( µ g m -3) Observed PM
10 concentration (µg m -3)
Fig. 4. Correlations between observed PM10 concentrations and simulated dust concentrations for the sites of(a)Heraklion,(b)Athens
suburb,(c)Patra,(d)Volos, for the period 2003–2006 (for Heraklion 3-year period: 2003–2005).
the distance from Heraklion is approximately 4◦(∼400 km). The influence of dust transport decreases towards higher ge-ographical latitudes. The effect of dust transport is reduced with increasing distance from the dust source, as dust par-ticles are deposited via wet and dry mechanisms along the transport paths. Thus, the contribution of dust particles to the air quality in Volos is expected to be limited, while there are other significant contributors to particle concentration in the area. Such contributors could be the two extended indus-trial areas at the outskirts of the town (one northwest of the town and a concrete production unit at the southeast part), where high PM amounts are released.
The periods of increased dust transport are also distin-guished by the simulated dust concentration values. In Fig. 3, the time series of Saharan dust levels for the four urban ar-eas, as simulated by the SKIRON modelling system, are il-lustrated for the period 2003–2006. The most severe dust transport episodes usually appear during the period from the beginning of spring until the first days of June. Maximum values are noticed in May; high levels of dust concentration dominate in March and April. Secondary maxima of dust concentration can be identified during September and Octo-ber. The above results appear to agree with the fact of in-creased dust concentrations during the transition periods.
Model estimates of near ground dust concentrations have been compared with PM10 observations. More specifically,
in Fig. 4a–d scatter plots between predicted dust
concen-trations and measured PM10 concentrations for the cases of
daily exceedances (observed PM10 values greater than the
daily EU limit of 50µg m−3)are presented for each
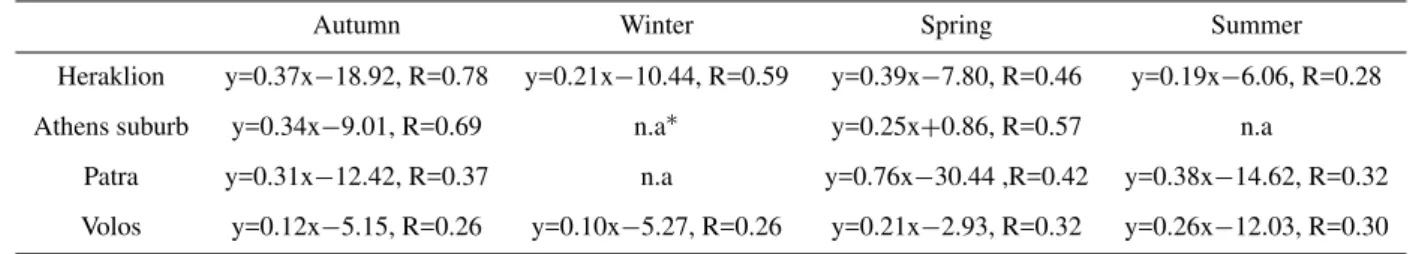
mon-itoring station and for the whole period (2003–2006). The seasonal trend lines of the scatter plots and the correlation co-efficients for each season of the year separately and for each monitoring site are presented in Table 1, wherex is the ob-served PM10concentration andy is the simulated dust
con-centration (for cases of daily exceedances). The correlation coefficients appear to fluctuate between 0.78 (Heraklion, au-tumn period) and 0.26 (Volos). The low coefficient value be-tween PM10and dust concentrations for Volos station, during
Table 1.Seasonal trend lines and correlation coefficients between PM10concentrations and simulated dust concentrations.
Autumn Winter Spring Summer
Heraklion y=0.37x−18.92, R=0.78 y=0.21x−10.44, R=0.59 y=0.39x−7.80, R=0.46 y=0.19x−6.06, R=0.28
Athens suburb y=0.34x−9.01, R=0.69 n.a∗ y=0.25x+0.86, R=0.57 n.a
Patra y=0.31x−12.42, R=0.37 n.a y=0.76x−30.44 ,R=0.42 y=0.38x−14.62, R=0.32
Volos y=0.12x−5.15, R=0.26 y=0.10x−5.27, R=0.26 y=0.21x−2.93, R=0.32 y=0.26x−12.03, R=0.30
∗not available, small number of available data
especially the global database used for the identification of dust sources (desert dust classification) and the relatively low horizontal resolution of the model (0.24◦×
0.24◦
) that was the optimal choice of the operational runs given the wide model domain and the available computer resources.
The slope of the trend line in Fig. 4a–d is indicative of the percentage of mineral dust in PM10 concentration, when
exceedances occur, while the intercept pertains to the ur-ban background concentrations. For the monitoring station of Heraklion, the slope of the trend line is 0.39 (Fig. 4a) that denotes a dust contribution to urban aerosol approach-ing 40%. Gerasopoulos et al. (2006) performed a chemi-cal analysis of PM10 in combination with back-trajectories
analysis for Heraklion during dust episodes. The analyses showed a participation of mineral dust at about 40% in PM10
daily exceedances throughout the year. Thus, the analysis of Gerasopoulos et al. (2006) seems to verify the dust con-tribution calculated in the present analysis. The fraction of dust transported particles to PM10 values exhibits the lowest
value during the summer period (the slope of the trend line is 0.19, see Table 1), which is in agreement with the findings of the latter work. The high intercept values for the site of Patra demonstrates the remarkable influence of local pollu-tion, while the slope of 0.76 during the spring period reveals that dust transport also plays a significant role in the urban air quality. Dust transport seems to affect PM10values in cases
of daily exceedances in Athens by 25 and 34% during the spring and autumn periods respectively. However, a com-parison with the other seasonal periods is not feasible due to very limited number of PM10 observations during winter
and summer. It should be noted, though, that air quality in the Greek urban areas examined here is influenced by the in-troduction of sea-salt particles, as all the studied areas are near the seaside. Moreover, southwestern flows that enhance dust transport from the African continent, could also lead to severe air pollution episodes as they are combined with an abrupt temperature change (Kallos et al., 1993). Therefore, PM10concentration data could not distinguish the dust
trans-ported mass from the other suspended materials. Note that the different correlations between simulated and observed values for the various urban areas should be also attributed to the different PM sources. More accurate predictions of dust
contribution for the whole period are obtained for the moni-toring site of Athens suburb (higher correlation coefficient in Fig. 4b), as the monitoring station there is characterized as suburban-background.
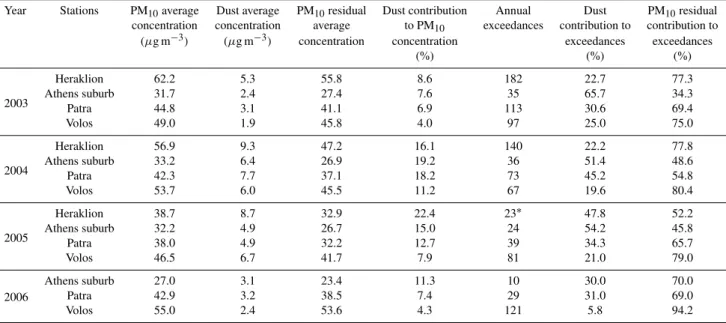
A more explicit statistical analysis of the observed and simulated data for the four years that we examined has been performed. Some of these results are summarized in Table 2. In this table, the values shown refer to the averaged observed and simulated values, the PM10 residual average
concentra-tions (annual mean of daily PM10levels after subtraction of
dust concentrations), the dust contribution to averaged PM10
concentrations, the number of annual exceedances and the dust and the residual PM10contribution to daily exceedances.
The annual averaged dust concentration is determined by ac-counting all days and not only these with dust contribution to exceedances. The residual PM10 contribution was
de-termined by re-calculating the number of exceedances after subtraction of dust simulated concentration values from the PM10 measured values and estimating the ratio of the new
(after dust elimination) to the total number of exceedances. Thus, the dust contribution to exceedances is the supple-mentary fraction (100-residual PM10 contribution). By this
approach, an exceedance is attributed to “non-African ori-gin” if the residual of the subtraction of SKIRON dust load from the daily PM10levels still exceeds the daily limit value,
while the residual number of exceedances is attributed to an “African origin”. The “non-African origin” exceedances are described by the last column in Table 2 and the “African ori-gin” exceedances by the percentage of dust contribution to exceedances in the table (e.g. for Athens suburb during 2003, 65.7% of the daily exceedances were of “African origin” and 34.3% were of “non-African origin”).
The monitoring site of Athens suburb shows the lowest aerosol concentration and number of exceedances compar-ing to the other sites; mass concentration for the suburban-background stations presents significantly lower values, since anthropogenic sources are less active in these areas. The annual averaged dust concentration decreases from the southern (Heraklion) towards the northern Greek site that we examined (Volos), according to SKIRON model predic-tions. As dust decreases, the PM10residual average
Table 2. PM10/dust/PM10residual average concentrations, number of annual exceedances and quantification of dust and PM10 residual
contribution to urban air quality.
Year Stations PM10average Dust average PM10residual Dust contribution Annual Dust PM10residual
concentration concentration average to PM10 exceedances contribution to contribution to
(µg m−3) (µg m−3) concentration concentration exceedances exceedances
(%) (%) (%)
2003
Heraklion 62.2 5.3 55.8 8.6 182 22.7 77.3
Athens suburb 31.7 2.4 27.4 7.6 35 65.7 34.3
Patra 44.8 3.1 41.1 6.9 113 30.6 69.4
Volos 49.0 1.9 45.8 4.0 97 25.0 75.0
2004
Heraklion 56.9 9.3 47.2 16.1 140 22.2 77.8
Athens suburb 33.2 6.4 26.9 19.2 36 51.4 48.6
Patra 42.3 7.7 37.1 18.2 73 45.2 54.8
Volos 53.7 6.0 45.5 11.2 67 19.6 80.4
2005
Heraklion 38.7 8.7 32.9 22.4 23∗ 47.8 52.2
Athens suburb 32.2 4.9 26.7 15.0 24 54.2 45.8
Patra 38.0 4.9 32.2 12.7 39 34.3 65.7
Volos 46.5 6.7 41.7 7.9 81 21.0 79.0
2006
Athens suburb 27.0 3.1 23.4 11.3 10 30.0 70.0
Patra 42.9 3.2 38.5 7.4 29 31.0 69.0
Volos 55.0 2.4 53.6 4.3 121 5.8 94.2
∗small number of available data
In particular, the mineral dust concentration values at Vo-los appear to be about 30% lower than the dust concentra-tion values predicted for the town of Heraklion for 2004 and 2005 (about 6 and 9µg m−3for Volos and Heraklion,
respec-tively). The decreasing number of daily exceedances for the areas of Patra, Athens suburb and Heraklion1 during the 4-year period can be attributed to a possible reduction of dust episodes, since mineral dust transport performs a significant inter-annual variation (e.g. Sunnu et al., 2008), while no par-ticular reduction in anthropogenic PM emissions in Greece has been reported during the period analyzed. The dust con-tribution to PM10concentrations – annual average of daily
ra-tios of dust to PM10concentrations – approaches and exceeds
10% for the areas of Patra, Athens suburb and Heraklion. In terms of daily exceedances the dust contribution is very high at the suburban station of Athens (e.g. 54.2% for 2005) and noticeable for the other Greek urban areas (>20%).
3.2 Inhaled dose
The human exposure to Saharan dust particles under various dust concentration levels is approached by calculating the different percentiles of aerosol concentration derived by SK-IRON modelling system (Table 3). By determining the per-centiles (90th, 95th, 99.5th, 100th), four exposure categories are distinguished for dust concentration values between the percentile intervals (0–90, 90–95, 95–99.5, 99.5–100). For
1Small number of available data for 2005
each exposure category, the dust mass concentration is as-sumed to take the maximum value. By that approach, the upper limits of human exposure and received lung dose to Saharan dust particles can be derived. In Table 3, the num-ber of days that correspond to each exposure category is pre-sented (the boundaries of each exposure level, as defined by the percentiles, are shown in the parentheses). As expected, the percentiles of dust concentration exhibit their highest val-ues at Heraklion, while the lowest percentiles are noticed for the town of Volos.
Based on the different exposure categories, we assess the lung dose for residents of the Greek urban sites due to Sa-haran dust transport throughout a year. However, the four-size SKIRON version used in the present analysis could not provide a detailed particle size distribution, as required by the dosimetry model. Thus, for the description of the size distribution of the dust transported cloud in the Greek area, we employed the long-range transport mode proposed by Schulz et al. (1998) and tested by Zender et al. (2003). More specifically, the dust particle size distribution follows a log-normal form with mass median diameter (MMD) equal to 2.524µm and geometric standard deviation equal to σ=2. For the mineral aerosol, the particle density ρp is taken
equal to 2.65 g cm−3. Note that, a lognormal distribution is
Table 3.Percentiles of the dust mass concentration for the Greek sites (Heraklion, Athens suburb, Patra, Volos) and number of days per year that corresponds to each exposure category.
Mass concentration (µg m−3)
Percentile no. of days per year Heraklion Athens suburb Patra Volos
90% 308 (0–90) 20.6 11.8 12.7 8.9
95% 37 (90–95) 33.2 24.6 23.8 21.7
99.5% 18 (95–99.5) 136.7 81.7 102.6 65.9
100% 2 (99.5–100) 257.7 155.5 177.9 140.9
Table 4.Ratio of the deposited mass over the total inhaled mass.
Respiratory tract Mass deposited
regions fraction
ET 0.64
TB 0.16
AI 0.10
Total 0.90
mass size distributions at a coastal site situated 70 km east-northeast of Heraklion (Finokalia). For the spring pe-riod, enhanced concentration for particles with aerodynamic diameters 3–7µm (physical diameters 1.8–4.3µm) was ob-tained, attributed to dust transport from Northern Africa. The normalized particle mass distribution (particle mass distribu-tion divided to mass concentradistribu-tion) with the physical charac-teristics (MMD,σ) used for the dosimetric calculations are il-lustrated in Fig. 5, as a function of particle diameterD. How-ever, it should be noted that long-range transported particle sizes measured away from source regions may depend sig-nificantly on the distance from the source regions (Park and Kim, 2006). Larger particles can be detected at regions near the source points. The mode of the particle size distribution appears shifted towards smaller particle diameters, as the dis-tance from the dust sources increases. Therefore, the aerosol size distribution used for the depiction of suspended parti-cles at the more distant sites (Athens suburb, Patra, Volos) may be distorted. Aerosol deposition at the various regions of the respiratory tract is strongly dependent on particle size distribution of the inhaled aerosols (Lippmann et al., 1980). Thus, the incorporation of a more detailed bin method in SK-IRON modelling system would lead to more accurate dosi-metric calculations. However, the use of the current model is considered as efficient for a generic dose assessment.
0 0.2 0.4 0.6 0.8 1 1.2 1.4
0.1 1 10 100
Particle diameter, D (µm)
d
mi
/(
m
dl
o
g
D
)
Fig. 5.Normalized mass distribution as a function of particle diam-eter for the Greek sites.
In SKIRON modelling system, the atmospheric dust be-haves as an inert chemical substance. Therefore, in the present study, mineral dust is considered as non-hygroscopic as is at its native state. However, dust particles may become hygroscopic through the “aging” process – chemical alter-ations at the particle surface (Zhang et al., 1994; Levin et al., 1996). Moreover, the presence of hygroscopic biologi-cal aerosols (i.e. bacteria, pollen) in the atmosphere (M¨ohler et al., 2007) is often linked to dust transport (Shinn et al., 2003). Particle deposition pattern along the human lung is highly dependent on aerosol hygroscopicity; thus, the fore-cast model would be significantly improved by taking into account the physicochemical properties of the dust particles in a forthcoming study. Nevertheless, the assumption of inert dust particles, as commonly adopted by the models that deal with dust transport (e.g. Nickovic et al., 2001, and references therein), is applied for the current dosimetric calculations.
0 20 40 60 80 320 340 360 0
100 200 300 400 500
600 b
m
a
ss deposi
ti
on r
a
te
(
µ
g day
-1)
no. of days per year
0 20 40 60 80 320 340 360
0 100 200 300 400 500
600 c
mass
deposi
ti
o
n
r
a
te
(
µ
g day
-1)
no. of days per year
0 20 40 60 80 320 340 360
0 100 200 300 400 500 600
m
a
ss deposi
ti
o
n r
a
te
(
µ
g day
-1)
no. of days per year
a
0 20 40 60 80 320 340 360
0 100 200 300 400 500
600 d
m
a
ss deposi
ti
on r
a
te
(
µ
g day
-1)
no. of days per year
Fig. 6.Mass deposition rates in the human lung as a function of number of days per year for a resident of(a)Heraklion,(b)Athens suburb, (c)Patra and(d)Volos.
the ET region. The deeper lung regions (AI) have a lower concentration of the larger inhaled particles as a result of the deposition made at the entrance of the respiratory tract (ET region). The great amount of PM mass is accumulated at the larger particle sizes, thus the airborne particle mass decreases while traversing the lung. As a consequence, only 10% of the inhaled particle mass is deposited in the pulmonary lung (AI region).
In order to obtain an integrated assessment of the re-ceived inhaled dose from Saharan dust to the residents of the Greek urban areas, the daily mass deposition rates in the lung (TB and AI regions) were calculated for the differ-ent exposure conditions throughout a year (Fig. 6), assuming a typical daily exposure of 6 h. Extremely high mass de-posited values during a day are performed for the days of se-vere dust episodes (99.5th–100th percentile), reaching up to 600µg day−1for a resident at Heraklion. On the other hand,
the dust mass deposited in the lung for a resident at Volos is only half under all exposure conditions examined here. It must be noted, that the relationship between inhaled dose and dust concentration is linear, since identical physical activity (light exercise) was assumed for all exposure conditions and at the various sites (see Eq. 1). The calculated mass deposi-tion rates are compared to the respective deposideposi-tion rates pre-sented in the work of Venkataraman and Raymond (1998), so as to interpret the present results. The latter authors reported that the lung dose resulting from the typical daily exposure in the polluted Los Angeles basin equals to 294µg day−1,
while 16-h exposure to environmental tobacco smoke (ETS) leads to dose ranging from 135 to 187µg day−1 for adult
males and from 76 to 106µg day−1for females. Thus, the
received lung dose for a resident in Patra or Heraklion town during a moderate dust episode (95th–99.5th percentile) is similar to the dose received after exposure in the polluted ur-ban air basin of Los Angeles. Under low dust exposure con-ditions (90th–95th percentile), the equivalent doses may ap-proach the particle respiratory deposition in a smoking area. We have not addressed the toxicological significance of this inhaled dose resulting from the exposure in mineral dust particles, if any. The current calculations showed, however, that the respiratory dose resulting from dust exposure could be significant, generating further studies in this direction.
4 Conclusions
In the present study, an attempt was made to determine the mineral dust levels in Greek urban areas and the received in-haled dose. The quantification of the dust transport effects in urban air quality was accomplished by analyzing a large database of PM10 daily measurements and SKIRON model
mechanisms, thus, the fraction of dust to PM10
concentra-tion appeared to vary significantly depending on the locaconcentra-tion, of course with respect to the most often followed transport paths. Natural dust transport may contribute by much more than 20% to the annual number of exceedances (in some cases around 60%). The mean annual dust contribution to daily-averaged PM10 concentrations was often found to be
greater than 10% throughout the years examined. However, the poor correlation found in some cases between observed PM10 and simulated dust concentration values could be
at-tributed to various reasons, such as specific geomorpholog-ical characteristics of the different areas, northerly etesian winds during summer that reduce dust transport, as well as limitations of the atmospheric/dust transport model (identifi-cation of dust sources, relatively low horizontal resolution).
The determination of the received inhaled doses by the res-idents in the Greek urban areas showed that the inhaled dose was greater in the upper respiratory system (extrathoracic re-gion), since the major amount of PM mass is accumulated at the larger particle sizes that are mostly deposited before reaching the lung. Higher lung deposition rates were cal-culated for the citizens of the southern part of the country (Heraklion), while the doses are reduced by half for an in-dividual living 400 km far to the North. The calculated lung doses during severe and moderate dust episodes were found to be comparable to those received during exposure in pol-luted urban and smoking areas.
These concluding remarks are also applicable to most southern European urban areas, since dust episodes and local weather conditions are similar to the Greek ones. However, the above results cannot be extrapolated to northern African areas, where the situation is expected to be even worst due to the higher dust concentrations and the frequency of extreme desert dust events.
Acknowledgements. This work has been supported by the Euro-pean Union 6th Framework Program CIRCE IP, contract #036961. The authors also acknowledge the Greek Ministry of Environment City Planning and Public Works for providing the data on PM10 mass concentration from their monitoring network. The anony-mous reviewers are acknowledged for their useful and constructive comments.
Edited by: N. Mihalopoulos
References
Astitha, M., Kallos, G., and Katsafados, P.: Air pollution mod-elling in the Mediterranean Region: Analysis and forecasting of episodes, Atmos. Res., 89, 358–364, 2008.
Charlson, R. J., Langner, J., Rodhe, H., Leovy, C. B., and Warren, S. G.: Perturbation of the Northern Hemisphere radiative balance by backscattering from anthropogenic sulfate aerosols, Tellus A-B, 43, 152–163, 1991.
Dockery, D. W. and Pope, C. A.: Acute respiratory effects of partic-ulate air pollution, Annu. Rev. Publ. Health, 15, 107–132, 1994.
Escudero, M., Querol, X., Pey, J., Alastuey, A., P´erez, N., Ferreira, F., Alonso, S., Rodr´ıguez, S., and Cuevas, E.: A methodology for the quantification of the net African dust load in air quality monitoring networks, Atmos. Environ., 41, 5516–5524, 2007. Gerasopoulos, E., Kouvarakis, G., Babasakalis, P., Vrekoussis, M.,
Putaud, J. P., and Mihalopoulos, N.: Origin and variability of particulate matter (PM10)mass concentrations over the Eastern
Mediterranean, Atmos. Environ., 40, 4679–4690, 2006. Gerasopoulos, E., Koulouri, E., Kalivitis, N., Kouvarakis, G.,
Saarikoski, S., M¨akel¨a, T., Hillamo, R., and Mihalopoulos, N.: Size-segregated mass distributions of aerosols over East-ern Mediterranean: seasonal variability and comparison with AERONET columnar size-distributions, Atmos. Chem. Phys., 7, 2551–2561, 2007,
http://www.atmos-chem-phys.net/7/2551/2007/.
Herut, B., Nimmo, M., Medway, A., Chester, R., and Krom, M. D.: Dry atmospheric inputs of trace metals at the Mediterranean coast of Israel (SE Mediterranean): Sources and fluxes, Atmos. Environ., 35, 803–813, 2001.
International Commission on Radiological Protection (ICRP): Hu-man Respiratory Tract Model for Radiological Protection. Tech-nical report, ICRP publication 66, 1994.
Janjic, Z.: The step-mountain eta coordinate model: Further developments of the convection, viscous sublayer and turbu-lence closure schemes, Mon. Weather Rev., 122, 927–945, doi:10.1175/1250-0493, 1994.
Janjic, Z. I., Gerrity, J. P., and Nickovic, S.: An alternative ap-proach to nonhydrostatic modelling, Mon. Weather Rev., 129, 1164–1178, doi:10.1175/1520-0493, 2001.
Kallos, G., Kassomenos, P., and Pielke, R. A.: Synoptic and mesoscale weather conditions during air pollution episodes in Athens, Greece, Bound.-Lay. Meteorol., 62, 163–184, 1993. Kallos, G., Nickovic, S., Papadopoulos, A., Jovic, D., Kakaliagou,
O., Misirlis, N., Boukas, L., Mimikou, N., Sakellaridis, G., Pa-pageorgiou, J., Anadranistakis, E., and Manousakis, M.: The re-gional weather forecasting system SKIRON: An overview, Inter-national Symposium on Regional Weather Prediction on Parallel Computer Environments, Athens, Greece, 15–17 October, 1997. Kallos, G., Papadopoulos, A., Katsafados, P., and Nick-ovic, S.: Transatlantic Saharan dust transport: Model simulation and results, J. Geophys. Res., 111, D09204, doi:10.1029/2005JD006207, 2006.
Kallos, G., Spyrou, C., Papantoniou, N., Mitsakou, C., Astitha, M., Solomos, S., and Katsafados, P.: Analysis of the Particulate Mat-ter Exceedances in Greece, Period 2001–2004, Final Report Pre-pared for the Ministry of Environment City Planning and Public Work, June 2007a.
Kallos, G., Astitha, M., Katsafados, P., and Spyrou, C.: Long-range transport of anthropogenically and naturally produced particulate matter in the Mediterranean and North Atlantic: current state of knowledge, J. Appl. Meteorol. Clim., 46, 1230–1251, 2007b. Kishcha, P., Alpert, P., Shtivelman, A., Krichak, S. O., Joseph, J.
H., Kallos, G., Katsafados, P., Spyrou, C., Gobbi, G. P., Barn-aba, F., Nickovic, S., P´erez, C., and Baldasano, J. M.: Forecast errors in dust vertical distributions over Rome (Italy): Multiple particle size representation and cloud contributions, J. Geophys. Res., 112, D15205, doi:10.1029/2006JD007427, 2007.
Mediterranean, Atmos. Environ., 41, 3806–3818, 2007. Levin, Z., Ganor, E., and Gladstein, V.: The effects of desert
parti-cles coated with sulfate on rain formation in the eastern Mediter-ranean, J. Appl. Meteorol., 35, 1511–1523, 1996.
Lippmann, M., Yeates, D. B., and Albert, R. E.: Deposition, re-tention and clearance of inhaled particles, Brit. J. Ind. Med., 37, 337–362, doi:10.1136/oem.37.4.337, 1980.
Mesinger, F., Janjic, Z. I., Nickovic, S., Gavrilov, D., and Deaven, D. G.: The step-mountain coordinate: Model description and performance for cases of Alpine lee cyclogenesis and for a case of an Appalachian redevelopment, Mon. Weather Rev., 116, 1493–1518, doi:10.1175/1520-0493, 1988.
Mitsakou, C., Helmis, C., and Housiadas, C.: Eulerian modelling of lung deposition with sectional representa-tion of aerosol dynamics, J. Aerosol Sci., 36, 75–94, doi:10.1016/jaerosci.2004.08.008, 2005.
M¨ohler, O., DeMott, P. J., Vali, G., and Levin, Z.: Microbiology and atmospheric processes: the role of biological particles in cloud physics, Biogeosciences, 4, 1059–1071, 2007,
http://www.biogeosciences.net/4/1059/2007/.
Nickovic, S., Kallos, G., Papadopoulos, A., and Kakaliagou, O.: A model for prediction of desert dust cycle in the atmosphere, J. Geophys. Res., 106(D16), 18 113–18 129, 2001.
Papadopoulos, A., Katsafados, P., Kallos, G., and Nickovic, S.: The weather forecasting system for Poseidon – an overview, Global Atmosphere and Ocean System, 8, 219–237, 2002.
Papayannis, A., Amiridis, V., Mona, L., Tsaknakis, G., Balis, D., B¨osenberg, J., Chaikovski, A., De Tomasi, F., Grigorov, I., Mat-tis, I., Mitev, V., M¨uller, D., Nickovic, S., P´erez, C., Pietruczuk, A., Pisani, G., Ravetta, F., Rizi, V., Sicard, M., Trickl, T., Wiegner, M., Gerding, M., Mamouri, R. E., D’Amico, G., and Pappalardo, G.: Systematic lidar observations of Saharan dust over Europe in the frame of EARLINET, J. Geophys. Res., 113, (D10204), doi:10.1029/2007JD009028, 2008.
Park, S. U. and Kim, J. W.: Aerosol size distributions observed at the Seoul National University campus in Korea during the Asian dust and non-Asian dust periods, Atmos. Environ., 40, 1722– 1730, 2006.
Perrino, C., Canepari, S., Cardarelli, E., Catrambone, M., and Sar-golini, T.: Inorganic constituents of urban air pollution in the Lazio region (Central Italy), Environ. Monit. Assess., 136, 69– 86, 2008.
Querol, X., Alastuey, A., Rodr´ıguez, S., Plana, F., Ruiz, C. R., Cots, N., Massagu´e, G., and Puig, O.: PM10and PM2.5source appor-tionment in the Barcelona Metropolitan area, Catalonia, Spain, Atmos. Environ., 35, 6407–6419, 2001.
Querol, X., Alastuey, A., Ruiz, C. R., Artinano, B., Hansson, H. C., Harrison, R. M., Buringh, E., Ten Brink, H. M., Lutz, M., Bruck-mann, P., Straehl, P., and Schneider, J.: Speciation and origin of PM10 and PM2.5in selected European cities, Atmos. Environ.,
38, 6547–6555, 2004.
Rodr´ıguez, S., Querol, X., Alastuey, A., Kallos, G., Kakaliagou, O.: Saharan dust contributions to PM10 and TSP levels in Southern and Eastern Spain, Atmos. Environ., 35, 2433–2447, 2001. Rodr´ıguez, S., Querol, X., Alastuey, A., Viana, M. M., and Mantilla,
E.: Events affecting levels and seasonal evolution of airborne particulate matter concentrations in the Western Mediterranean, Environ. Sci. Technol., 37, 216–222, 2003.
Schulz, M., Balkanski, Y. J., Guelle, W., and Dulac, F.: Role of aerosol size distribution and source location in a three-dimensional simulation of a Saharan dust episode tested against satellite-derived optical thickness, J. Geophys. Res., 103, 10 579–10 592, 1998.
Shinn, E. A., Griffin, D. W., and Seba, D. B.: Atmospheric transport of mold spores in clouds of desert dust, Arch. Environ. Health, 58, 498–504, 2003.
Sunnu, A., Afet, G., and Resch, F.: A long-term experimental stydy of the Saharan dust presence in West Africa, Atmos. Environ., 87, 13–26, 2008.
Tegen, I. and Fung, I.: Modelling of mineral dust in the atmosphere: Sources, transport and optical thickness, J. Geophys. Res., 99, 22 897–22 914, 1994.
Zender, C. S., Bian, H., and Newman, D.: Mineral dust entrainment and deposition (DEAD) model: Description and 1990s dust climatology, J. Geophys. Res., 108, 4416, doi:10.1029/2002JD002775, 2003.
Zhang, Y., Sunwoo, Y., Carmichael, G. R., and Kotamarthi, V.: Pho-tochemical processes in the presence of dust: An evaluation of the effect of dust on particulate nitrate and ozone formation, J. Appl. Meteorol., 33, 813–824, 1994.
Venkataraman, C. and Raymond, J.: Estimating the lung deposition of particulate polycyclic aromatic hydrocarbons associated with multimodal urban aerosols, Inhal. Toxicol., 10, 183–204, 1998. Viana, M., P´erez, C., Querol, X., Alastuey, A., Nockovic, S., and
Baldasano, J. M.: Spatial and temporal variability of PM levels and composition in a complex summer atmospheric scenario in Barcelona (NE Spain), Atmos. Environ., 39, 5343–5361, 2005. Weibel, E. R. Morphometry of human lungs, Springer Edition,
Berlin, Germany, 136–143, 1963.