ACPD
10, 4543–4592, 2010Carbonaceous aerosol microphysics
S. E. Bauer et al.
Title Page
Abstract Introduction
Conclusions References
Tables Figures
◭ ◮
◭ ◮
Back Close
Full Screen / Esc
Printer-friendly Version
Interactive Discussion Atmos. Chem. Phys. Discuss., 10, 4543–4592, 2010
www.atmos-chem-phys-discuss.net/10/4543/2010/ © Author(s) 2010. This work is distributed under the Creative Commons Attribution 3.0 License.
Atmospheric Chemistry and Physics Discussions
This discussion paper is/has been under review for the journal Atmospheric Chemistry and Physics (ACP). Please refer to the corresponding final paper in ACP if available.
A global modeling study on
carbonaceous aerosol microphysical
characteristics and radiative forcing
S. E. Bauer1,2, S. Menon3, D. Koch1,2, T. C. Bond4, and K. Tsigaridis1
1
NASA Goddard Institute for Space Studies, New York, NY, USA
2
The Earth Institute, Columbia University, New York, NY, USA
3
Lawrence Berkeley National Laboratory, Berkeley, CA, USA
4
University of Illinois, Urbana-Champaign, IL, USA
Received: 20 January 2010 – Accepted: 8 February 2010 – Published: 15 February 2010
Correspondence to: S. E. Bauer ([email protected])
ACPD
10, 4543–4592, 2010Carbonaceous aerosol microphysics
S. E. Bauer et al.
Title Page
Abstract Introduction
Conclusions References
Tables Figures
◭ ◮
◭ ◮
Back Close
Full Screen / Esc
Printer-friendly Version
Interactive Discussion
Abstract
Recently, attention has been drawn towards black carbon aerosols as a short-term cli-mate warming mitigation candidate. However the global and regional impacts of the direct, cloud-indirect and semi-direct forcing effects are highly uncertain, due to the complex nature of aerosol evolution and the way that mixed, aged aerosols interact 5
with clouds and radiation. A detailed aerosol microphysical scheme, MATRIX, em-bedded within the GISS climate model is used in this study to present a quantitative assessment of the impact of microphysical processes involving black carbon, such as emission size distributions and optical properties on aerosol cloud activation and ra-diative forcing.
10
Our best estimate for net direct and indirect aerosol radiative forcing between 1750 and 2000 is−0.56 W/m2. However, the direct and indirect aerosol effects are quite
sen-sitive to the black and organic carbon size distribution and consequential mixing state. The net radiative forcing can vary between−0.32 to−0.75 W/m2depending on these
carbonaceous particle properties at emission. Assuming that sulfates, nitrates and 15
secondary organics form a coating around a black carbon core, rather than forming a uniformly mixed particle, changes the overall net aerosol radiative forcing from negative to positive. Taking into account internally mixed black carbon particles let us simulate correct aerosol absorption. Black carbon absorption is amplified by sulfate and nitrate coatings, but even more strongly by organic coatings. Black carbon mitigation scenar-20
ACPD
10, 4543–4592, 2010Carbonaceous aerosol microphysics
S. E. Bauer et al.
Title Page
Abstract Introduction
Conclusions References
Tables Figures
◭ ◮
◭ ◮
Back Close
Full Screen / Esc
Printer-friendly Version
Interactive Discussion
1 Introduction
Anthropogenic and natural aerosols impact the Earth’s radiation balance and thus exert a forcing on global climate. Black carbon (BC) has a positive radiative forcing, while other aerosol species mainly lead to atmospheric cooling. Therefore cleaning up most aerosol emissions, which is much needed due to their severe health impacts, could 5
strengthen the global warming trend. However, mitigation of BC has the potential to be beneficial in mitigating both climate warming and air pollution. Emission reductions that target light-absorbing aerosol might also reduce warming quickly (Hansen et al., 2000; Jacobson, 2002; Bond and Sun, 2005). However, BC’s indirect (cloud microphysics) and semi-direct contributions to net climate forcing remain an outstanding uncertainty. 10
For example, the model study of Penner et al. (2003) suggested that “smoke” did not produce net warming, considering both direct and cloud effects. In addition, model experimental results are very sensitive to treatment of aerosol microphysics.
The aerosol direct effect (ADE) is caused by absorption and scattering of solar ra-diation by liquid and solid aerosol particles in the atmosphere. Most absorbing, and 15
therefore enhancing climate warming, are black carbon (BC) particles. The mass ab-sorption strength and scattering ability of a BC particle strongly depends on the particle effective size and mixing state. Both of those quantities depend on the size and chem-ical composition of black carbon as it is released into the atmosphere as well as its microphysical and chemical evolution during transport through the atmosphere. Most 20
other aerosol species scatter radiation back to space, such as sulfate, nitrate, organic carbon (although some organics can be slightly absorbing), sea salt, aerosol water and to a certain extent mineral dust, and therefore these counterbalance climate warming, by cooling the atmosphere. However, if BC is mixed with these scattering components, the result is enhanced absorption. Laboratory studies by Khalizov et al. (2009) showed 25
ACPD
10, 4543–4592, 2010Carbonaceous aerosol microphysics
S. E. Bauer et al.
Title Page
Abstract Introduction
Conclusions References
Tables Figures
◭ ◮
◭ ◮
Back Close
Full Screen / Esc
Printer-friendly Version
Interactive Discussion to 0.5 after coating and humidification. Jacobson (2000) performed global simulations
with core-shell treatment and found BC forcings 50% higher and 40% lower than forc-ings obtained with externally mixed and well-internally mixed treatments, respectively. Therefore, correct treatment of the aerosol size and mixing state is crucial in order to calculate their net radiative forcing.
5
Attempts to quantify the aerosol direct radiative forcing (ADF), the difference in top of the atmosphere forcing between pre-industrial and present day conditions, by the Aero-Com initiative gave estimates between−0.41 and+0.04 W/m2(Schulz et al. 2006) and
by the IPCC AR4 report a range from−0.9 to−0.1 W/m2(IPCC, 1007). The wide range
of uncertainty is caused on the one hand by large discrepancies among the model sys-10
tems, ranging from emission strength, transport, aerosol transformation, removal and optical properties. However, the models are also poorly constrained by limited avail-ability of aerosol measurements. Furthermore, Myhre (2009) explains large deviations between models and satellite retrieved ADF estimates by the lack of considering cor-rect pre-industrial aerosol distributions in the satellite data derived forcing calculations 15
and in failure to sample the model like the retrieval.
The aerosol indirect effect (AIE) is caused by an increase in the number of hygro-scopic aerosols, with a corresponding increase in cloud droplet number concentrations, reduction in cloud droplet size, increase in cloud albedo (first indirect effect) and sup-pression of precipitation and increased cloud life time (second indirect effect), thereby 20
cooling the planet (IPCC, 2007). The role of BC in determining cloud droplet number concentrations (CDNC) is unknown (Adams and Seinfeld, 2003), as it depends upon the size distribution and mixing state of BC with soluble species such as sulfate, nitrate and organic carbon. Furthermore, insoluble black carbon or dust aerosols can act as ice nuclei and therefore alter cirrus and mixed-phase clouds; however these effects are 25
ACPD
10, 4543–4592, 2010Carbonaceous aerosol microphysics
S. E. Bauer et al.
Title Page
Abstract Introduction
Conclusions References
Tables Figures
◭ ◮
◭ ◮
Back Close
Full Screen / Esc
Printer-friendly Version
Interactive Discussion The AeroCom initiative, linking models to satellite-based estimates gives a range of
−0.7±0.5 W/m2for the AIF (Quaas et al., 2009). The models on which these estimates
were based generally did not include sophisticated treatment of aerosol mixing state, and the contribution of BC mixing to the AIF uncertainty was not evaluated.
In this study we are particularly interested in the microphysical evolution of black 5
carbon. The size and mixing state of carbonaceous particles at emission must be assumed for this investigation. Once emitted, BC can grow by coagulation and con-densation. Although freshly emitted pure BC is hydrophobic, inorganic and organic coatings will attract water and convert particles to be hygroscopic. Materials likely to condense on a BC particle, as on any other particle, are sulfate and nitrate precursors 10
as well as secondary organics (Riemer et al., 2009). Those particles are likely to form core – shell particles, where the insoluble BC fraction would form the core and the other species would enclose that core with a shell.
In addition to surface condensation processes, coagulation is a very effective mixing pathway. In the atmosphere every aerosol shape is unique, complex and not necessar-15
ily spherical. Transmission electron microscopy (TEM) images support the theory that BC particles become coated once emitted. Although BC may be internally mixed with other components, BC cannot be “well-mixed” (diluted) in the particle, since soot, which contains BC, is irregularly shaped and mostly solid. Thus most likely BC is distinct and not well mixed within particles.
20
As we explore the role of BC in aerosol forcing we will study the following questions: How important is the size distribution of carbonaceous particles at emission time (Sect. 3)? How sensitive are the forcings to mixing assumptions of BC particles (Sect. 4)? How well can we constrain our simulations with observational data (Sect. 5)? And how well can we assess BC reduction strategies given the previously discussed 25
microphysical modeling uncertainties (Sect. 6)?
ACPD
10, 4543–4592, 2010Carbonaceous aerosol microphysics
S. E. Bauer et al.
Title Page
Abstract Introduction
Conclusions References
Tables Figures
◭ ◮
◭ ◮
Back Close
Full Screen / Esc
Printer-friendly Version
Interactive Discussion of the performance of a new AIE scheme coupled to aerosol microphysics or to the
previous mass based GISS aerosol model (Koch et al., 2006; Menon and Rotstayn, 2006).
2 Model description
The Goddard Institute for Space Studies (GISS) General Circulation Model (GCM) cli-5
mate modelE (Hansen et al., 2005; Schmidt et al., 2006) coupled to the aerosol micro-physics and chemistry model MATRIX (Multiconfiguration Aerosol TRacker of mIXing state) (Bauer et al., 2008), hereafter BA08, is used in this study. MATRIX is designed to support model calculations of the direct and indirect effect and permit detailed treat-ment of aerosol mixing state, size and aerosol-cloud activation.
10
MATRIX is based on the quadrature methods of moments. For each aerosol pop-ulation, defined by mixing state and size distribution, the tracked species are number concentration, and mass concentration of sulfate, nitrate, ammonium, aerosol water, black carbon, organic carbon, mineral dust, and sea salt. Here we use the aerosol population setup called “mechanism 1” (BA08), given in Table 1. MATRIX dynam-15
ics includes nucleation, new particle formation, particle emissions, gas-particle mass transfer, aerosol phase chemistry, condensational growth, coagulation, and cloud ac-tivation. New additions to BA08 are linking the aerosol scheme to a recent aerosol indirect effect scheme that uses prognostic equations (Morrison and Gettelman, 2008) to calculate the cloud droplet number concentrations, as described in SM10. A further 20
addition to BA08 is the coupling of mixed aerosol populations to the radiation scheme as described below.
2.1 Aerosol radiation coupling
ACPD
10, 4543–4592, 2010Carbonaceous aerosol microphysics
S. E. Bauer et al.
Title Page
Abstract Introduction
Conclusions References
Tables Figures
◭ ◮
◭ ◮
Back Close
Full Screen / Esc
Printer-friendly Version
Interactive Discussion scribe the new coupling scheme for internally mixed aerosol populations. The GISS
model radiation scheme (Hansen et al., 1983) includes explicit multiple scattering cal-culations for solar radiation (shortwave – SW) and explicit integrations over both the SW and thermal (longwave – LW) spectral regions. Gaseous absorbers of LW ra-diation are H2O, CO2, O3, O2, and NO2. Size dependent scattering properties of 5
clouds and aerosols are computed from Mie scattering, ray tracing, and T-matrix the-ory (Mishchenko et al., 1996) to include non-spherical cirrus and dust particles. The k-distribution approach (Lacis and Oinas, 1991) utilizes 15 non-contiguous spectral intervals to model overlapping cloud aerosol and gaseous absorption.
The MATRIX module calculates the optical properties single scattering albedo, asym-10
metry factor and extinction for the 16 aerosol populations (see Table 1) for six wave-length bands in the SW and 33 bands in LW and passes those to the GISS radiation code. Each population can include multiple chemical species. Each aerosol popula-tion, as indicated in Table 1, is treated as an external mixture, a homogeneous internal mixture or a core-shell particle, depending on its chemical composition. If a particle 15
contains only one chemical species, for example a freshly emitted pure organic car-bon particle, then the optical properties are those of an externally mixed particle. In those cases MATRIX calculates the refractive index for each population and then uses Mie-code pre-calculated lookup tables in order to assign the corresponding optical pa-rameters. A homogeneous internal mixture is assumed to be a well-mixed particle, 20
most likely containing soluble species including aerosol water. MATRIX calculates the optical properties for those particles by using the volume mixing approach. Black car-bon containing particles can exist in various shapes. A pure BC particle is externally mixed (part of population BC1). BC coated by condensed sulfate, nitrate, organics and aerosol water can form a core-shell particle, where the insoluble BC forms the core and 25
ho-ACPD
10, 4543–4592, 2010Carbonaceous aerosol microphysics
S. E. Bauer et al.
Title Page
Abstract Introduction
Conclusions References
Tables Figures
◭ ◮
◭ ◮
Back Close
Full Screen / Esc
Printer-friendly Version
Interactive Discussion mogeneously mixed with the other species. The following refractive indices at 550 nm
are used in this study: Sulfate (1.528-1.e-7i), nitrate (1.528-1.e-7i), OC (1.527-0.014i), BC (1.85-0.71i), sea salt (1.45-0.i), dust (1.564-0.002i) and water (1.334-3.91e-8i).
Here, we did not perform special optical calculations for core-shell particles involv-ing mineral dust. This was not necessary as the potential shell thicknesses of such 5
particles would be too thin for them to optically make any significant impact (Bauer et al., 2007). Therefore the optical properties for the populations DD1, DS1, DD2 and DS2 are close to those of externally mixed mineral dust. However, this might not be true for the dust particles included in the mixed mode (MXX), as here mineral dust is mainly mixed with sea salt, and therefore mineral dust is not necessarily the dominat-10
ing species. Population MXX is treated as homogeneously internally mixed, due to the complicated mixing involving all eight components, dust, sea salt, sulfate, nitrate, ammonium, BC, OC, and water. In this study the base case simulation uses the vol-ume mixing approach for all internally mixed particles. The impact of BC-containing core-shell particles is discussed separately in Sect. 4.
15
2.2 Model configuration
Anthropogenic and natural emissions for present day and pre-industrial conditions are taken from the AeroCom project (Dentener et al., 2006 and http://dataipsl.ipsl.jussieu. fr/AEROCOM/). We use fluxes for “natural” emissions of dust, sea salt and dimethyl sulfide (DMS), and organic carbon (OC) assuming secondary organic aerosol as a 15% 20
yield from terpene emissions, and in addition, anthropogenic emissions from biomass burning and fossil and bio fuel burning of SO2, OC and BC. The inventory provides data for the year 2000 (present-day conditions) and for the year 1750 (pre-industrial conditions).
Model simulations for present day and pre-industrial conditions only differ by emis-25
ACPD
10, 4543–4592, 2010Carbonaceous aerosol microphysics
S. E. Bauer et al.
Title Page
Abstract Introduction
Conclusions References
Tables Figures
◭ ◮
◭ ◮
Back Close
Full Screen / Esc
Printer-friendly Version
Interactive Discussion emission runs. The model is employed on a horizontal resolution of 4◦×5◦ latitude by
longitude and 23 vertical layers. The model uses a 30 min time step for all physics calculations. Every model simulation is integrated for 5.5 years, and if not otherwise noted, five-year mean conditions are discussed in this paper.
We will discuss direct and indirect aerosol effects by looking at aerosol direct radia-5
tive impacts (ADE) and cloud radiative impacts (AIE) at present-day conditions. ADE is calculated by taking the difference between radiative transfer calculations at the top of the atmosphere with and without aerosols. AIE is calculated from changes to the net cloud forcing obtained from differences between total and clear skies for each call to the radiation excluding aerosols. Aerosol direct (ADF) and indirect radiative forcing 10
(AIF) is calculated as the difference in forcing between pre-industrial and present day conditions. AIF and AIE include indirect as well as semi-direct effects. Semi-direct ef-fects are cloud changes caused by changed vertical heating profiles in the atmosphere caused by aerosol forcing changes.
3 Effects of chosen particle size for emission
15
In order to calculate emission fluxes in microphysical aerosol models, the mass, num-ber concentration and the mixing state of those emissions need to be known. Infor-mation about size distributions is very important for particulate emission fluxes such as dust, sea salt and carbonaceous emissions. Usually some size information is pro-vided for dust and sea salt emissions, or interactively calculated in models, but not for 20
carbonaceous aerosols. Current emission inventories, such as Bond et al. (2004) or Cooke et al. (1999) provide only mass emission information, so that each modeler has to choose what sizes to assign for carbonaceous emission fluxes. Textor et al. (2006) summarized the sizes of the emitted particles as used by 16 different models that par-ticipated in the AeroCom study. Mass median diameter ranging from 0.02 to 0.85 µm 25
ACPD
10, 4543–4592, 2010Carbonaceous aerosol microphysics
S. E. Bauer et al.
Title Page
Abstract Introduction
Conclusions References
Tables Figures
◭ ◮
◭ ◮
Back Close
Full Screen / Esc
Printer-friendly Version
Interactive Discussion into several size bins. These choices differed greatly among the models; furthermore
there is very little information available about actual emission sizes. Bond et al. (2006, Table 3.) collected particle size distribution observations at combustion sources from the literature and reported mass median diameters of 0.038–0.32 µm for diesel vehi-cles, 0.02–1.5 µm for gasoline vehivehi-cles, 0.1–1.3 µm for small solid fuel combustors (ex-5
cluding coal briquettes), such as wood fireplaces or cooking stoves, and 0.05–0.78 µm for large stationary sources such as industrial boilers. However these sizes obtained close to emitters may not be appropriate for global model gridbox-scale initial particle sizes.
In order to understand the importance of emission size distribution of carbonaceous 10
particles, we performed a series of sensitivity studies where only the sizes of carbona-ceous emissions are varied. Note that those sizes are just the emission sizes, and that aged particle sizes are determined by the subsequent microphysical processes. In our simulations, carbonaceous aerosols grow by roughly a factor of three, through coagu-lation, condensation and water uptake. We assume that fossil and bio fuel BC and OC 15
emissions enter the atmosphere as external mixtures, entering population BC1 and OCC, and biomass burning emissions are internally mixed, entering population BOC in our model. However the model is rather insensitive towards this last assumption, as BC and OC from biomass burning sources coagulate very quickly even if emitted as external mixtures (not shown here).
20
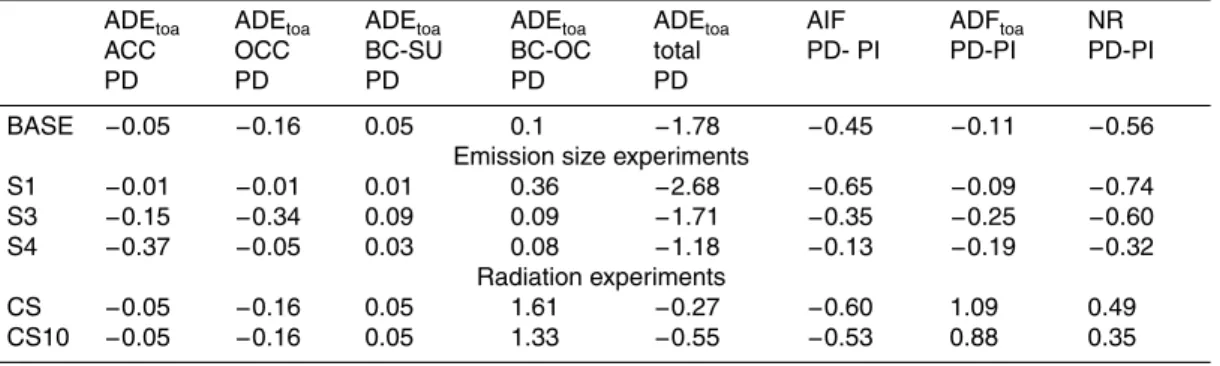
The geometric mean emission particle diameters chosen for the single experiments are reported in Table 2. Three sensitivity experiments are performed around the base case simulation (BASE), one experiment with smaller emission sizes (S1) and two experiments with larger emission sizes (S3, S4). The set of experiments covers ap-proximately the range of observed emission sizes.
25
ACPD
10, 4543–4592, 2010Carbonaceous aerosol microphysics
S. E. Bauer et al.
Title Page
Abstract Introduction
Conclusions References
Tables Figures
◭ ◮
◭ ◮
Back Close
Full Screen / Esc
Printer-friendly Version
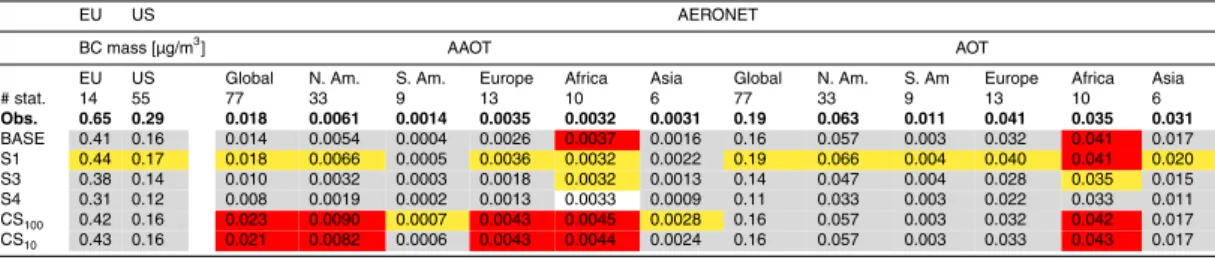
Interactive Discussion Smaller carbonaceous particles in experiment S1 impact the mixing state and size
dis-tribution in all of MATRIX’s populations. Size is the most important particle property affecting coagulation. The differences in sulfate, OC and BC mixing state between BASE and S1 (S1-BASE) are presented in Fig. 1 for present day conditions. Smaller initial OC/BC sizes lead to more coagulation between sulfate and BC. The sulfate co-5
agulation rate to form BCS (a BC-sulfate mixture) increases from 1087 (BASE) to 8655 (S1) Gg/a, leaving less externally mixed sulfate in the system (sulfate ACC and AKK loads decrease from 188 (BASE) to 41 Gg (S1)). Table 3 in BA08 may be consulted to put those budget numbers into perspective. Net sulfate condensation rates are rather similar between the experiments, but the particles on which surfaces condensation 10
happens changes. In BASE most H2SO4 condenses on ACC, OCC and BOC parti-cles and aqueous phase H2SO4 condensations within clouds favors ACC and BOC. In S1 most dry and wet condensation forms sulfates on BOC surfaces. Again lead-ing to more internally mixed particles, due to less condensation of H2SO4 on pure sulfate (ACC) particles. Changes in H2SO4 condensation rates also affect sulfate pri-15
mary particle production, and decreases sulfate nucleation rates (1800 Gg/a (BASE), 1168 Gg/a (S1)), hence changing the size distribution. BC (Fig. 1 row 2) itself favors coagulation with OC for S1, this however increases the sulfate ratio in the BCS popu-lation. So overall sulfate predominantly mixes with BC and BC mixes more with OC, leaving fewer externally mixed OC (OCC) in the atmosphere. Furthermore, the smaller 20
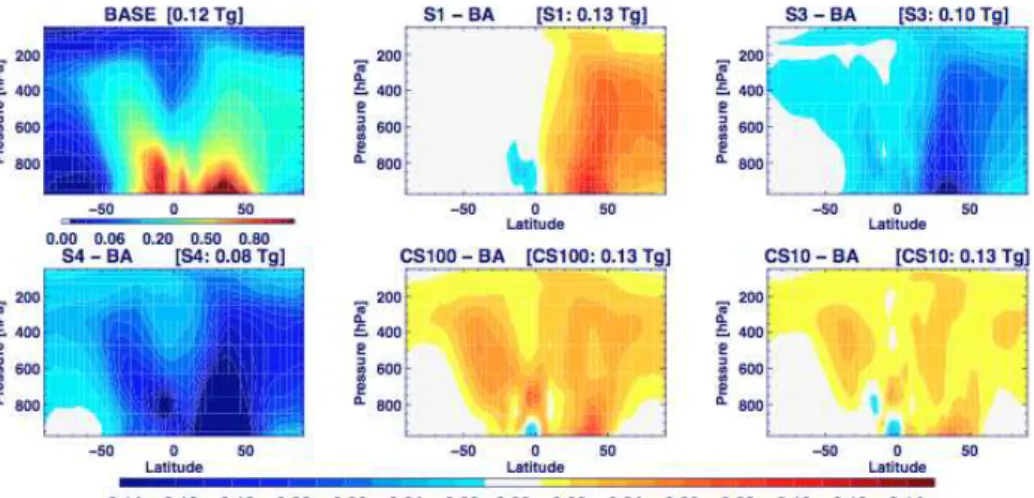
overall OC/BC size leads to more coagulation of OC and BC with coarse particles. Fig-ure 3 shows the zonal mean BC mass mixing concentrations, the sum over BC from all BC containing populations, of the BASE case and the differences between BASE and the size experiments S1, S3 and S4. The total BC mass increases from the BASE case 1195 Gg to 1287 Gg in S1, with all of the increase happening in the Northern 25
Hemisphere. This is caused by the extended lifetime of smaller pollution BC particles and the fact that smaller particles can be transported over larger distances.
ACPD
10, 4543–4592, 2010Carbonaceous aerosol microphysics
S. E. Bauer et al.
Title Page
Abstract Introduction
Conclusions References
Tables Figures
◭ ◮
◭ ◮
Back Close
Full Screen / Esc
Printer-friendly Version
Interactive Discussion areas. The aerosol direct effect shows a similar pattern but of opposite sign. ADE
increases over land, due to internal mixing of BC and therefore enhancing overall BC absorption, which leads to more warming due to BC particles. However the dominating feature here is the enhanced cooling effect over the oceans, which is caused by a strong contribution from the mixed population, MXX. The smaller particles in S1 lead 5
to overall more mixing. If all 7 species are mixed together, or none of the other 15 populations can be used, MXX is populated. However MXX is always representing a coarse mode as usually some sea salt or dust is present in MXX.
Changes in AIE depend on particle chemistry and number concentrations, and there-fore strongly on the size distribution, leading to different changes than seen in the mass 10
concentrations as shown in Fig. 1. Regionally the negative or cooling AIE (Fig. 3) is caused by the increased cloud droplet number concentration (CDNC) in those regions. Most important is the shift in size and mixing state. Particles are smaller, but still large enough to activate clouds, and more internally mixed in S1, leading to a larger number of cloud activating particles in polluted sulfate rich regions, but to regional decreases in 15
CDNCs in biomass burning, OC/BC rich regions. In the BASE case CDNCs in biomass burning regions are dominated by externally mixed OC, e.g. OCC, whereas in S1 more of OC is mixed with BOC leading to overall smaller number concentrations in biomass burning areas. Globally cloud-forcing increases over the oceans leading to a difference of−0.83 W/m2in AIE.
20
The second set of experiments, S3 and S4, tests the sensitivity of our model at larger BC/OC emission sizes. These experiments show many similarities towards each other, so that it is sufficient here to discuss the results of case S3. Larger initial OC/BC particles lead to less internal mixing of the aerosol populations, leaving more externally mixed sulfate and OC particles. Externally mixed sulfate increases from 188 Gg/a 25
ACPD
10, 4543–4592, 2010Carbonaceous aerosol microphysics
S. E. Bauer et al.
Title Page
Abstract Introduction
Conclusions References
Tables Figures
◭ ◮
◭ ◮
Back Close
Full Screen / Esc
Printer-friendly Version
Interactive Discussion translate into a reverse response for the aerosol optics (Fig. 3). AOT globally decreases
due to less extinction by the slightly larger and more externally mixed particles. The direct aerosol (ADE) effect relative to BASE is slightly positive, with more warming in dust regions. This is caused by less coagulation with the overall larger OC/BC/SU particles with dust, hence increasing dust lifetime in S4. The BC load (Fig. 2) is strongly 5
reduced in S3 to 1041 Gg and 822 Gg in S4.
CDNC particle concentrations are reduced by −15% (S3) and −20% (S4) leading
to a weakened indirect effect, the aerosol indirect effect is approximated from changes to net radiation at the TOA and therefore also includes semi-direct effects, by 3% (S3) and 4% (S4); however there was also an increase in liquid water path (LWP) (0.5% 10
(S3) and 0.8% (S4)) and increased cloud cover (1% (S3) and 0.3% (S4)).
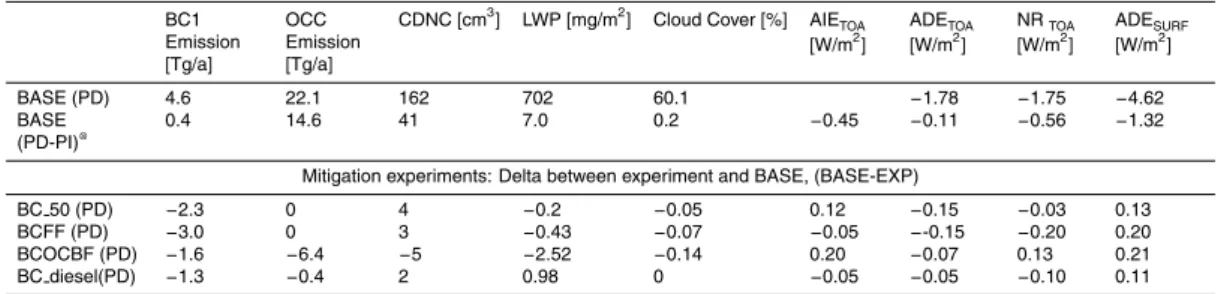
After discussing the complex interactions a simple summary (Fig. 4) can be given for the impact of carbonaceous aerosol emission sizes on radiative forcings: Smaller BC/OC emission sizes lead to larger, more negative direct and indirect aerosol forcings and larger BC/OC emission sizes to smaller forcings and therefore less aerosol cooling. 15
4 Particle mixing state and radiative transfer
Black carbons absorption depends strongly on its mixing state. It has been demon-strated in numerous publications (Fuller et al., 1999; Bond et al., 2006; Lesins et al., 2002; Jacobson, 2000) that when BC is treated solely as an external mixture, aerosol absorption can be underestimated by a factor of 1.5 to 4. We will not repeat these com-20
parison of external versus internal mixtures, because it is well established that most BC is internally mixed; instead we will test the differences between homogeneous internal mixtures and core-shell structured particle.
A large fraction of BC mass is mixed with other aerosol species, either at emission or during transport in the atmosphere. The solubility of the involved species and the 25
ACPD
10, 4543–4592, 2010Carbonaceous aerosol microphysics
S. E. Bauer et al.
Title Page
Abstract Introduction
Conclusions References
Tables Figures
◭ ◮
◭ ◮
Back Close
Full Screen / Esc
Printer-friendly Version
Interactive Discussion of particles. First, an externally mixed particle, e.g. a dry sulfate, BC, etc is a particle
without any coating or added components. Second, a homogeneously internally mixed particle consists of two or up to eight constituents, such as sulfate, nitrate, ammonium, OC, BC, sea salt, dust and water. In order to form a homogeneously internally mixed particle, all involved species need to be soluble. For example, we would assume that an 5
ammonium-sulfate aerosol that is coated by nitrate and OC and has taken up aerosol water could form a homogeneously mixed droplet. The third type of particle is made of an insoluble particle, such as BC, which is more likely to form a core-shell particle. The insoluble core is always assumed to be at the center of the particle, with either one species, or well-mixed multiple species in its shell.
10
Most aerosol models that treat internally mixed aerosol populations (Stier et al, 2005) use a volume mixing rule approach or use for example other mixing-based approaches like the Maxwell-Garnett (Garnett 1904, 1906) or Bruggeman (1935) mixing rule to calculate the optical properties of aerosols. In this study, we included core-shell model calculations, which should more accurately describe BC including particles (Kim et al., 15
2008).
In this section we will test the assumptions of homogenously internally mixed (HI) and core-shell (CS) structures of particles containing BC. The following experiments are tested:
– BASE (HI): The volume mixing approach is used for all internally mixed aerosols. 20
– CS100: BC coated by sulfate, nitrate, organics and water has a core – shell struc-ture, all other particles are either externally or homogeneously internally mixed (see Table 1).
– CS10: as CS100 but only 10% of the organics are considered for coating a BC particle. The remaining 90% will be considered homogeneously internally mixed. 25
ACPD
10, 4543–4592, 2010Carbonaceous aerosol microphysics
S. E. Bauer et al.
Title Page
Abstract Introduction
Conclusions References
Tables Figures
◭ ◮
◭ ◮
Back Close
Full Screen / Esc
Printer-friendly Version
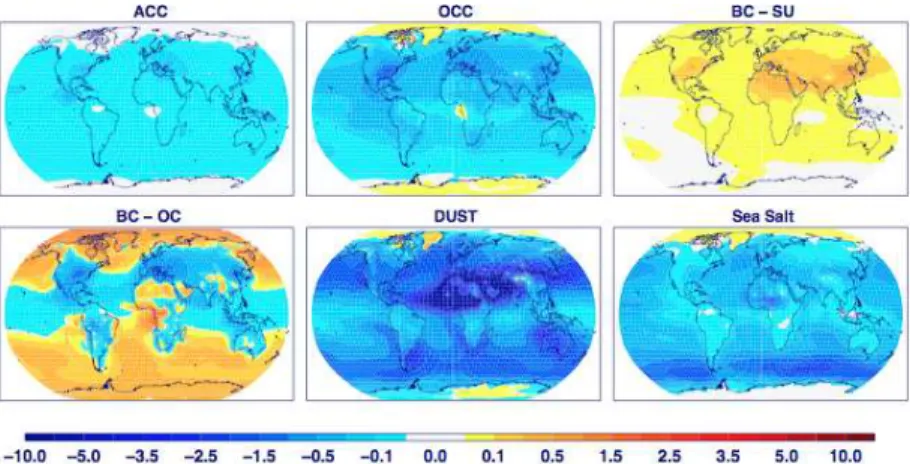
Interactive Discussion with contributions from externally mixed sulfates and nitrates −0.05 W/m2 (ACC),
or-ganics −0.16 W/m2, black carbon sulfate mixtures 0.05, BC-OC mixtures 0.1 W/m2,
mineral dust−1.35 W/m2and sea salt −0.4 W/m2. Note that sea salt and dust
forc-ing numbers are given for aerosols that mostly include sea-salt or dust, but still can be mixed with other species. Sulfate, nitrate, organic carbon, dust and sea salt lead 5
to cooling of the atmosphere; only over the poles a positive warming appears due to the strong surface reflection. BC – sulfate (BC-SU) mixtures have positive forcing, but BC-OC mixtures have positive or negative forcing depending on the dominant mixing component, OC or BC, in the aerosol particle.
In order to understand the radiative impacts of black carbon, we have to know its 10
mixing state. In BASE, the total global load of BC is 0.12 Tg, with roughly 75% of the BC mass in population BOC. Therefore, BC is mixed mostly with OC but also with sulfate and nitrate, and the remaining 25% is present in mixtures including sulfates and nitrates, such as population BCS, BC1, BC2 and BC3.
Figure 6 gives the fractions of BC, sulfate/nitrate, and OC (which is only included 15
in BOC) in populations BOC and BCS. The remaining fraction is taken up by aerosol water. Neglecting aerosol water, BC is the dominant component in population BCS, and that component has a positive radiative impact globally. The BOC population is dominated by OC and SU. BC mass contributes only 1% on a global average, and up to 10% in biomass burning areas. The mixing state greatly influences the radiative 20
impact. Small BC fractions in the aerosol mixture are sufficient to result in a positive forcing, so the BOC mixture can also have a positive impact for very small fractions of BC.
In simulation CS100and CS10only the optical properties of BC mixtures are changed. Therefore the radiative forcings of non-BC species remain mainly unchanged, however 25
ACPD
10, 4543–4592, 2010Carbonaceous aerosol microphysics
S. E. Bauer et al.
Title Page
Abstract Introduction
Conclusions References
Tables Figures
◭ ◮
◭ ◮
Back Close
Full Screen / Esc
Printer-friendly Version
Interactive Discussion only experiment CS10. Even coatings that result from only 10% of the available OC
mass are sufficient to change the optical properties between HI and CS significantly. First we will take a look at sulfate coatings. In the left column of Fig. 7 the absorption optical thickness for BCS particles are displayed. BCS absorption is higher in the core-shell case, CS10, in sulfate rich areas, and slightly lower in the biomass burning 5
areas. Globally BCS absorption is increased by a factor of 1.1. For BC particles that are mainly coated by non-absorbing materials like sulfate and nitrate, the HI or CS Mie calculations give fairly similar results.
The difference between BOC and BCS particles is that BOC particles can include OC in addition to sulfates, nitrates and water. OC is 10 times more abundant in the 10
atmosphere than BC, so it is not surprising that these particles have a much smaller BC fraction than BCS (Fig. 6). The combination of a very small BC fraction and a large fraction of slightly absorbing organics in the shell leads to a large difference in absorption between the HI and CS assumption. Figure 7 shows that AAOT is enhanced by a factor of 3.3 between BASE and CS10. However we were surprised to see such 15
a strong impact on aerosol absorption, especially as several studies (Lesins et al., 2002; Fuller et al., 1999) have demonstrated that absorption calculated for coated BC particles are higher when they were treated as HI mixtures. To understand this behavior we plotted the percentage difference between CS and HI Mie calculations (Fig. 8) for BC/OC mixtures (left) and BC/sulfate mixtures (right). Previous studies 20
(Fuller et al., 1999; Bond et al., 2006; Lesins et al., 2002; Jacobson, 2000), mainly looked at sulfate coated BC particles. For BC-sulfate mixtures and for most sizes and BC mixing fractions below 40% we also see stronger absorption for HI, and therefore agree with those studies. However this is different when BC is coated by OC, which is less scattering than sulfate and slightly absorbing itself.
25
ACPD
10, 4543–4592, 2010Carbonaceous aerosol microphysics
S. E. Bauer et al.
Title Page
Abstract Introduction
Conclusions References
Tables Figures
◭ ◮
◭ ◮
Back Close
Full Screen / Esc
Printer-friendly Version
Interactive Discussion would be positive.
The strong forcing of coated BOC particles raises the question on how realistic this scenario could be. We suspect that in the real atmosphere such small BC fractions within a particle might be unrealistic. If the core is much smaller than the shell, the lo-cation of the core within the particle matters. The Toon and Ackerman model assumes 5
the core to be in the center of the particle, and therefore strongly enhances absorption, this enhancement would be much reduced, when the core is not in the center. The smaller the core is relative to the particle, the less likely it is to be exactly in the center. The high enhancements occur only when the particle is perfectly concentric (Fuller, 1995, 1999).
10
Before we can draw any conclusions about the core – shell simulations we need to evaluate the simulated mixing state. We assume that we model unrealistically low BC fractions in the BOC populations and therefore will explore this problem in our ongoing work.
5 Observational constraints
15
The experiments performed in this study show large sensitivities of the overall aerosol simulations to the chosen carbonaceous emission sizes and towards optical particle mixing configuration assumptions. In this section the results of sensitivity experi-ments are compared to observational datasets, including BC mass measureexperi-ments and AERONET (Holben et al., 1998) products.
20
Table 4 compares the model with the averaged surface BC mass concentrations of the European EMEP (2002–2003) and the North American IMPROVE (1995–2001) network. The base model underestimates European BC concentrations by a factor of 1.6. Decreasing BC emission sizes (S1) improves the simulation, but surface BC concentrations in Europe are still too low by a factor of 1.5. The model also under-25
ACPD
10, 4543–4592, 2010Carbonaceous aerosol microphysics
S. E. Bauer et al.
Title Page
Abstract Introduction
Conclusions References
Tables Figures
◭ ◮
◭ ◮
Back Close
Full Screen / Esc
Printer-friendly Version
Interactive Discussion network includes mainly rural stations and therefore can better be simulated by coarse
models, whereas the EMEP network includes more urban stations, that observe more detailed sub-grid scale features. Comparing surface observations in polluted regions to a coarse 4◦×5◦ model is questionable, but we can conclude that the model
under-estimates North American and European surface concentrations. The S1 experiment 5
leads to increased and therefore slightly improved surface concentrations in those re-gions.
Comparisons between surface concentrations, particularly in regions distant from sources, raise the question of how the BC is distributed vertically. Figure 2 already demonstrated the large variable of BC loads among the single experiments. The 10
causes for the large diversity in aerosol load are the differences in aerosol mixing state, solubility and size distributions, which impacts BC lifetime through wet and dry removal changes and transport. Recent aircraft measurements provide BC profile measure-ments with Single Particle Soot absorption Photometers (SP2) onboard NASA and NOAA research aircrafts (Schwartz et al., 2006; Slowik et al., 2007). In this paper 15
we used the same campaign data and averaging technique as in Koch et al. (2009). Figure 9 shows profiles measured in North American mid-latitude regions (a, d), in the tropics (b, c) and at high latitudes (e–i). The base model simulation generally agrees better with some observed profiles in the mid- and high-latitude regions, overestimates BC concentrations in the tropics and underestimates BC concentrations in some cases 20
at high latitudes. The sensitivity experiments show a rather uniform response globally. Smaller particle size BC/OC emissions (exp. S1) increases the overall BC mass in the troposphere while larger particles (S3, S4) leads to a decrease. However, no simula-tion significantly improves the vertical distribusimula-tion of BC mass concentrasimula-tions, as we already get over and underestimations of BC mass concentrations in different latitude 25
ACPD
10, 4543–4592, 2010Carbonaceous aerosol microphysics
S. E. Bauer et al.
Title Page
Abstract Introduction
Conclusions References
Tables Figures
◭ ◮
◭ ◮
Back Close
Full Screen / Esc
Printer-friendly Version
Interactive Discussion
– The model overestimates upper-level BC in regions near sources, while surface concentrations in those regions look reasonable.
– The model usually, but not always, underestimates surface BC in the Arctic.
– The model always fails to reproduce the measured discontinuity (or rapid change) in the vertical distribution in the Arctic.
5
– Finally, the changes in microphysics do not affect the smoothness of the vertical profile, so microphysics does not explain the model’s failure to reproduce the ob-served sharp discontinuities, however we have to keep in mind that we compare observed snap shots to modeled average mean conditions.
AERONET (Dubovik et al., 2002) observations provide column amounts and absorp-10
tion of aerosols. These are seasonally averaged for the year 2000. We use the aerosol optical thickness (AOT), which is the most reliable measurement from this network, and the absorption AOT (AAOT), the non-scattering part of the aerosol optical thickness, which involves a higher degree of uncertainty at low AOT conditions.
Figures 10 and 11 show the seasonal comparison between the AERONET data and 15
the base model simulations. The simulation of AOT shows a good seasonal compari-son with AERONET. Many seacompari-sonal and regional features are well captured. Modeled AOT is underestimated in some megacities, including some European sites and in South America. Table 4. Presents the global as well as regional comparisons of AOT and AAOT. AOT is best simulated in S1. With larger BC/OC emission sizes, BASE, S3 20
and S4 AOT gets further underestimated. The core-shell experiments CS100and CS10 show similar AOT values compared to BASE.
S1 shows as well the best simulation of AAOT. Modeled AAOT values are systemati-cally too low in South America and Asia in all experiments. However, AOT was already too low in South America and Asia and therefore the AAOT values cannot be evaluated 25
ACPD
10, 4543–4592, 2010Carbonaceous aerosol microphysics
S. E. Bauer et al.
Title Page
Abstract Introduction
Conclusions References
Tables Figures
◭ ◮
◭ ◮
Back Close
Full Screen / Esc
Printer-friendly Version
Interactive Discussion The model simulates AOT and AAOT in the strongly dust influenced regions of Africa
and the Arabian Peninsula best in experiments S3, and absorption is too strong in experiments CS100and CS10.
In summary, BC surface concentrations are systematically underestimated in Europe and the US, but the vertical distribution over the North American continent do not show 5
a systematic bias. Aerosol optical measures, such as AOT and AAOT, are fairly well simulated, and improve with the assumption of smaller BC particles, which results in larger BC loads and more internal mixing. Larger BC particles (experiments S3 and S4) or extremely strong absorption due to BC (CS100, CS10) worsen the simulation. Mineral dust is an important absorber and also impacts the comparisons in this study, 10
but we have not carefully examined these effects here.
6 Black carbon reduction experiments
Recently, attention has been drawn towards black carbon aerosols as a short-term climate warming mitigation candidate. Although the BC direct effect is definitely warm-ing, there remains high uncertainty in estimates of indirect (cloud) changes associated 15
with reductions, due to the complex nature of aerosol evolution and its climate interac-tions. Furthermore, BC emission reductions must be achieved by controlling individual sources. Therefore co-emitted, cooling species would be reduced as well. Here we conduct two idealized experiments where we simply reduce BC emissions from fossil and biofuel burning by 50% (BC 50), and a scenario where BC fossil fuel emissions 20
are reduced by 100% (BC BCFF). Because OC is not reduced, these experiments evaluate the net effect of BC but not of individual sources.
We also test two more realistic cases where both OC and BC from biofuel sources are reduced by 50% (BCOCBF), and a scenario where BC and OC emissions from on-road and off-road diesel were removed (BC diesel). Particles emitted from diesel 25
ACPD
10, 4543–4592, 2010Carbonaceous aerosol microphysics
S. E. Bauer et al.
Title Page
Abstract Introduction
Conclusions References
Tables Figures
◭ ◮
◭ ◮
Back Close
Full Screen / Esc
Printer-friendly Version
Interactive Discussion strategy that reduces diesel emissions, although it does not account for reductions in
sulfur emissions which would be required to implement advanced controls. On the other hand, biofuel sources have different OC:BC ratios, ranging from 3:1 or 4:1 for wood cooking stoves to 6:1 for fireplaces or cooking with animal waste. The average OC:BC reduction of 5.6:1 in the BCOCBF case provides an estimate of the response 5
to reductions in high-OC sources, but may not exactly reflect the impact of individual sources. See Table 5 for emission budgets.
The BC reduction experiments are performed under present day conditions and are compared to PD to PI changes of the BASE experiment. In addition to the fuel emis-sions, biomass burning emissions for PD runs are 3 Tg/a BC and 24.8 Tg/a OC. Note 10
that also the non-biomass burning OC emissions levels are reduced in experiment BCOCBF and BC diesel. The results of all BC reduction experiments are summarized in Table 5 and Fig. 12. In all experiments reducing BC emissions leads to less pos-itive direct aerosol impacts (ADE), with changes ranging from −0.05 to −0.15 W/m2.
BC 50 and BCFF show very similar results for ADE, whereas BCOCBF and BC diesel 15
show much weaker effects. This is caused in the diesel case by smaller BC emis-sion changes as well by a slight decrease in OC emisemis-sions. In the BCOCBF case some of the negative forcing change that is achieved by the BC emission reduction is counterbalanced by the positive forcing change caused by the reduced co-emitted OC emissions. In both cases the reduced OC emissions over Europe and the US lead to 20
reduced (BC diesel) or reversed (BCOCBF) BC mitigation effects, less positive forcing, in those regions, whereas in Asia and the high latitudes both measures would weaken the positive direct aerosol forcing.
Table 5 and Fig. 12 also give changes in cloud diagnostics. Reducing BC emissions leads to a slight increase in CDNCs in all experiments, except BCOCBF. Changes to 25
ACPD
10, 4543–4592, 2010Carbonaceous aerosol microphysics
S. E. Bauer et al.
Title Page
Abstract Introduction
Conclusions References
Tables Figures
◭ ◮
◭ ◮
Back Close
Full Screen / Esc
Printer-friendly Version
Interactive Discussion First we will discuss the experiments which resulted in reduced CDNCs: BC 50,
BCFF, and BC diesel. Regionally, for example over Europe where the strongest change in CDNCs occurs, more CDNCs lead to an increase in cloud cover and therefore to a negative cloud forcing. However, globally, even though there are more CDNCs, there is reduction in cloud cover and positive and negative AIEs ranging from 0.11 5
to−0.05 W/m2 per experiment. These cloud cover changes are caused by a compe-tition between indirect and semi-direct effects. Figure 12 shows the surface forcing changes in the single experiments. Reduced BC loads lead to surface heating, due to the missing absorbers in the atmosphere. More radiation can reach and warm the Earth surface, heat the lower atmosphere and lead to a decrease of low-cloud cover 10
and LWP, leading to a positive cloud radiative forcing. These semi-direct effect cloud changes dominate over the smaller cloud changes that result from CDNC enhance-ment.
Case BCOCBF, where BC as well as OC emissions are reduced, shows a decrease of−5% in CDNCs. Less CDNCs, leads to reduced LWP and cloud cover and therefore
15
logically to a smaller (less negative) overall cloud forcing, resulting in a cloud radiative impact (AIE) change of 0.2 W/m2compared to the BASE case.
In Summary:
– Reducing BC emissions by 50% (BC 50) compared to the BASE case leads glob-ally to increased CDNC, decreased cloud cover and LWP and a positive AIE 20
change of+0.12 W/m2. Together with the direct aerosol impact of−0.15 W/m2this leads to net forcing difference of−0.03 W/m2. In principle we would expect a
neg-ative AIE with increased CDNCs. However we see a negneg-ative AIE (Fig. 12) in the regions with increased CDNCs, e.g. Europe, South East Asia, Easter US, how-ever the global mean AIE is positive due to positive AIE contributions from remote 25
ACPD
10, 4543–4592, 2010Carbonaceous aerosol microphysics
S. E. Bauer et al.
Title Page
Abstract Introduction
Conclusions References
Tables Figures
◭ ◮
◭ ◮
Back Close
Full Screen / Esc
Printer-friendly Version
Interactive Discussion
– Removing fossil fuel emissions (BC FF) leads as well to an increase in CDNC, decreased cloud cover but an allover negative AIE of−0.05 W/m2. Together with
the direct aerosol impact of −0.15 W/m2 this leads to net forcing difference of
−0.2 W/m2.
– Removing diesel emissions (BC diesel) still leads to globally increased CDNCs 5
but to a lesser extend than the above discussed cases. India and South East Asia show a decrease in CDNC. Allover this leads to a strong negative AIE over Europe and a global mean cloud forcing of−0.05 W/m2. Combined with a negative ADE
this results in a net forcing difference of−0.1 W/m2.
– Reducing biofuel sources (BCOCBF) is the only scenario where we see de-10
creased CDNC concentrations. The strong reduction in BC and especially OC particles finally resulted in a reduced number concentration of activated particles, which was not the case in the prior discussed scenarios. Eventually this leads to an positive AIE+0.2 W/m2and a net radiative change of+0.13 W/m2.
These model experiments show that the success of BC mitigation in reducing warming 15
depends on the combination of direct and indirect effects, and the resulting change in the net radiative forcing. As a reference, our BASE model estimates a net forcing of
−0.56 W/m2 for PD–PI. Our simple BC mitigation scenarios which ignore co-emitted
species, BC 50 and BCFF, show an increase in aerosol cooling and therefore reduce global warming by−0.03 and−0.2 W/m2. The two more “realistic” scenarios, BCOCBF
20
and BC diesel, show that eliminating diesel emissions will also slow global warming by
ACPD
10, 4543–4592, 2010Carbonaceous aerosol microphysics
S. E. Bauer et al.
Title Page
Abstract Introduction
Conclusions References
Tables Figures
◭ ◮
◭ ◮
Back Close
Full Screen / Esc
Printer-friendly Version
Interactive Discussion
7 Discussion and conclusions
In this paper we studied the sensitivity of BC effects on climate forcings with a climate model that includes detailed microphysical processes. Since BA08, MATRIX internally and externally mixed aerosol populations are now coupled to the radiation scheme and to cloud indirect effects (SM10). We examined single processes and particle properties 5
and their impacts on cloud and aerosol forcings. This study allows us to evaluate which processes need to be further studied, and what observational data are needed.
First we discussed the importance of initial size distributions for particulate emissions such as BC and OC. Evaluating the model with ambient BC mass and AERONET AOT and AAOT measurements leads to the conclusion that best results are seen when 10
BC/OC emission sizes are assumed to be between 0.01 and 0.05 µm. Aerosol mi-crophysical models such as MATRIX now require particulate emission inventories that include information about aerosol mass, number, surface area, composition, and mix-ing state, and possibly includmix-ing subgrid scale effects, such as source-plume mixing, that can not be treated by current climate models.
15
Koch et al. (2009) showed that the previous generation of aerosol models without aerosol microphysics and mixing state influencing optical properties generally under-estimate AAOT. In contrast, this study demonstrated a greatly improved agreement with retrieved AAOT, as the internal mixing of BC enhances absorption. On the other hand, Koch et al. (2009) found that these older models generally did not underestimate BC 20
surface concentration; the rapid BC aging of the microphysical scheme in our model caused faster washout near source regions and consequent underestimation of BC surface concentrations. Thus it seems that the microphysics required to improve BC optical properties has excessively reduced model BC surface concentrations. Careful examination of regional tendencies may help resolve the new discrepancy.
25
We found extremely large differences in aerosol radiative forcing amounts, −0.56
ACPD
10, 4543–4592, 2010Carbonaceous aerosol microphysics
S. E. Bauer et al.
Title Page
Abstract Introduction
Conclusions References
Tables Figures
◭ ◮
◭ ◮
Back Close
Full Screen / Esc
Printer-friendly Version
Interactive Discussion mixed OC forms a shell structure around BC, the net anthropogenic aerosol forcing
would be positive. Simply assuming volume mixing rules for internally mixed particles is physically not realistic, but we found that for mainly sulfate coated BC particles the calculations using a simple volume mixing treatment are approximately equal to the more complex core-shell calculations. However, we found large differences between 5
assuming homogeneously mixed or core-shell configuration, when OC formed a large coating around a very small BC particle. Absorption can be amplified by a factor of 3 when BC cores take up only 1% or less of the particle volume. In our model this is typically the case in the BC-OC population we simulate. However this is physically un-realistic and comparison to AeroNet absorption optical depth showed that this extreme 10
simulation overestimates absorption. However in order to better understand this behav-ior we will need to better evaluate the aerosol mixing state simulated by our model. The largest volume fraction is taken up by aerosol water, a quantity that is hardly validated in aerosol models. Chemical and morphological analysis of different individual parti-cles is needed, along with size selective bulk analysis, to understand such processes, 15
taking into account aerosol microphysical processes.
One possible approach to observe mixing state including BC coating estimates was discussed by Shiraiwa et al. (2008), where the mixing state of BC in Asian air masses was examined by a combination of aerosol mass spectroscopy (AMS) and single-particle soot photometer SP2 data. The AMS data provide a detailed chemical analysis 20
of the measured species, and the SP2 was able to measure the size distribution, and the mixing state of BC. Shiraiwa et al. (2008) found a median value of the shell/core diameter ratio increased to 1.6 in Asian continental and maritime air masses with a core diameter of 200 nm, while in free tropospheric and in Japanese air masses it was 1.3–1.4. It was estimated that internal mixing enhanced the BC absorption by a factor 25
ACPD
10, 4543–4592, 2010Carbonaceous aerosol microphysics
S. E. Bauer et al.
Title Page
Abstract Introduction
Conclusions References
Tables Figures
◭ ◮
◭ ◮
Back Close
Full Screen / Esc
Printer-friendly Version
Interactive Discussion data. Our ongoing research will focus on the validation of mixing state with these newly
emerging datasets.
In light of the analysed model sensitivities towards microphysical BC characteriza-tion, we performed a set of BC mitigation studies. The model suggests that BC mitiga-tion is always beneficial if only BC sources are reduced, as the direct radiative forcing 5
is lowered, and the effects on clouds are weak. BC mitigation led to enhanced CDNC production and a slightly stronger indirect effect; this finding is in contrast to assump-tions about reducing primary particle concentraassump-tions. However, semi-direct effects, induced by changed vertical heating profiles in the atmosphere, as well as the first and second indirect effect, are very important components of the response to altered BC 10
emissions. The two more ‘realistic’ scenarios which include reduction of OC show that mitigating diesel emissions will slow global warming by−0.1 W/m2, whereas reducing biofuel sources could even accelerate global warming, mainly due to the impacts on clouds.
This study did not include ice cloud feedbacks or BC-snow ice albedo feedbacks 15
(Koch et al., 2009) that may enhance warming by BC. Despite the various limitations explored in this study regarding emission sizes and mixing state of BC particles, our model results suggest that a reduction in BC diesel emissions would help reduce pos-itive forcing even when including cloud changes. However, we stress that strategies that include a reduction in BC emissions should not delay any GHG reduction plans, 20
as the likely reductions in positive forcing from BC emissions are small und uncertain (from+0.12 up to−0.19 W/m2) compared to GHG forcings of 2.7 W/m2 and growing. Furthermore, BC reductions also reduce co-emitted species, many of which have neg-ative forcings, such as OC and sulfate. For sources sufficiently rich in black carbon, mitigation is beneficial, but aerosol microphysical processes and their interactions with 25
ACPD
10, 4543–4592, 2010Carbonaceous aerosol microphysics
S. E. Bauer et al.
Title Page
Abstract Introduction
Conclusions References
Tables Figures
◭ ◮
◭ ◮
Back Close
Full Screen / Esc
Printer-friendly Version
Interactive Discussion
Acknowledgements. This work has been supported by the NASA MAP program Model-ing, Analysis and Prediction Climate Variability and Change (NN-H-04-Z-YS-008-N) and (NNH08ZDA001N-MAP). KT was supported by an appointment to the NASA Postdoctoral Program at the Goddard Institute for Space Studies, administered by Oak Ridge Associated Universities through a contract with NASA. We thank Andy Lacis for never getting tired of
ex-5
plaining the GISS radiation code to us, and Jessica Sagona for her work with the AERONET data sets. We acknowledge AERONET data, available at http://aeronet/gsfc.nasa.gov; IM-PROVE data available from http://vista.cira.colostate.edu/IMIM-PROVE; and EMEP data from http://tarantula.nilu.no/projects/ccc. We are acknowledging the aircraft measurements made available to us by groups at NOAA: David Fahey, Ru-shan Gao, Joshua Schwarz, Ryan
Spack-10
man, Laurel Watts; University of Tokyo: Yutaka Kondo, Nobuhiro Moteki; and University of Hawaii: Antony Clarke, Cameron McNaughton, Steffen Freitag.
References
Ackerman, A. S., Toon, O. B., Stevens, D. E., Heymsfield, A. J., Ramanathan, V., and Welton, E. J.: Reduction of tropical cloudiness by soot, Science, 288, 1042–1047,
15
doi:10.1126/science.288.5468.1042, 2000.
Adams, P. J., and J. H. Seinfeld, Disproportionate impact of particulate emissions on global cloud condensation nuclei concentrations, Geophys. Res. Lett., 30(5), 1239, doi:10.1029/2002GL016303, 2003.
Bauer, S. E., Wright, D., Koch, D., Lewis, E., McGraw, R., Chang, L.-S., Schwartz, S., and
20
Ruedy, R.: Matrix (multiconfiguration aerosol tracker of mixing state): An aerosol microphys-ical module for global atmospheric models, Atmos. Chem. Phys., 8, 6603–6035, 2008, http://www.atmos-chem-phys.net/8/6603/2008/.
Bauer, S. E.,. Mishchenko, M. I., Lacis, A. A., Zhang, S., Perlwitz, J., and Metzger, S. M.: Do sulfate and nitrate coatings on mineral dust have important effects on radiative properties
25
and climate modeling? J. Geophys. Res., 112, D06307, doi:10.1029/2005JD006977, 2007. Bond, T., Streets, D., Yarber, K., Nelson, S., Wo, J.-H., and Klimont, Z.: A technology-based
ACPD
10, 4543–4592, 2010Carbonaceous aerosol microphysics
S. E. Bauer et al.
Title Page
Abstract Introduction
Conclusions References
Tables Figures
◭ ◮
◭ ◮
Back Close
Full Screen / Esc
Printer-friendly Version
Interactive Discussion
Bond, T. C. and Bergstrom, R. W.: Light absorption by carbonaceous particles: An investigative review, Aerosol Sci. Technol., 40, 27–67, 2006.
Bond, T. C. and Sun, H.: Can reducing black carbon emissions counteract global warming?, Environ. Sci. Tech., 39, 5921–5926, 2005.
Boucher, O., Moulin, C., Belviso, S., Aumont, O., Bopp, L., Cosme, E., von Kuhlmann, R.,
5
Lawrence, M. G., Pham, M., Reddy, M. S., Sciare, J., and Venkataraman, C.: DMS atmo-spheric concentrations and sulphate aerosol indirect radiative forcing: a sensitivity study to the DMS source representation and oxidation, Atmos. Chem. Phys., 3, 49–65, 2003, http://www.atmos-chem-phys.net/3/49/2003/.
Bruggeman, D.: Calculation of various physics constants in heterogenous substances i
dielec-10
tricity constants and conductivity of mixed bodies from isotropic substances, Annalen der Physik, 24, 636–664, 1935.
Clarke, A. D., McNaughton, C., Kapustin, V. N., Shinozuka, Y., Howell, S., Dibb, J., Zhou, J., Anderson, B., Brekhovskikh, V., Turner, H., and Pinkerton, M.: Biomass burning and pollution aerosol over North America: Organic components and their influence on
15
spectral optical properties and humidification response, J. Geophys. Res., 112, D12S18, doi:10.1029/2006JD007777, 2007.
Cooke, W. F., Liousse, C., Cachier, H., and Feichter, J.: Construction of a 1x1 fossil fuel emission data set for carbonaceous aerosol and implementation and radiative impact in the ECHAM4 model, J. Geophys. Res., 104, 22137–22162, 1999.
20
Dentener, F., Kinne, S., Bond, T., Boucher, O., Cofala, J., Generos, S., Ginoux, P., Gong, S., Hoelzemann, J. J., Ito, A., Marelli, L., Penner, J., Putaud, J.-P., Textor, C., Schulz, M., v. d. Werf, G. R., and Wilson, J.: Emissions of primary aerosol and precursor gases for the years 2000 and 1750 prescribed data-sets for AeroCom, Atmos. Chem. Phys., 6, 4321–4344, 2006, http://www.atmos-chem-phys.net/6/4321/2006/.
25
Dubovik, O., Holben, B., Eck, T. F., Smirnov, A., Kaufman, Y., King, M. D., Tanre, D., and Slutsker, I.: Variability of absorption and optical properties of key aerosol types observed in worldwide locations, J. Atmos. Sci., 59, 590–608, 2002.
Fuller, K. A., Malm, W. C., and Kreidenweis, S. M.: Effects of Mixing on Extinction By Carbona-ceous Particles, J. Geophys. Res., 104(D13), 15941–15954, 1999.
30
Garnett, J.: Colours in metal glasses and in metallic films, Philos. Trans. R. Soc. London, 203, 385–420, 1904.
ACPD
10, 4543–4592, 2010Carbonaceous aerosol microphysics
S. E. Bauer et al.
Title Page
Abstract Introduction
Conclusions References
Tables Figures
◭ ◮
◭ ◮
Back Close
Full Screen / Esc
Printer-friendly Version
Interactive Discussion
Philos. Trans. R. Soc. London, 205, 237–288, 1906.
Gong, S. L.: A parameterization of sea-salt aerosol source function for sub- and super-micron particles, Global Biogeochemical Cycles, 17(4), 1097, doi:1029/2003GB002079, 2003. Hansen, J. E., Russell, G. L., Rind, D., Stone, P., Lacis, A., Ruedy, R., and Travis, L.: Efficient
three-dimensional models for climatic studies, Mon. Weather Rev., 111, 609–662, 1983.
5
Hansen, J., Sato, M., and Ruedy, R.: Radiative forcing and climate response, J. Geophys. Res., 102, 6831–6864, doi:10.1029/96JD03436, 1997.
Hansen, J., Sato, M., Ruedy, R., Nazarenko, L., Lacis, A., Schmidt, G., Russell, G., Aleinov, I., Bauer, M., Bauer, S., Bell, N., Cairns, B., Canuto, V., Cheng, Y., Genio, A. D., Faluvegi, G., Fleming, E., Friend, A., Hall, T., Jackman, C., Kelley, M., Kiang, N., Koch, D., Lean,
10
J., Lerner, J., Lo, K., Menon, S., Miller, R., Minnis, P., Novakov, T., Oinas, V., Perlwitz, J., Perlwitz, J., Rind, D., Romanou, D., Shindell, D., Stone, P., Sun, S., Tausnev, N., Thresher, D., Wielicki, B., Wong, T., Yao, M., and Zhang, S.: Efficacy of climate forcing, J. Geophys. Res, 110, D18104, doi:10.1029/2005JD005776, 2005.
Hansen, J., Sato, M., Ruedy, R., Lacis, A., and Oinas, V.: Global warming in the
15
twenty-first century: An alternative scenario. Proc. Natl. Acad. Sci., 97, 9875–9880, doi:10.1073/pnas.170278997, 2000.
Hearn, J. D. and Smith, G. D.: A chemical ionization mass spectrometry method for the online analysis of organic aerosols, Anal. Chem., 76(10), 2820–2826, 2004.
Holben, B. N., Eck, T. F., Slutsker, I., Tanre, D., Buis, J. P., Setzer, A., Vermote, E., Reagan, J.
20
A., Kaufman, Y. J., Nakajima, T., Lavenu, F., Jankowiak, I., and Smirnov, A.: AERONET—A federated instrument network and data archive for aerosol characterization, Remote Sens. Environ., 66, 1–16, 1998.
Howell, S. G., Clarke, A. D., Shinozuka, Y., Kapustin, V. N., McNaughton, C. S., Huebert, B. J., Doherty, S., and Anderson, T.: The Influence of relative humidity upon pollution and dust
25
during ACE-Asia: size distributions and implications for optical properties, J. Geophys. Res., 111 D06205, doi:10.1029/2004JD005759, 2006.
Intergovernmental Panel on Climate Change (IPCC) Fourth Assessment Report, Climate Change 2007 Synthesis Report, Contribution of Working Groups I, II and III to the Fourth Assessment Report of the Intergovernmental Panel on Climate Change, 2007.
30
Jacobson, M. Z.: A physically-based treatment of elemental carbon optics: Implications for global direct forcing of aerosols, Geophys. Res. Lett., 27, 217–220, 2000.
possi-ACPD
10, 4543–4592, 2010Carbonaceous aerosol microphysics
S. E. Bauer et al.
Title Page
Abstract Introduction
Conclusions References
Tables Figures
◭ ◮
◭ ◮
Back Close
Full Screen / Esc
Printer-friendly Version
Interactive Discussion
bly the most effective method of slowing global warming, J. Geophys. Res., 107(D19), doi:10.1029/2001JD001376, 2002.
Khalizov A. F., Xue, H., Wang, L., Zheng, J., and Zhang, R.: Enhanced light absorption and scattering by carbon soot aerosol internally mixed with sulfuric acid, J. Phys. Chem., 113, 1066–1074, 2009.
5
Kim, D., Wang, C., Ekman, A. M. L., Barth, M. C., and Rasch, P. J.: Distribution and direct ra-diative forcing of carbonaceous and sulfate aerosols in an interactive size-resolving aerosol-climate model, J. Goephys. Res, 113, D16309, doi:10.1029/2007JD009756, 2008.
Koch, D., Schmidt, G. A., and Field, C. V.: Sulfur, sea salt and radionuclide aerosols in GISS ModelE, J. Geophys. Res., 111, D06206, doi:10.1029/2004JD005550, 2006.
10
Koch, D., Schulz, M., Kinne, S., McNaughton, C., Spackman, J. R., Balkanski, Y., Bauer, S., Berntsen, T., Bond, T. C., Boucher, O., Chin, M., Clarke, A., De Luca, N., Dentener, F., Diehl, T., Dubovik, O., Easter, R., Fahey, D. W., Feichter, J., Fillmore, D., Freitag, S., Ghan, S., Ginoux, P., Gong, S., Horowitz, L., Iversen, T., Kirkev ˚ag, A., Klimont, Z., Kondo, Y., Krol, M., Liu, X., Miller, R., Montanaro, V., Moteki, N., Myhre, G., Penner, J. E., Perlwitz, J., Pitari,
15
G., Reddy, S., Sahu, L., Sakamoto, H., Schuster, G., Schwarz, J. P., Seland, Ø., Stier, P., Takegawa, N., Takemura, T., Textor, C., van Aardenne, J. A., and Zhao, Y.: Evaluation of black carbon estimations in global aerosol models, Atmos. Chem. Phys., 9, 9001–9026, 2009, http://www.atmos-chem-phys.net/9/9001/2009/.
Lacis, A. A. and Oinas, V.: A description of the correlated k distribution method for modeling
20
nongray gaseous absorption, thermal emission and multiple scattering in vertically inhomo-geneous atmospheres. J. Geophys. Res., 96, 9027–9063, 1991.
Lesins, G., Chylek, P., and Lohmann, U.: A Study of Internal and External Mixing Scenarios and Its Effect on Aerosol Optical Properties and Direct Radiative Forcing, J. Geophys. Res., 107(D10), 4094 doi:10.1029/2001JD000973, 2002.
25
Lohmann, U., Spichtinger, P., Jess, S., Peter, T., and Smit, H.: Cirrus cloud formation and ice su-persaturated regions in a global climate model, Env. Res. Lett., 3, 045022, doi:10.1088/1748-9326/3/4/045022, 2008.
McNaughton, C. S., Clarke, A. D., Kapustin, V. N., Shinozuka, Y., Howell, S. G., Anderson, B. E., Winstead, E., Dibb, J., Scheuer, E., Cohen, R. C., Wooldridge, P. J., Perring, A. E., Huey,
30

![Table 2. Emission sizes, geometric mean diameters in [µm] of carbonaceous aerosols.](https://thumb-eu.123doks.com/thumbv2/123dok_br/18385066.356863/35.918.188.515.266.426/table-emission-sizes-geometric-mean-diameters-carbonaceous-aerosols.webp)
![Fig. 1. Di ff erences in present day total column aerosol mass concentrations [µg/m 2 ] per mixing state between experiment S1 and BASE (S1-BASE)](https://thumb-eu.123doks.com/thumbv2/123dok_br/18385066.356863/39.918.105.613.106.399/erences-present-total-column-aerosol-concentrations-mixing-experiment.webp)
![Fig. 3. Changes between BASE and S1 (S1-BASE) (upper panels) and (S3-BASE) (lower panels) for AOT, CDNC [#/cm 3 ], ADE [W/m 2 ] and AIE [W/m 2 ]](https://thumb-eu.123doks.com/thumbv2/123dok_br/18385066.356863/41.918.215.492.54.525/changes-base-base-upper-panels-base-lower-panels.webp)
![Fig. 4. Global mean AIE and ADE [W/m 2 ] values for all size experiments, (S1 – 4) and the base experiment, BA, for present day conditions.](https://thumb-eu.123doks.com/thumbv2/123dok_br/18385066.356863/42.918.178.530.172.436/fig-global-mean-values-experiments-experiment-present-conditions.webp)