Vol. 6, No. 2, November 2009, 343-349
An Optical WDM Link Simulation
at 4·10 Gb/s with the COMSIS Software
S. Benameur
1, M. Kandouci
1, O. Boumediène
1,
S. Taik
1, M. Bouzid
1, M.Oukli
1Abstract: The evolution of data transmission using optical fiber media has been accelerated since the advent of technical multiplexing wavelengths (WDM), which helps to achieve bit rates of a few Tb/s transported by a single fiber. In this context, we propose in this work, to make a simulation of a system WDM, at 4·10Gb/s with the COMSIS simulator system. We will interest especially to demultiplexing.
Keywords: Optical fiber, Optical link, COMSIS software, WDM, Demulti-plexer, Q-factor.
1 Introduction
The simulators of optical transmission systems bring a precious help for the development of the current systems, for the research and the investigation of the future systems. They so allow to put out the performances of new technologies even before components are available on the market or to investigate the new techniques.
The COMSIS software offers a real possibilities, modeling, simulation and conception of any module of signal processing going from the most elementary device to the complete system of communication [1].
In this aim, we propose in this work, to make a simulation of a system WDM, at 4·10Gb/s. We will interest especially to demultiplexing, we will use a demultiplexer based on Fiber Bragg Grating.
2 Device
modeling
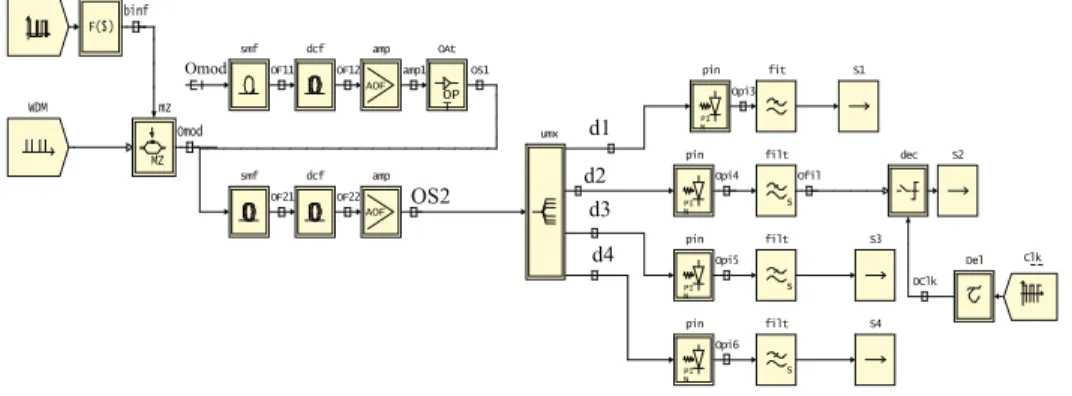
Fig. 1 is the block diagram of the optical link that we are going to simulate. The parameters of the modules of the chain of transmission were fired bibliographical references [2, 3, 4].
The input signal WDM is composed of 4 channels, spaced 100GHz is 0.8nm, in order to limit interference at best, all centered on 1552nm. The multiplex is then modulated to 10Gb/s, then spread to two spans of a Single Mode Fiber which takes into account the effect Kerr, then a fiber compensation and an optical amplifier.
In reception, a demultiplexer based on Fiber Bragg Grating using filters to 40GHz bandwidth is used to separate different channels. The photo-detected signal then passes through a filter low pass Bessel order 5, followed by a circuit decision.
Fig 1 – WDM transmission system: COMSIS’s block diagram.
2.1 Optical fiber
In optical systems the most important passive component is the propagation channel, e.g., the optical fiber. We can write the optical field by introducing a function A, slowly varying, and representing the envelope of the signal as:
0 0
j( )
( , ) ( , ) t z
G z t =A z t e ω −β , (1)
where: ω0 is the central frequency and β0 is the constant propagation.
The generalized propagation equation that describes the propagation of an optical signal in a single-mode fiber is given for the envelope amplitude A by:
2 3
2 2
2 2 3 3
1
| ( ) | [ ( ) | ( ) | ]
2 2 6 R
A i A A
A i A t A i S t A t A
z t t
∂ α ∂ ∂
= − + β + β − γ − ξ ⋅
∂ ∂ ∂ . (2)
where D is a differential operator, which includes the effects of fiber loss through α, chromatic dispersion through β2, and dispersion slope through β3:
2 3
2 2 3 3
1
2 2 6
i D
t t
α ∂ ∂
= − + β + β
∂ ∂ , (4)
where N is a nonlinear operator that takes into account the Kerr and the Raman effects through the nonlinearity coefficient γ and the Raman coefficient ξ:
2 2
| | [ R( ) | | ]
N= − γi A − ξi S t ⋅ A , (5)
where the asterisk is the symbol for convolution and S tR( ) is the impulse response of the filter simulating the dependence of the Raman gain on the frequency.
The frequency response of this filter is approximated by a Lorentzian:
2 2 1 ( ) 2 R R
R R R
S
i
Ω =
Ω − Ω Ω
+
Γ Ω Ω
, (6)
where Ω = ω − ω0, ΩR is the resonant frequency and ΓR is the half Raman linewidth.
The split-step Fourier method is used for numerical simulation. The interface of the model allows us to optionally choose the effects that are to be taken into account (Kerr effect, Raman Effect, polarization-mode dispersion) [1, 5, 6].
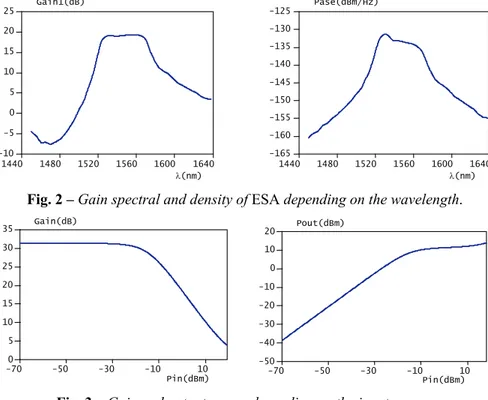
2.2 Optical Amplifiers
To overcome the power budget limitation in optical transmission systems, we use optical amplifiers. Erbium-doped fiber amplifiers (EDFA’s) are now essential devices for many telecommunication applications, and much theoretical research has been done to optimize them [5].
Fig. 2 –Gain spectral and density of ESA depending on the wavelength.
Fig. 3 –Gain and output power depending on the input power.
2.3 Photodetectors
At reception the photodetectors (ideal, PIN, or avalanche photodiodes) are modeled as ideal quadratic detectors (scalar or vectorial) with current fluctuations induced by noise (shot noise, thermal noise). Mathematically, the current fluctuations are modeled as stationary random processes [6].
3
System Performance Assessment
Simulation results are available in digital or graphic forms: time-domain response, power assessment, spectral analysis, bit-error rate, signal-to-noise ratio, or eye diagram.
3.1 Viewing signals
We will interest on the signals coming out of the amplifier and demultiplexer at the end of highlighting the effect of filtering applied it on the sign; namely:
• reducing the band of integration of noise generated by the ASE optical amplifiers,
The Fig. 4 represents the signal at different levels of liaison; at the entrance, then exit modulator, followed by the amplifier and ultimately the signal output of the demultiplexer. Although the signal is reduced output demultiplexer, it has completed its function between the channels and reducing the contribution of noise amplifiers.
The eye diagrams obtained a receipt on 4 channels are represented in Fig. 5.
Fig. 5 – The eye diagram in reception channels.
The Table 1 below summarizes the performance of each of 4 channels in terms of Q calculated from the diagram of the eye in reception. The diagrams of the eye are open which means there is no interference between symbols, therefore fiber compensation plays their role.
Table 1
4 Conclusion
We have transmitted data at 40Gb/s capacity over tow spans of Single Mode Fiber, while having an improved tolerance to noise, owing to the demultiplexer based on Fiber Bragg Grating using filters to 40GHz bandwidth.
5 References
[1] Christine Le Brun, Eric Guillard, and Jacques Citerne: Communication systems interactive software COMSIS: modeling of components and its application to the simulation of optical communication systems, Applied Optics, 10 September 1998. Vol. 37, No. 26.
[2] Jean-Louis Verneuil: Simulation de systèmes de télécommunications par fibre optique à 40 Gbits/s, Thèse de Doctorat de l’Université de Limoges, 2003.
[3] Anne du Bois: Simulation de systèmes de télécommunications par fibre optique: de la conception des systèmes à la validation des composants, Thèse de Doctorat de l’université de Limoges, Septembre 2001.
[4] C. le Brun, Développement de la nouvelle bibliothèque de composants optiques de COMSIS, Thèse de Doctorat de l’Institut National des Science Appliquées de RENNES, Octobre 1999.
[5] Irène et Michel Joindot et douze co-auteurs: Les télécommunication par fibre optique, Edition Dunod 1996.