Abstract— In this paper, we propose a spectral correlation-based
technique for tracking the wavelength shift of a fiber Bragg grating. We compared this approach, by means of a Monte Carlo numerical simulation, to the typical peak tracking techniques applied in classic interrogation systems. As result, we obtained a considerable gain in terms of noise tolerance (about 20 dB), which can be further incremented by selecting large-bandwidth gratings. This permits to increase the power budget of a fiber Bragg grating interrogator without changing the optical layout, overcoming classical limitations of commercial and custom systems. Penalties due to the non-idealities have been evaluated through the same Monte Carlo approach. Finally, we discuss a practical application of the peak tracking techniques to a fiber Bragg grating-based weight sensor, in which we applied the spectral correlation to track both the Bragg wavelength position, spectral deformations due to high strain, and spectral non-linearity.
Index Terms—Fiber Bragg grating (FBG), fiber optic sensor (FOS), optical instrumentation, Monte Carlo simulation.
I. INTRODUCTION
Fiber Bragg gratings (FBGs) are receiving a considerable interests in optical sensors [1]-[3]:
besides owning the advantageous properties of optical technology, the employment of FBGs yields
additional benefits such as in-fiber integration, wavelength-encoded operation, possibility to create
multiplexed sensor networks (the so-called “smart structures”) and predictable reaction to temperature
variation. Several interrogation techniques have been documented in literature, using a wide number
of principles of operation, such as spectral reconstruction through scanning source [4] or filter [5],
matched-filter demodulation [6]-[7], interferometric techniques [8]-[9], birefringence [10]-[11].
Within the last few years, many commercial interrogators have converged to similar optical and
processing architectures, most of them based on the straightforward and reliable principle of operation
of spectral reconstruction; interrogators measure the wavelength shift of a FBG array simply by
scanning a spectral bandwidth with a tunable laser, a tunable filter, or a spectrometer. In this case, a
technique for evaluating the peak wavelength from the measured spectrum has to be implemented;
typical interrogators define the peak wavelength either as the wavelength correspondent to the spectral
Performance analysis of peak tracking
techniques for fiber Bragg grating
interrogation systems
Daniele Tosi,
University of Limerick, Optical Fibre Sensors Research Centre, Limerick, Ireland, [email protected] Massimo Olivero, Guido Perrone
maximum or as the middle point of the X-dB bandwidth (usually 3 dB for weak gratings and 10 dB
for strong gratings).
A spectral correlation technique, however, permits improving performances of the Bragg
wavelength tracking, for all spectrometric and spectral scan-based FBG interrogators, which represent
the vast majority of commercial FBG sensing instruments [12]. The correlation method computes the
mutual correlation between the reference spectrum and the measured one progressively shifted, and
evaluates the FBG wavelength shift as the maximum of the correlation. We performed a Monte Carlo
statistical simulation in order to compare the behavior of all peak tracking techniques, using the
theoretical expressions of the FBG spectra and reproducing a typical FBG interrogation system, with
the purpose of finding the minimum signal-to-noise ratio (SNR) that assesses a correct detection. As
result from our simulation, we demonstrate that a FBG interrogator based on spectral reconstruction is
capable of gaining a power budget of about 20 dB only by replacing the peak tracking algorithm, and
this margin can be even increased by proper choice of the FBGs. Also, the Monte Carlo technique
return quantitative results for FBG design, whereas the optimization of the FBG profile can lead to
superior performance in peak tracking.
Finally, peak tracking techniques have been compared in an applicative context of FBG sensor,
validating the proposed concept.
II. THEORY
The mode-matching technique [13] provides a closed-form expression for the FBG reflectivity that
permits to generate grating spectra from the parameters of the refractive index modulation. Hence, the
reflectivity of a uniform FBG can be expressed as:
( )
(
)
(
)
22 2 2 2 2 2 2 ˆ ˆ cosh ˆ sinh κ σ σ κ σ κ λ − − − = L L R (1)
where R(λ) is the reflectivity, L is the grating length, κ is a parameter that expresses the reflectance
per unit length and
σ
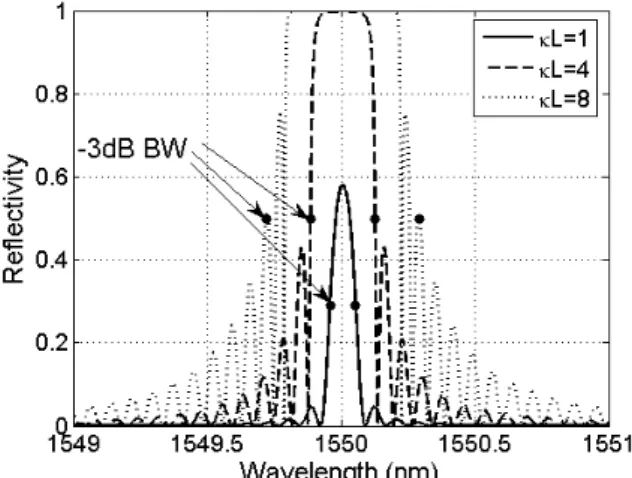
ˆ is a self-coupling coefficient; the parameter κL expresses the strength of thegrating. Figure 1 shows typical FBG spectra at 1550 nm for different values of κL: as the grating
strength increases, the maximum reflectivity Rmax = tanh2(κL) grows and, at the same time, the
spectrum enlarges and side lobes become more effective.
When an axial strain ε is applied to a FBG or its temperature is changed by the quantity ΔT, the
resulting spectrum is modified. If the perturbation is low, the Bragg wavelength shift ΔλB of the FBG
can be approximated with a linear relationship [14-15]:
Δ
λ
B =kεε
+kTΔT (2)where kε and kT are the strain- and thermo-optic coefficients; typical values are kε = 1 pm/με and kT
= 10 pm/°C for FBGs operating in the third optical window. For low excitations, the linear model that
R
(
λ,ε,ΔT)
≅R(
λ−kεε−kTΔT)
(3) Although derived from the ideal theory, Eqs. (1-3) provide a simple analytical model that can beexploited to simulate the behavior of FBGs in optical sensors.
Fig. 1. Theoretical reflection spectra of a 1550-nm FBG with κL=1 (solid line), κL=4 (dashed line), and κL=8 (dotted line).
Fig. 2. Peak tracking techniques in FBG spectra: spectral peak (a), bandwidth middle-point (b), centroid (c), spectral correlation (d).
III. PEAKTRACKINGTECHNIQUES
The typical structure of a FBG static interrogator is based on a spectral reconstruction technique. A
tunable laser source, or, alternatively, a broadband source followed by a tunable optical filter,
performs a continuous spectral sweep over the wavelength range λ1,…, λN, with sampling resolution
δλ. The source is coupled to the FBG array, and the backreflected power is received with a
photodetector, synchronized to the spectral sweep. Hence, the whole FBG spectrum over the
interrogator bandwidth is reconstructed.
With this arrangement, a technique for extracting the peak position, and consequently the spectral
shift, of each FBG has to be defined [16-18]. The typical tracking method is to estimate the peak
wavelength as the maximum of the spectral response or, more commonly, to define the FBG pitch as
the middle-point of the X-dB bandwidth. A possible alternative approach is to estimate the peak
( )
∑
∑
= = = N n N N n N N C S S 1 1 λ λ λ (4)The alternative technique proposed in this paper, and illustrated in Fig. 2, is based on the
exploitation of the linear strain/temperature-spectrum relationship. The FBG spectrum is measured,
with the same setup, at the initial time, obtaining the reference spectrum Sref(λ). Then, at each instant
the measured spectrum Sm(λ) is compared to the reference one, and the wavelength shift Δλs is
estimated as the maximum of the correlation between the reference spectrum and the shifted replica of
the measured one [16]:
( ) ( )
( λ λ λ)
λ λ
λ −Δ
Δ Δ = Δ m ref S S
s max (5)
IV. SIMULATION
A. Outline
The core of the paper relies on the proposed benchmark for peak tracking evaluation, based on
Monte Carlo simulation [19]. The Monte Carlo approach allows simulating each peak tracking
technique in presence of arbitrary SNR, and with any FBG profile, while traditional simulation
techniques operate only with a single FBG profile [16-17]. Thus, the use of Monte Carlo returns not
only a qualitative estimate of the superior performance of correlation-based tracking, but also crafts
specific FBG design considerations for maximizing interrogation performance.
Thus, the purpose of our simulation is to evaluate the noise tolerance of each peak tracking
technique, assuming the typical parameters of a FBG interrogator (either based on scanning filter or
spectrometer) and the theoretical behavior of grating spectra. We apply a statistical simulation derived
from the Monte Carlo technique: we generate several instances of additive noise, multiplied for
different values of SNR, and then evaluate the error on the peak estimation. The goal is to determine,
for each value of the grating strength κL, the threshold SNR, defined as:
0 ) ( P P TH TH err SNR
SNR = Δλ <Δλ = (6)
where P(|Δλerr|<ΔλTH) is the probability of correct detection, i.e. the error Δλerr between the FBG
wavelength λP and the estimated peak λPe is lower than the acceptable error ΔλTH, and P0 is the target
probability. We define the SNR as:
2 max n R SNR σ = (7)
where σn2 is the noise variance; this assumption permits to evaluate the SNR related to the FBG
reflectivity. As known from the theory of statistical simulations, the Monte Carlo approach does not
assess that the error is limited, unless the noise probability density is limited, but gives information
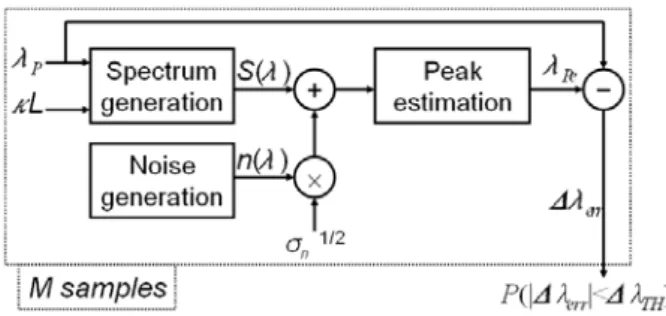
Fig. 3. Schematic of the Monte Carlo simulation approach.
The operative approach of the simulation is schematized in Figure 3. As first step, the reflection
spectrum of a FBG with peak wavelength λP = 1550 nm and a fixed value of κL is generated,
according to (1); the spectrum is evaluated over the wavelength range 1547-1553 nm, with step δλ = 1
pm. The sampling grid is consistent with the typical commercial FBG interrogator [20-21]. Then, for
each Monte Carlo iteration, a noise instance with unitary variance and a fixed probability density
function is generated, normalized to the desired SNR value and summed to the FBG spectrum. Since
we assume, from the linear model described by (3), that the spectrum shifts without distortion, there is
no need to include a wavelength shift in the simulation. Then, the FBG peak is estimated with all the
previously described techniques, obtaining the error Δλerr; we set the error threshold for correct peak
detection ΔλTH as 10pm, which is close to the typical accuracy of a FBG interrogator. The simulation
is repeated M =1000 times, setting the target probability of correct detection P0 = 96% and changing
the SNR, in order to evaluate SNRTH for each value of κL.
Since the peak tracking performances depend on the noise distribution, we performed the Monte
Carlo simulation with both gaussian and uniformly distributed noise. These almost uncorrelated noise
profiles tend to advantage the spectral correlation technique; however, realistic systems include a
whitening filter that removes the residual correlation bringing the system back to an almost
uncorrelated noise shape.
B. Results and discussion
The results of Montecarlo simulation, obtained with additive white gaussian noise, are reported in
Figure 4. The graph clearly shows the completely different behavior of the peak tracking approaches,
with a strong dependence on the FBG bandwidth.
The pitch wavelength estimated through the peak of the spectral response exhibits the worst
performances: the minimum required SNR is 34.2 dB in the best case (κL=0.4), but performances
strongly decrease when the FBG bandwidth grows, overcoming 100 dB for κL>5. Clearly, this
technique has unacceptable performances unless the FBG is extremely selective. The peak estimation
based on the -3dB bandwidth yields much better results: the target SNR lays on a floor (19.4 dB –
24.4 dB) for κL ranging from 0.4 to 3, hence for 14.4% - 99% reflectivity, and tends to decrease for
effect of spectral side-lobes, which are progressively included in the -3dB bandwidth and are more
selective than the main lobe. The centroid algorithm, instead, exhibits the opposite trend: the threshold
SNR monotonically decreases with κL, requiring a strong SNR for poorly reflective FBGs, but it is
convenient with respect to the -3dB bandwidth (BW) tracking for κL>9 (SNRTH≈ 32dB). Finally, the
spectral correlation is by far the most efficient technique, since it requires the lowest SNR for each
value of κL. The SNRTH gain with respect to the bandwidth tracking is significant: for κL=1.8, which
is the best case of the -3dB BW curve, the SNR required by the spectral correlation techniques is 18.2
dB lower. For κL>2.5, SNRTH is lower than 0 dB, which means that the system is extremely
noise-tolerant; for κL=12, the target SNR for the spectral correlation is -5.3 dB, with a difference of 34.0 dB
– 34.9 dB with respect to -3 dB BW and centroid curves, respectively, at the same κL. As expected,
the spectral enlargement occurring when κL increases permits a better alignment of the spectra. The
case κL=0.1 (Rmax = 1%), reported for completeness, is not of practical interest.
The variation of the noise probability density from gaussian to uniform distribution does not modify
the behavior of the SNRTH(κL) curves, as shown in Figure 5, although performances are slightly
improved. Peak and -3dB BW curves reproduce the same trend of gaussian noise, but the target
probability is achieved with a lower SNR; the gain, with respect to the gaussian probability density, is
7.3 dB – 14.1 dB for the peak curve and 3.0 dB - 6.5 dB for the -3dB BW tracking, with a small
dependence on κL. On the other hand, centroid and correlation curves exhibit the same behavior of
Figure 4, with a slight (±1.5 dB) difference that can be possibly attributed to the low number of Monte
Carlo samplings.
Fig. 5. Evaluation of the target SNR as a function of κL for each tracking technique, performed with a 1000-sample Monte Carlo simulation with uniformly distributed noise.
The results shown in Figure 4-5 report, for the spectral correlation, the ideal case, based on the
assumption that the reference spectra are available without noise. In order to evaluate the impact of
the finite SNR of the initial spectrum, we repeated the simulation shown in Figure 4 adding white
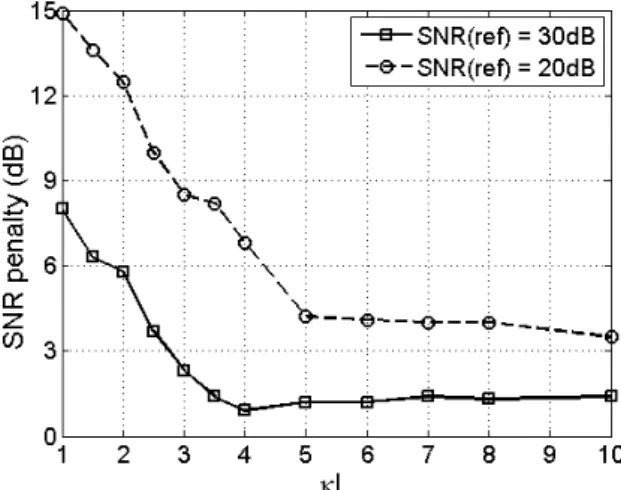
gaussian noise on both spectra. We report in Figure 6 the SNR penalty, i.e. the SNR variation from
the ideal case, when the reference spectrum is measured with SNR equal to 30 dB and 20 dB. In the
first case, the penalty lays on a floor (~1.3 dB) for κL>4, and increases up to 8.0 dB for κL=1; in the
second case, the SNR penalty exhibits the same trend, but the floor value is ~4.0 dB for κL>5, with a
maximum penalty of 14.9 dB for κL=1. As expected, the penalty depends on the FBG bandwidth,
since larger spectra are more tolerant to noise; again, this suggests than the application of spectral
correlation provides better performances when applied to large FBGs. However, even supposing an
inaccurate measure of the reference spectrum and a highly selective grating, the correlation technique
is still the most advantageous in terms of SNRTH. We also performed a further simulation in order to
evaluate the effect of the laser linewidth on the spectral estimate: this was implemented by filtering
the spectra with a sliding gaussian window with different width. No clear impact on the SNR has been
noticed for κL>0.5, even for a laser linewidth of 100 MHz; although a large laser spectral width tends
to flatten the spectral profile, the correlation techniques is capable of dealing with noise fluctuations
much greater than the effect of this spectral flattening.
To summarize, the Monte Carlo analysis clearly demonstrates the effect of FBG design on the peak
tracking performance: strong large-bandwidth FBGs are preferred for correlation technique, while
traditional techniques work better with narrow-bandwidth FBGs. This is an important consideration
for practical FBG applications, as the majority of the research papers and industrial installations
mount narrow-bandwidth FBGs, with κL=0.9-1.5. Our simulation shows instead that an approximate
peak tracking software, without any modification of the optical architecture, and works with any
spectral scanning technique like the vast majority of FBG commercial interrogators.
Fig. 6. Estimated SNR penalty with respect to the ideal case, when the reference spectrum is measured with SNR equal to 20 dB and 30 dB.
Fig. 7. Setup of the optical sensor for weight measurement on a road bump. Three FBGs, one for each side and one in the central part, are pre-strained and stuck on the back side of the bump. The system is loaded by applying a vertical static
weight (0 – 100 kg) in each position.
V. EXPERIMENTALRESULTS
The previously discussed peak tracking techniques have been applied in a practical case for the
static characterization of a FBG-based weight sensor embedded in a road bump illustrated in Figure 7.
Three FBGs have been mounted on the rear side of the dump in different positions; this arrangement
permits to localize the load from different punctual strain measurements. The reflection spectra are
recorded using a sweeping tunable laser (Photonetics Tunics-BT) and a power meter (HP8163A), over
a wavelength grid with spacing of 10 pm. In order to load the structure, we vertically applied a weight
of 0 – 100 kg, with step 10 kg, on the bump in different positions; hence, the spectral shift of each
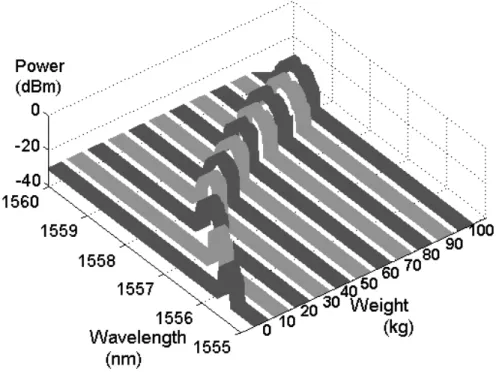
FBG depends on the weight applied to the sensor and on its position. As example, we report in Figure
Fig. 8. Measured FBG spectrum when loaded by 0-100 kg weight vertically applied over the FBG.
Fig. 9. Estimated wavelength shift as a function of weight, for all the applied peak tracking techniques; the high-strain curve refers to the FBG positioned under the load, while the low-strain curve refers to the FBG placed at the opposite side.
Figure 9 shows the wavelength shift, estimated with all the peak tracking techniques, as a function
of the weight applied to the FBG placed under the load and to the one mounted at the opposite side;
we defined as reference FBG spectrum the unloaded condition (0 kg). In the first case, the
perturbation of the FBG is strong, and the wavelength shift exceeds the linear range even for weights
higher than 30 kg, hence the Bragg wavelength measurement is accurate only in the first part of the
curve. Assuming the correlation technique as the correct estimate, the error on peak position with the
other methods is ±40 pm for 10 – 20 kg, hence a considerable uncertainty. As the strain increases, the
techniques tend to find a sub-optimal alignment between the different spectra, while peak and BW
tracking tend to follow the peak position of the deformed spectrum. The second FBG, instead, is
weakly perturbed by the mechanical pressure, and exhibits a reduced spectral shift (0.15 nm). The
spectral shift estimates lay in a range of ±20 pm with respect to the spectral correlation computation.
The application of a correlation technique can be exploited for determining whether the FBG
wavelength shift exceeds the approximately linear region identified by (3). If that occurs, the FBG
spectrum is significantly distorted, and the wavelength shift is no longer related to the
mechanical/thermal excitation through a closed and repeatable relationship; consequently, the
measure of the FBG peak is unreliable. Figures 8-9 show a typical example of this situation: due to
the low elastic isolation between the bump surface and its rear side, the application of a heavy load
produces an intense strain on the FBG, deforming its spectrum. A possible way for extracting this
information is to evaluate the mean square error (MSE) between reference and measured spectra, after
having found the optimum alignment:
( ) (
)
(
)
∑
=
Δ
−
=
Nn
S n m n ref
S
S
N
MSE
1
2
1
λ
λ
λ
(8)
Fig. 10. The MSE of the spectral reconstruction is plotted versus the applied weight. The high-strain curve refers to the FBG positioned under the load, while the low-strain curve refers to the FBG placed at the opposite side.
This permits an immediate evaluation of the quality of the spectral reconstruction: as soon as the
measured spectrum is distorted, the MSE grows with respect to the unstrained condition. We applied
this technique to the measurement reported in Figures 8-9, in which we evaluated the MSE of the
spectral alignment both for the FBG subjected to the heavy load and for the one positioned at the
opposite side. The graph clearly shows that MSE achieved for the FBG far from the vertical load is
approximately constant, confirming that the system operates in a linear regime. In contrast, for the
FBG positioned close to the pressure point, the heavy load induces a perturbation that exceeds the
we observe that the FBG spectrum for 20 kg weight is clearly much larger than the reference
spectrum. We observe an almost linear increase of the MSE curve with respect to the applied weight;
this suggests the possibility to exploit also the non-linear region of the strain/wavelength
characteristic, expanding the FBG interrogation range.
VI. CONCLUSIONS
The application of a spectral correlation-based technique to the peak estimation of a FBG permits a
considerable increase of performances, expressed in terms of SNR resilience, of a typical
interrogation system. Our statistical Monte Carlo-based simulations show that the gain, with respect to
the standard wavelength tracking techniques, is about 20 dB, depending on the κL parameter of the
FBG: the employment of broad-band gratings permits to further improve the SNR tolerance. The
increased noise tolerance achieved by this routine can be spent for enhancing the power budget of the
FBG interrogator, increasing the maximum number of sensing FBGs as well as the acceptable losses
over the fiber link, without changing the optical layout of the system. Finally, a practical case of the
application of peak tracking methods has been discussed, pointing out the capability of the spectral
correlation to detect whether the sensor exceeds the linear regime of the strain characteristic.
REFERENCES
[1] Y. J. Rao, “In-fibre Bragg grating sensors,” Meas. Sci. Technol., vol. 8, pp.355-375, 1997.
[2] A. D. Kersey, M. A. Davis. H. J. Patrick, M. LeBlane, K. P. Koo, C. G. Askins, M. A. Putnam, E. J. Fabriele, “Fiber grating sensors”, J. Lightw. Technol., vol. 15, pp. 1442-1463, 1997.
[3] E. J. Fabriele, “Fiber Bragg grating strain sensor: present and future in smart structures,” Opt. Photon. News, vol. 9, pp. 33-37, 1998.
[4] Y. Want, Y. Cui, B. Yun, “A fiber Bragg grating sensor system for simultaneously static and dynamic measurements with a wavelength-swept fiber lasers,” IEEE Photon. Technol. Lett., vol. 18, pp. 1539-1541, 2006.
[5] M. G. Xu, H. Geiger, J. L. Archambauldt, L. Reekie, J. P. Dakin, “Novel interrogation system for fibre Bragg grating sensors using an acousto-optic tunable filter,” Electron. Lett., vol. 29, pp. 1510-1511, 1993.
[6] M. A. Davis, A. D. Kersey, “Matched-filter interrogation technique for fibre Bragg grating arrays,” Electron. Lett., vol. 31, n.10, pp. 822-823, 1995.
[7] R. W. Fallon, L. Zhang, A. Gloag, I. Bennion, “Identical broadband chirped grating-interrogation technique for temperature and strain sensing,” Electron. Lett., vol. 33, n. 8, pp. 705-707, 1997.
[8] Y. Yu, H. Zhao, “A novel demodulation scheme for fiber Bragg grating sensor systems,” IEEE Photon. Technol. Lett., vol. 17, n. 1, pp. 166-168, 2005.
[9] A. D. Kersey, T. A. Berkoff, W. W. Morey, “High resolution fibre grating based strain sensor with interferometric wavelength shift detection,” Electron. Lett., vol. 28, p. 236, 1992.
[10]S. T. Oh, W. T. Han, U. C. Paek, Y. Chung, “Discrimination of temperature and strain with a single FBG based on the birefringence effect,” Opt. Expr., vol. 12, n. 4, pp. 724-729, 2004.
[11]C.-C. Ye, S. E. Staines, S. W. James, R. P. Tatam, “A polarization-maintaining fibre Bragg grating interrogation system for multi-axis strain sensing,” Meas. Sci. Technol., vol. 13, pp. 1446-1449, 2002.
[12]A. Mendez, “Fiber Bragg grating sensors: a market overview,” Proc. SPIE, vol. 6619, pp. 661905.1-661905.6, 2007. [13]T. Erdogan, “Fiber grating spectra,” J. Lightw. Technol., vol. 15, n. 8, pp. 1277-1294, 1997.
[14]A. Othonos, K. Kalli, Fiber Bragg gratings: fundamentals and applications in telecommunications and sensing, Artech House: Norwood, 1999.
[15]G. Meltz, W.W. Morey, “Bragg grating formation and germanosilicate fiber photosensitivity.” Proc. SPIE, vol. 1516, pp. 185-199, 1991.
[16]J. M. Gong, C. C. Chan, W. Jin, J. M. K. MacAlpine, M. Zhang, Y. B. Liao, “Enhancement of wavelength detection accuracy in fiber Bragg grating sensors using a spectrum correlation technique,” Opt. Comm., vol. 212, pp. 29-33, 2002. [17]L. Negri, A. Nied, H. Kalinowski, A. Paterno, “Benchmark for peak detection algorithms in fiber Bragg grating
interrogation and a new neural network for its performance improvement,” Sensors, vol. 11, n. 4 pp. 3466-3482, 2011. [18]S. D. Dyer, P. A. Williams, R. J. Espejo, J. D. Kofler, S. M. Etzel, “Fundamental limits in fiber Bragg grating peak
wavelength measurements,” Proc. SPIE, vol. 5855, 2005.
[19]M. H. Kalos, P. A. Whitlock, Monte Carlo Methods, John Wiley & Sons, 1986. [20]Micron Optics, www.micronoptics.com.