Abstract— Effect of cross-sensitivity between temperature and refractive index (RI) was studied using an optical sensor based on Bragg grating inscribed in an etched multi-mode fiber (MMF). RI sensitivities of different modes were used to obtain a linear response and temperature dependence in water:glycerin solutions. Results pointed out that the absolute average RI sensibility reduces from 0.97 ± 0.05 nm/RIU to 0.76 ± 0.07 nm/RIU while the temperature increases from 15 oC up to 35 oC, respectively. Effect of temperature on the RI sensitivity is related with the increasing difference between the fiber and surrounding RI, which results in lower evanescent field and, consequently, reduced surrounding RI sensitivity. Therefore, in order to improve the precision during the RI measures, the effect of temperature must be considered in the calibration curves, principally in MMF fiber grating sensors that show low RI sensitivity values.
Index Terms—fiber Bragg gratings, refractive index sensitivity, temperature
sensitivity, thermo-optic effect.
I. INTRODUCTION
Functional optical sensors for surrounding refractive index (RI) have been applied in quality control
of industrialized food, chemicals or biochemicals. Moreover, devices based on optical fibers exhibit
some advantages such as reduced size and weight, allow remote monitoring with high multiplexing
capacity, electrical passivity and electromagnetic immunity [1-8]. However, due the thermo-optic
effect, changes of temperature also induces RI variations at the fiber and/or at the response to the
surrounding RI and consequently, sensors based on optical fibers present a cross sensibility that may
afford imprecise responses.
Several temperature and RI optical sensors are reported at the literature, where the cross-sensibility
effect has been suppressed by different devices geometries [1-4] or signal processing [5]. For
instance, Z. Li et al. [1] proposed an intensity-modulated RI sensors based on in-fiber Michelson
interferometer by splicing a section of thin core fiber between two standard single mode fiber (SMF)
that are insensitive to temperature and thus, using this setup, the cross-sensitivity between temperature
Influence of temperature on the refractive
index sensitivities of fiber Bragg gratings
refractometers
Diego Fernandes, Rosangela Winter, Jean Carlos C. da Silva and Ricardo C. Kamikawachi
Graduate Program in Electrical and Computer Engineering (CPGEI), Federal University of Technology - Paraná, Curitiba, Brazil – Postal Code [email protected]
Andreia G. Macedo
and RI was removed. These sensors displayed sensitivity of 208.24 and 125.44 dB/RIU at the RI of
1.440 and 1.500, respectively, at temperature range between 25 ºC and 100 ºC. Moreover, C.
Gouveiaet.al [2] reported sensors based on a white light Mach–Zehnder configuration, with serrodyne
phase modulation used to interrogate two similar non-adiabatic tapered optical fiber sensors in a
differential scheme. In this situation, the system was able to measure the RI independent of
temperature and they were able to detect a RI ≈ 1.46 × 10⁻⁶. The authors emphasized that the sensor
arrangement still sensitive to the changes induced in the RI of the solution by the temperature, or
equivalent, variations of RI derived from the thermo-optic coefficient at the solution were measured,
while the effects of the silica thermo-optic coefficient in the fiber sensor were canceled out. A hybrid
optical fiber structure for RI measurement was also reported [3], in this case the sensor was composed
of single-multimode-single mode fibers (SMS) and a long period fiber grating (LPFG), as sensing
mechanism the SMS structure was insensitive towards changes of RI, but sensitive to temperature,
while the LPFG was sensitive to both parameters.
Different approaches to measure temperature and environmental RI were also reported at the
literature [6-10]. Mostly, the cross-sensibility was studied considering the fiber Bragg grating (FBG)
response as a combination of thermal and RI sensibility, but few works evaluate how the temperature
variation affects the RI sensibility. Recently, H. Z. Yang et al. [5] showed that for accurate
simultaneous measurement, the element of cross sensitivity between temperature and RI must be
included in the measurement using 3 × 3 characteristic matrix, but they have not studied in detail how
temperature affects RI sensitivity. Silica has positive thermo-optic coefficient and thus, a temperature
increase induces a decrease in the evanescent field, reducing the Bragg grating sensibility to the
changes in environmental RI.
Herein, influence of temperature on the RI sensitivity of a fiber Bragg grating inscribed in an etched
MMF fiber was evaluated. RI sensitivities of different modes were used to obtain a linear response
and a relation between this parameter and temperature. Results pointed out that the temperature
increases induce a slight reduction of RI sensitivity.
II. METHODOLOGY
Solutions of water:glycerin were used to characterize the RI sensitivity, eight samples were
prepared with glycerin concentration changing from 0 up to 80 % (v/v). RI values were measured
using an ABBE refractometer (Biobrix - 2WAJ) with RI resolution of 0.5 x 10⁻⁴. Additionally, in
order to quantify the RI changes as a function of the temperature in the water:glycerin solutions, a
thermostatic bath (Lauda ECO RE 415G) was coupled to the ABBE refractometer.
Sensor preparation: Bragg grating was recorded in a MMFfiber (Furukawa) having core diameter of
50 m. The MMF was chosen because allows to obtain the RI sensitivity with a reduction of the fiber
achieved using the following procedure: a surface corrosion was performed using an aqueous
hydrochloric acid solution (HF 40%), followed by a neutralization procedure using aqueous sodium
hydroxide solution (NaOH 2Mol/L). The rate of corrosion was monitored in situ by the shift of the
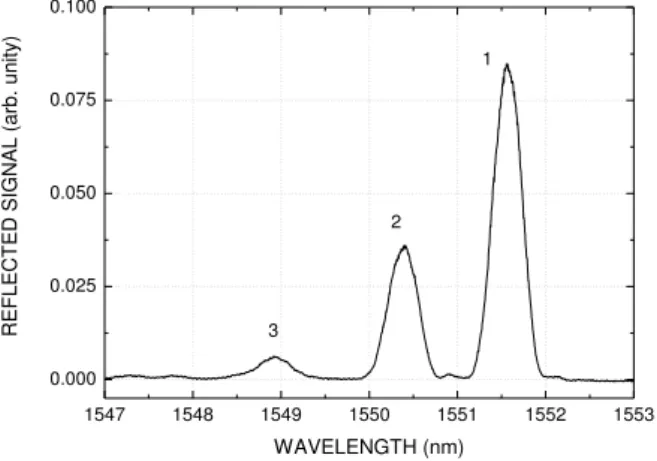
wavelength peak at the reflected signal. The FBG reflected spectrum is presented at Figure 1, this
spectrum has three peaks, denoted as 1, 2 and 3 modes, being the higher intensity peak associated
with the fundamental mode [11]. A reproducible relation between the peak shift and the fiber diameter
was found. Finally, the fiber diameter was measured using an optical microscope (OLYMPUS
BX51RF), displaying that the final fiber diameter was 17 m.
1547 1548 1549 1550 1551 1552 1553 0.000
0.025 0.050 0.075 0.100
3
2 1
R
E
FL
E
C
T
E
D
S
IG
N
A
L
(arb.
un
it
y
)
WAVELENGTH (nm)
Fig. 1. Reflected spectrum acquired from a Bragg grating recorded on a MMF, after the corrosion procedure.
The sensor response was characterized using a SM125 interrogator (MicroOptics) with resolution of 1 pm. For these measurements, water:glycerin solutions were harvested in several glass tubes that allow the simultaneous insertion of a thermometer and the fiber sensor. This set-up was immersed in a
thermostatic bath (Lauda) with controlled temperature. After each measure, the thermometer and the
fiber sensor were washed with water and isopropyl alcohol (iPrOH). In order to confirm that the
residuals were effectively removed, a reflection spectrum was acquired from the fiber sensor
immersed in water and compared with a reference spectrum. The FBG RI response was monitored at
temperatures of 15, 20, 25, 30 e 35°C. RI was monitored at temperatures of 15, 20, 25, 30 e 35°C. To
ensure reproducibility, each sample was analyzed 5 times upon similar conditions.
III. RESULTS AND DISCUSSION
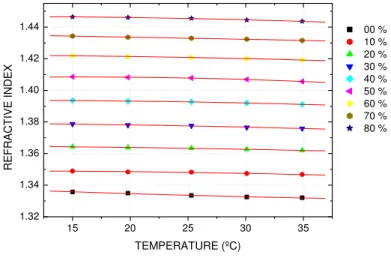
Figure 2 shows the RI variation of water-glycerin solutions as a function of the temperature, these
results were acquired using the ABBE refractometer and thus, corresponds to a suitable RI
dependence with temperature. The RI versus temperature curve presents a nonlinear behavior and a
proper calibration curve was obtained by fitting a second order function over the experimental data.
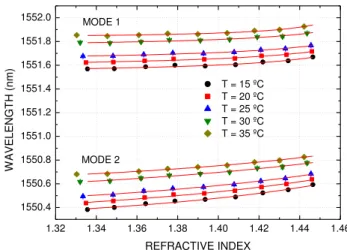
In order to verify the effects of the temperature in the RI sensitivity the modes 1 and 2 were
monitored. The peak positions of modes, as a function of RI and temperatures are showed at Figure 3.
The changes in the RI values due to temperature increase were corrected using the calibration curves
from figure 2.
15 20 25 30 35
1.32 1.34 1.36 1.38 1.40 1.42 1.44
R
E
FR
A
C
T
IV
E
I
N
D
E
X
TEMPERATURE (ºC)
00 % 10 % 20 % 30 % 40 % 50 % 60 % 70 % 80 %
Fig. 2. RI versus temperature acquired from water:glycerin solutions using an ABBE refractometer coupled to a thermostatic bath (symbols are experimental data and the solid lines are fitting of a second order function).
Wavelength shifts of mode 2, due to the RI increase at different temperatures, are presented at
Figure 4. In this figure, solid lines depict the best fittings to the empirical equation (1):
� = �1− � −�� (1)
Where n is the surrounding (water-glycerin solution) RI and a1 = -(0.31 ± 0.12) nm, a2 = -(0.089
± 0.054) and a3 = (1.621 ± 0.069) are the fitting parameters at 15°C. These curves showed that the
wavelength shifts decrease with temperature increasing. Error bars are combined standard
uncertainties and were calculated according to standard uncertainties, inherent to the experimental
standard deviation of the mean of FBG wavelength, measured 5 times under repeatability conditions,
as well as the OSA resolution uncertainty, the Gaussian fitting uncertainty used to determine the FBG
1.32 1.34 1.36 1.38 1.40 1.42 1.44 1.46 1550.4
1550.6 1550.8 1551.0 1551.2 1551.4 1551.6 1551.8 1552.0
MODE 2 MODE 1
W
A
V
E
LE
N
G
T
H
(
nm)
REFRACTIVE INDEX
T = 15 ºC T = 20 ºC T = 25 ºC T = 30 ºC T = 35 ºC
Fig. 3. Wavelength positions of modes 1 and 2, as a function of RI and temperature.
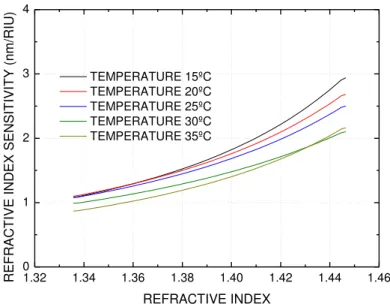
Figure 5 displays the sensitivity of mode 2 as a function of the RI and the temperature. These
sensitivity curves are obtained from the differentiation of empirical fitting. Comparing these five
sensitivity curves, acquired at temperature range between 15 ºC and 35 ºC, it is clear that the
sensitivity of mode 2 falls to lower values mainly at the higher temperature range.
1.32 1.34 1.36 1.38 1.40 1.42 1.44 1.46 0.00
0.05 0.10 0.15 0.20 0.25
m
od
e
2
(nm)
REFRACTIVE INDEX
TEMPERATURE 15ºC TEMPERATURE 20ºC TEMPERATURE 25ºC TEMPERATURE 30ºC TEMPERATURE 35ºC
Fig. 4.Wavelength shifts of mode 2 against RI and temperature.
Sensor response to the changes of RI can also be obtained from the difference between the peak
positions of mode 2 and mode 1 (2 – 1). The evolution of this difference, against RI and
temperature, is displayed at Figure 6, in this case a linear fitting was applied and resulted in
1.32 1.34 1.36 1.38 1.40 1.42 1.44 1.46 0
1 2 3 4
R
E
FR
A
C
T
IV
E
I
N
D
E
X
S
E
N
S
IT
IV
IT
Y
(
nm/
R
IU
)
REFRACTIVE INDEX
TEMPERATURE 15ºC TEMPERATURE 20ºC TEMPERATURE 25ºC TEMPERATURE 30ºC TEMPERATURE 35ºC
Fig. 5.RI sensitivity of mode 2 as a function of the temperature.
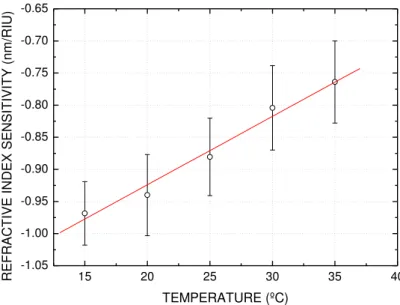
Figure 7 presents the changes of average RI sensitivity as a function of the temperature. The
absolute average RI sensitivity reduces from 0.97 ± 0.05 nm/RIU to 0.76 ± 0.07 nm/RIU when the
temperature increases from 15 ºC up to 35 ºC, respectively, with a reduction of 0.2 nm/RIU and a rate
of 0.010 ± 0.004 nm/(RIU ºC). The decrease in the RI sensitivity with the temperature increase can be
explained by the weakening of the evanescent field. The increase in the temperature causes an
increase in the fiber RI and, on the other hand, a decrease in the surrounding RI. As result, the
evanescent wave becomes more confined reducing the RI sensitivity.
1.32 1.34 1.36 1.38 1.40 1.42 1.44 1.46 -0.12
-0.10 -0.08 -0.06 -0.04 -0.02 0.00 0.02
2
-1
(
nm)
REFRACTIVE INDEX
T = 15 ºC T = 20 ºC T = 25 ºC T = 30 ºC T = 35 ºC
Fig. 6.Difference between the peak positions of mode 2 and mode 1 against RI and temperature.
Due the fact of this fiber Bragg grating MMF has low RI sensitivity; the effect of temperature on
the RI sensitivity is not marginal and thus, must be considered in the calibration curves in order to
15 20 25 30 35 40 -1.05
-1.00 -0.95 -0.90 -0.85 -0.80 -0.75 -0.70 -0.65
R
E
FR
A
C
T
IV
E
I
N
D
E
X
S
E
N
S
IT
IV
IT
Y
(
nm/
R
IU
)
TEMPERATURE (ºC)
Fig. 7.Average FBG RI sensitivity against temperature.
IV. CONCLUSION
It was verified that the increasing temperature induces a reduction of RI sensitivity of Bragg grating
MMF with reduced diameter. This reduction was mainly attributed to a decrease in the evanescent
field, resulting from the increased difference between the fiber and surrounding RI. Considering the
thermo-optic coefficient for silica of around 8 x 10⁻⁶ °C-1, it is expected a low reduction of RI
sensibility with the increase in the temperature, and due this, in typical applications were the RI
sensitivity is at order of 102 nm/RIU this effect can be overlooked. However, if the sensor has low RI
sensibility and displays other interesting features such as simultaneous measures, or if the application
requires large temperature variations, this effect must be considered in the calibration curves.
Monitoring the difference between the wavelength peaks position allow obtain a linear relation for the
RI sensitivity as a function of the temperature resulting in a direct analysis of the cross sensitivity.
ACKNOWLEDGMENT
THE AUTHORS ACKNOWLEDGE FINEP, CAPES, SETI, CNPQ AND FUNDAÇÃOARAUCÁRIA FOR
SCHOLARSHIPS AND FUNDING.THE USED FBG WERE RECORDED AT THE PHOTONICS LABORATORY OF
UTFPR-CURITIBA, ASSOCIATED LABORATORY OF INCTFOTONICOM.
REFERENCES
[1] Zhengyong Li, Yiping Wang, Changrui Liao, Shen Liu, Jiangtao Zhou, Xiaoyong Zhong, Yingjie Liu, Kaiming Yang,
Qiao Wang, Guolu Yin, “Temperature-insensitive refractive index sensor based on in-fiber Michelson interferometer”,
Sensors and Actuators B: Chemical, vol. 199 (2014) 31–35.
[2] Carlos Gouveia, Mohammad Zibaii, Hamid Latifi, Manuel J. B. Marques, J.M. Baptista, Pedro A.S. Jorge, “High
[3] Jie Huang, Xinwei Lan, Amardeep Kaur, Hanzheng Wang, Lei Yuan, Hai Xiao, “Temperature compensated refractometer based on a cascaded SMS/LPFG fiber structure”, Sensors and Actuators B: Chemical, vol. 198 (2014) 384-387.
[4] Y. Wang, D.N. Wang, C.R. Liao, T. Hu, J. Guo, H. Wei, “Temperature-insensitive refractive index sensing by use of
micro Fabry-Perot cavity based on simplified hollow-core photonic crystal fiber”, Optics Letters, vol. 38, (2013) 269–
271.
[5] Hang Zhou Yang, Muhammad Mahmood Alib, Md Rajibul Islamb, Kok Sing Limb, Dinusha Serandi Gunawardena,
Harith Ahmad, “Cladless few mode fiber grating sensor for simultaneous refractive index and temperature measurement”, Sensors and Actuators A: Physical, vol 228 (2015) 62-68.
[6] A. Iadicicco, S. Campopiano, A. Cutolo, M. Giordano, A. Cusano, “Non uniform thinned fiber Bragg gratings for simultaneous refractive index and temperature measurements”, IEEE Photonics Technology Letters, vol. 17 (2005)
1495–1497.
[7] Xuan Guo, Weihong Bi, Lingxiao Wang, Feng Liu, “Simultaneous measurement of refractive index and temperature
using dual-period grapefruit microstructured fiber grating”, Optik, vol. 124, (2013), pp. 3371-3374.
[8] Huihao Wang, Hongyun Meng, Rui Xiong, Qinghao Wang, Ben Huang, Xing Zhang, Wei Yu, Chunhua Tan, Xuguang
Huang, “Simultaneous measurement of refractive index and temperature based on asymmetric structures modal interference”, Optics Communications, vol. 364, (2016), pp. 191–194.
[9] Qiqi Yao, Hongyun Meng, Wei Wang, Hongchao Xue, RuiXiong, Ben Huang, Chunhua Tan, Xuguang Huang,
“Simultaneous measurement of refractive index and temperature based on a core-offset Mach–Zehnder interferometer combined with a fiber Bragg grating”, Sensors and Actuators A: Physical, vol. 209, (2014), pp. 73–77.
[10]P. Lu, L. Men, K. Sooley, Q. Chen, “Tapered fiber Mach–Zehnder interferometer for simultaneous measurement of
refractive index and temperature, Applied Physics Letters, vol. 94 (2009) 1311101–1311103.