Validity of data collected by
telephone survey: a comparison
of VIGITEL 2008 and the
‘Saúde
em Beagá’
survey
Validade de estimativas obtidas
por inquérito telefônico:
comparação entre VIGITEL 2008
e Inquérito Saúde em Beagá
Aline Dayrell FerreiraI,II
Cibele Comini CésarI,II,III
Deborah Carvalho MaltaIV
Amanda Cristina de Souza AndradeI
Cynthia Graciane Carvalho RamosI
Fernando Augusto ProiettiI,II
Regina Tomie Ivata BernalIV,V
Waleska Teixeira CaiaffaI,II
IUrban Health Observatory of Belo Horizonte (OSUBH) at the Medical School of
Universidade Federal de Minas Gerais (UFMG) – Belo Horizonte (MG), Brazil II Post graduation program in Public Health at the Medical School of
Universidade Federal de Minas Gerais (UFMG) – Belo Horizonte (MG), Brazil IIIStatistics department of Instituto de Ciências Exatas of Universidade Federal de
Minas Gerais (UFMG) – Belo Horizonte (MG), Brazil
IVHealth Surveillance Secretariat of the Ministry of Health – Brasília (DF), Brazil VFaculdade de Saúde Pública of Universidade de São Paulo (FSP/USP) – São Paulo (SP), Brazil
Study carried out at the Urban Health Observatory of Belo Horizonte - Belo Horizonte (MG), Brazil.
Financial Support: National Fund of the Ministry of Health, National Council of Technological and Scientific Development (CNPq) and Foundation for Research Support of Minas Gerais (FAPEMIG) and Department of Health and Human Services – National Institutes of Health – Fogarty International Center.
Correspondence to: Aline Dayrell Ferreira – Av. Alfredo Balena, 190, 6º andar sala 625 – Bairro Santa Efigênia – CEP: 31130-100 – Belo Horizonte (MG) – Brasil – E-mail: dayrellferreira@yahoo. com.br.
Conflict of interest: nothing to declare.
Abstract
Objective: To assess the validity of the estimates obtained through telephone survey and to measure the impact of the post-stratiication weighting factor to adjust estimates. Methods: he same questionnaire was completed by two independent samples of the population living in the municipal-ity of Belo Horizonte cmunicipal-ity (Barreiro and West regions). One sample (n=440) completed the questionnaire of VIGITEL 2008 (telephone survey), and the other (n=4,048) of Saúde em Beagá (face to face household interview). he results of the two samples for 18 health-related variables were compared by means of test statistics. At irst, residents who had a landline telephone line were compared to those who reported not having a telephone line; then, VIGITEL estimates, with and without post-stratiication weight, were compared with Saúde em Beagá estimates. Results: Subjects who owned a landline telephone line had indicators for better economic conditions (housing, schooling, and skin color); higher prevalence of chronic diseases; lower exposure to risk factors for chronic diseases; and improved access to health services, compared to the those who reported not having a telephone line. Most VIGITEL estimates (without post-stratii-cation weight) were similar to the sample of Saúde em Beagá that reported owning a residential landline, showing no major impact of the methodology to obtain this data (lower information bias). Even without post-stratiication weight, VIGITEL estimates were similar to those of Saúde em Beagá. With post-stratiication weight, the estimates of “number of residents”, “skin color” and “physical activity” did not difer from those obtained by the face to face survey. Conclu-sion: he results of both surveys were very similar. Because of the lower cost, the telephone interview is a good option in public health for the behavioral risk-factor surveillance system.
Resumo
Objetivo: Verificar a validade externa das estimativas obtidas por inquérito telefôni-co, e o impacto do uso do fator de ponde-ração pós-estratificação na correção das estimativas. Métodos: Foram utilizadas informações de moradores das regiões Oeste e Barreiro de Belo Horizonte (MG), obtidas por inquérito telefônico VIGITEL 2008 (n=440) e por inquérito domiciliar, realizado face a face, Saúde em Beagá (SB) (n=4.048). Estimativas de variáveis relevantes para vigilância epidemiológi-ca foram comparadas entre os estudos, por meio das estatísticas de teste. Inicial-mente, compararam-se grupos segundo a posse de linha telefônica fixa e em segui-da as estimativas do VIGITEL, com e sem a utilização de peso pós-estratificação, com as estimativas do SB. Resultados: Indivíduos que possuíam telefone fixo residencial apresentaram marcadores de melhores condições econômicas (local de moradia, escolaridade e cor de pele), maior prevalência de doenças crôni-cas não transmissíveis (DCNT), menor exposição a fatores de risco para DCNT e maior acesso/utilização de serviços de saúde, quando comparados aos demais. A maioria das estimativas do VIGITEL (sem o uso do peso pós-estratificação) foi semelhante às estimativas para a amostra do SB que referiu ter telefone fixo residencial, demonstrando não haver grande impacto da metodologia utilizada na obtenção dos dados (reduzido viés de informação). Mesmo sem utilizar o fator de pós-estratificação, as estimativas do VIGITEL se assemelharam às do SB; após a ponderação, as poucas estimativas vicia-das (número de moradores, cor de pele e atividade física) não diferiram mais das obtidas pelo inquérito face a face exceto para a variável “ter plano de saúde”, cuja correção da estimativa reduziu a diferen-ça observada, e para as variáveis “consu-mo de verduras/legumes” e “tabagis“consu-mo atual”, em que não foi possível corrigir as estimativas. Conclusão: Recomenda-se a
vigilância epidemiológica de DCNT por meio de inquéritos telefônicos porque fornecem estimativas aproximadas do que seria esperado para a população total, com menores investimentos financeiros e menor tempo.
Introduction
he health-sickness process is dynamic and results in constant changes in the proile of the illness and exposure to risk factors. In this epidemiological context, the systematic monitoring of the population health proile, as well as habits, behaviors and access to medical care is relevant. In Brazil, there are health monitoring systems which are directed to this purpose. According to Viacava1, health statistics of continuous registration systems in a country can be gathered in four broad areas: 1) Vital statistics by the Brazilian Institute of Geography and Statistics (IBGE); 2) statistics regarding hospital services, like the health monitoring systems, the outpa-tient information system, and the basic care information system; 3) statistics related to epidemiological surveillance and the monitoring of health status, which are organized in the notiication system, the reporting of live births, and the mortality data system; and 4) statistics regarding public funds and budget of the health system, gathered in the Brazilian public budget for health.
However, information is still insuicient to respond to management needs2, thus, it is essential to conduct health surveys for the monitoring, planning and programming of interventions in health1-3.
Even though the surveys are tradi-tionally used to obtain population infor-mation, there are many challenges4, and one of the most relevant one is the chance to compare studies, which is difficult due to the difference between methodologies.
Many population surveys are performed by face to face household interviews. Such methodology requires personal contact between interviewer and interviewee, which is usually a long and expensive process that compromises the systematic and periodic data collection – ideal practice for knowledge, detection or prevention of any change in determining and condi-tioning health factors of a population. In
the attempt to enable the frequent perfor-mance of health population surveys, which are capable of being an eicient tool for epidemiological surveillance, new strat-egies have been adopted and tested. As an example, telephone surveys have been increasingly used in the past 20 years5. he low cost and the ability to rapidly collect data are natural advantages of any surveil-lance system based on telephone surveys5-7. However, it has the limitation of excluding individuals who live in households without a landline telephone line6.
Despite being a more feasible method-ology for the context of health surveillance, it is important to understand if the infor-mation obtained by telephone surveys repre-sents the reality of the studied population, and at what extent these data may be under or overestimated. hus, this paper was conducted in order to check for the external validity of the estimates obtained by the telephone survey, considering variables of interest in health and the impact of post-stratiication weighting factors to adjust the estimates.
Methods
Information from the Telephone-based Surveillance of Risk and Protective Factors for Chronic Diseases (VIGITEL) and “Saúde em Beagá (SB)” was used. hese surveys were chosen due to the following features: a) diferent data collection methodology (telephone and face to face); 2) instru-ments comprised of similar questions, which enables comparison; 3) both were performed during the same period of time, in 2008, and with the same population (residents of Belo Horizonte).
Telephone-based Surveillance of Risk and Protective Factors for Chronic Diseases (VIGITEL)
the frequency and distribution of the main determinants of chronic non-communi-cable diseases (CNCDs) and their associated risk factors8.
To meet the objective of this article, VIGITEL data regarding the population of Belo Horizonte (BH) living in the two sanitary districts demonstrated by the survey “Saúde em Beagá” – Oeste and Barreiro – in 2008 were considered. he 440 interviews performed in these regions were identiied among the total of 2,016 interviews, based on census tracts.
Sampling process
he sampling procedures aimed to obtain probability samples of the adult population living in households with at least one landline telephone line in the year.
he sample was selected in two phases: telephone lines and residents aged 18 years or more. he telephone lines were system-atically drawn from the electronic records of landline telephone lines of the companies in the city. After the selection of an eligible telephone line, the participants were drawn by a table of random numbers, which was also used to obtain the list of residents by gender and age group9.
Data collection
Telephone surveys were conducted from April to December, 2008. A standard questionnaire with questions on the following subjects was used: a) demographic and socioeconomic characteristics (age, gender, marital status, skin color, schooling, number of people and rooms in the household, number of adults and number of telephone lines); b) character-istics related to eating patterns and physical activity (frequency of fruit, vegetables and salad intake and frequency and duration of physical exercise and the habit of watching television); c) referred weight and height; d) frequency of cigarette and alcohol consumption; e) self-reported health status and reported morbidity.
Weighting
hree weighting factors were deined in order to adjust the sampling trends. he irst factor (inverse to the number of telephone lines in the household of the interviewee) was determined to adjust the higher chance individuals living in households with more than one telephone line had to be selected (weight factor 1); the second (number of adults in the household) was deined to adjust the lower chance individuals living in households with more adults had to be selected (weight factor 1). he third weighting factor, a post-stratiication factor, was determined to reduce the bias caused by the lack of universal telephone coverage, that is, to equalize the sociodemographic composition of the analyzed sample and the reference adult population. By incor-porating the two irst weighting factors, the sample was distributed in 36 sociodemo-graphic categories resulting from the strati-ication as to gender (male and female), age group (18-24, 25-34, 35-44, 45-54, 55-64, and
≥65 years) and schooling (0-8, 9-11, and ≥12 years). Based on estimates from the Census 200010, the distribution of the population living in the two sanitary districts of Belo Horizonte was obtained. he post-strati-ication weight was a result from the ratio between the relative frequency of individuals in VIGITEL and the census population in each sociodemographic category.
Saúde em Beagá (SB)
Sampling process
he data were collected in two of the nine sanitary health districts (SD) of Belo Horizonte: Oeste and Barreiro, which were selected because they were: a) districts wherePhysical Academies would be estab-lished after the survey, enabling the pre-in-tervention assessment; b) geographically close, in order to ensure that data could be collected in the expected time and within the budget; c) districts with important internal heterogeneity as to diferent demographic, socioeconomic and health indicators, enabling the identiication of factors that are associated with health determinants. Altogether, these SD gather a population of 530,892 inhabitants, which is subdivided into 568 census tracts10.
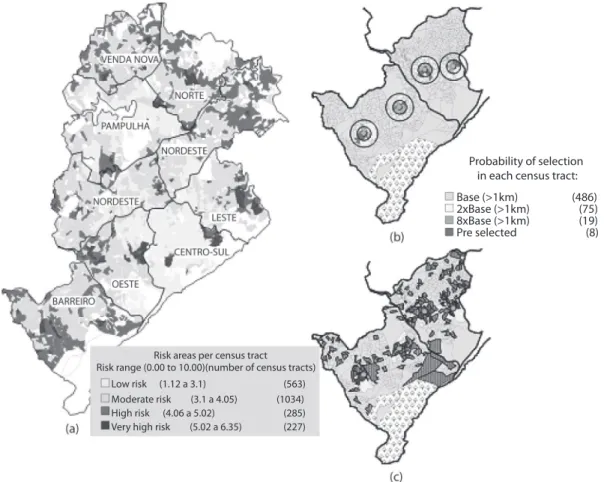
he sampling process aimed at the repre-sentativity of BH as to health inequities, and a sample divided into three strata of the Health Vulnerability Index (HVI). he HVI is a composite index whose geographic unit is SC, used as a summary measure to show inequalities in the epidemiological proile of diferent social groups, gathering items such as: sanitation, housing, education, income and health14 (Figure 1). he adopted methodology was a proportional sample, stratiied by conglomerates in three phases: census tract, address (household) and resident (an adult).
he selection probability was deined to draw the census tracts according to the proximity to the Physical Academies that would be established in both districts. he two tracts that were closer to each academia
participated in the survey without a draw (selection probability of one). When compared with tracts that were more than 1 km far from any academia, those that were less than 500 meters far and the ones located from 500 meters to 1 km had 8 to 4 times more chances of being selected, respectively.
After the selection of tracts, a simple random sample of addresses registered in SMSA-BH database was performed. Afterwards, participants were drawn by
means of the table of random numbers, according to the same methodology adopted by VIGITEL.
Data collection
Data were collected from August 2008 to February 2009 by standard instruments, used by previously trained interviewers. All the adults answered a questionnaire structured in the following modules: a) socioeconomic (individual and household characteristics, including information on number of landline telephone lines); b) social determinants of health (social capital, social cohesion, violence, perception of neighborhood); c) health (use and access to medical care, quality of life, reported height, weight and morbidity); d) habits and behaviors (eating, physical activity, smoking, alcohol consumption and use of other drugs).
Weighting
One weighting factor was deined based on the characteristics of the sampling process adopted for the survey Saúde em Beagá, considering that: each SC was selected with diferent probabilities according to the proximity of Physical Academies; the total of households varies between SC (based on Census 2000), thus changing the selection probability, which totally depends on the total of residents in the household. Also, the post-stratiication weight was used, being determined according to the same weighting features established for VIGITEL data.
Variables of interest
hypercholesterolemia and excess weight; c) habits and behaviors: weekly intake of fruits, vegetables and salad; alcohol consumption; smoking and physical activity; use/access to health services: those who have done vaginal smears, mammog-raphy, and health insurance (Chart 1).
As to reported morbidity, the partic-ipant was asked to consider the diseases or clinical conditions that were diagnosed by a health professional. Self-reported infor-mation regarding weight and height in both surveys were considered to classify excess weight (body mass index ≥25 kg/m2). In relation to habits and behaviors, drinking ive or more doses in one day for the past 30
days was considered abusive for men, while for women the consumption of four or more doses was seen as abuse; the smoking habit was characterized by the variable currently smoking.
Data analysis
A descriptive analysis was conducted by calculating measures of central tendency, variability and frequency distribution. he diferences between the proportions in each survey were assessed by the chi-square test, and the diferences between means were analyzed by the Student’s t-test. Diferent proiles were considered as p≤0.05.
Figure 1 . Sampling process “Saúde em Beagá” survey, 2008.
Figura 1. Critério definido para o processo amostral do inquérito domiciliar Saúde em Beagá, 2008.
Probability of selection in each census tract:
Base (>1km) 2xBase (>1km) 8xBase (>1km) Pre selected
(486) (75) (19) (8)
Risk areas per census tract Risk range (0.00 to 10.00)(number of census tracts)
Low risk (1.12 a 3.1)
Moderate risk (3.1 a 4.05)
High risk (4.06 a 5.02)
Very high risk (5.02 a 6.35)
(563) (1034) (285) (227)
(a) Health district of Belo Horizonte/census tracts classification according to the Health Vulnerability Index (HVI); (b) sampling process: criteria for selection of the census tracts; (c) census tracts selected
At irst, comparative analyses were conducted between the participants of
Saúde em Beagá, who were brought together for owing a telephone line (individuals who reported having at least one landline telephone line – SBwith landline telephone line – versus
those who reported not owning a landline telephone line – SBwithout landline telephone line). Such comparison led to the assumption as to what would be the expected behavior for the estimates from VIGITEL. hus, consid-ering that the telephone survey neces-sarily excludes those who do not own a
telephone line, its estimates are expected to be similar to the proile of sample SBwith
landline telephone line (hypothesis: VIGITEL=SBwith landline telephone line). To check the validity of this hypothesis, estimates from VIGITEL were compared with estimates from Saúde em Beagá, without considering the post-strat-iication factor, related to those who own a telephone line.
Estimates obtained by VIGITEL were compared to data from Saúde em Beagá, without considering post-stratiication weight, in order to verify if the deinitions
Chart 1. VIGITEL and Saúde em Beagá questionnaires and variables studied.
Quadro 1. Questionários elaborados para realização do VIGITEL – 2008 e do inquérito Saúde em Beagá, e variáveis utilizadas nas comparações atuais.
VIGITEL 2008 SAÚDE EM BEAGÁ QUESTIONS FOR CURRENT ANALYSIS DEMOGRAPHIC
Number of residents in the household: 1 / 2 / 3 / 4 / 5 or more*
Age: 18 to 24 years / 25 to 34 years / 35 to 44 years / 45 to 54 years / 55 to 64 years / 65 years or more* Gender: Male / Female*
Your skin color is:
White / Black / Brown / Yellow (eastern) / Red (Indigenous)
What is the color of your skin? White / Black / Indigenous / Yellow (eastern) / Brown
Skin color White / Non-white
Until which grade did you study? Never / Elementary school
Secondary school, technical, normal or scientific or high school / higher education / post-graduation.
Until which grade did you go to school? Never / Adult literacy / Incomplete or complete elementary school
Incomplete or complete secondary school / professionalization / higher education (university) incomplete or complete / Post-graduation
Years of schooling Less than 9 years 9 years or more
What is your current marital status? Single / Married, with a partner / Widow / Separated, divorced
As to your marital status, you are currently Single/Married/Divorced / Separated –unofficial separation / Widow / Living with a partner (consensual)
Marital status
With a partner (married, living together) / Without a partner (single, Widow/ Separated, divorced)
HEALTH-RELATED EVENTS
You would classify your health status as: Very good/ Good / Fair / Poor / Very poor
Generally speaking, you would say your health is: Very good / Good / Reasonable / Poor / Very poor
Self-reported health status
Very good, good, reasonable / Poor, very poor
Has any doctor ever told you you have:
High blood pressure? No/ yes High cholesterol or triglycerides? No/ yes
Has any doctor or health Professional ever told you you have
High blood pressure (Hypertension)?No/ yes
HIgh cholesterol? No/ yes
Arterial hypertension No/ yes High cholesterol
No/ yes
Do you know how much you weight (even if it is a close number)? What about your height?
Do you know how much you weight (even if it is a close number)? What about your height?
Excess weight
No (BMI<25kg/m2) /Yes (BMI≥25kg/
of sampling weight were able to ensure the validity of the estimates.
Weighting factors were incorporated to the analyses with the command svy of the Stata® 10.0 software15.
Results
Information regarding 440 participants of VIGITEL who live in the regions of Oeste and Barreiro, in Belo Horizonte (21.8% of the total sample of the city) and 4,048 individuals who had a face to face interview for Saúde em Beagá was analyzed.
Out of the participants of Saúde em Beagá, 79.4% (considering sample weight of 78.6%) reported having a landline telephone line. hey (SBwith landline telephone line) lived in households with more residents
(4.3 versus 4.0 residents, p=0.015) and in places with a lower HVI (3.1 versus 3.5, p≤0.001); mean age was higher (39.8 versus 34.2 years; p≤0.001) and a lower proportion was married/had a partner (50.2% versus 58.1%), when compared to those who reported not owning a landline telephone line. here were diferences also in relation to individual features regarding socioeco-nomic status: most were white skinned (37.7% versus 22.2%; p≤0.001) and had more years of schooling (≥9 years; 46.8% versus 27.3%; p≤0.001). Groups did not difer as to gender (Table 1).
Besides the diferences observed for demographic variables, both groups difered in relation to all the variables that characterized events related to health, habits and behaviors, and use or access to
Chart 1. Continuation
Quadro 1. Continuação
HABITS AND BEHAVIORS How often do you eat fruits in a week?
Never / Almost never / Once or twice a week / 3 or 4 times a week / 5 or 6 times a week / every day
How often do you eat fruits in a week? Never / Once or twice a week / 3 or 4 times a week / 5 or 6 times a week / Every day
Intake of fruits
Less than 5 days a week / Five days a week or more
How often do you eat at least one type of vegetable in a week? Never / Almost never / Once or twice a week / 3 or 4 times a week / 5 or 6 times a week / every day
How often do you eat of vegetables in a week?
Never / Once or twice a week / 3 or 4 times a week / 5 or 6 times a week / every day
Intake of vegetables
Less than 5 days a week / Five days a week or more
In the past 30 days, did you have more than 5 doses (men) or 4 doses (women) of alcohol in only one occasion?
No / Yes
In the past 30 days, how many doses of alcohol did you have on the same day?
Did you have more than 5 doses (men) or 4 doses (women) of alcohol in only one occasion?
No / Yes
Do you smoke?
No/Yes, every day/Yes, occasionally
Are you currently smoking? No/Yes, every day/Yes, occasionally
Are you currently smoking? No / Yes
In the past three months, have you practised physical activities? No / yes USE/ACCESS TO MEDICAL CARE
Have you ever had a Papanicolaou test? No / Yes * Have you ever had a
mammo-graphy? No / yes
Have you ever had a mammography? (Women > 40 years old)? No / Yes
Have you ever had a mammo-graphy? (Women > 40 years old)? No / Yes
Do you have health insurance? Yes, only one / Yes, more than one / No
Do you have any private health insurance? Yes. With my job, pension / Yes. Not connected with my job, pension / No
medical care, except for self-assessment of health status and alcohol consumption considered as risk. Arterial hypertension (p=0.035), hypercholesterolemia (p<0.001) and excess weight (p=0.003) were more prevalent among individuals of SBwith landline
telephone line when compared to the others (SBwithout landline telephone line). he former also reported healthier behaviors, presenting better eating habits (p≤0.001, for the intake of fruits and vegetables/salads), higher prevalence of physical activity (43.4% versus 31.6%; p≤0.001) and a lower proportion of smoking (19.8% versus 24.9%; p≤0.046). hey also presented more favorable characteristics related to the access to medical care than the SBwithout
landline telephone line, especially regarding vaginal smears (p=0.029) and mammography (p≤0.001), as well as having private health insurance (p≤0.001) (Table 1).
Participants of VIGITEL difered from the ones of SBwith landline telephone line in relation to the number of residents (3.9 versus 4.3; p=0.003), mean age (42.4 versus 39.8 years; p=0.006), schooling (63.1% versus 46.8%; p≤0.001), smoking (14.3% versus 19.8%; p=0.019) and health insurance (58.7% versus 44.5%; p≤0.001). Despite being diferent, the estimates related to these variables were usually more similar to the SBwith landline telephone
line proile than to those of SBwithout landline telephone line (except for the intake of vegetables and salads). For the other 12 variables, VIGITEL was similar to the SBwith landline telephone line group (Table 1).
When compared to the SBwithout landline
telephone line group, the sample from VIGITEL presented a higher socioeconomic status (according to skin color and schooling), higher prevalence of self-reported diseases (arterial hypertension, hypercholester-olemia and excess weight), healthier habits as to the intake of fruits, physical activity and smoking and better indicators of access to medical care (Table 1).
Without post-stratiication weight to obtain estimates from VIGITEL, 8 out of the 18 variables selected for this study difered from the estimates obtained by SB: “number
of residents”, “age”, “skin color”, “schooling”, “weekly intake of vegetables/salads”, “physical activity”, “currently smoking” and “health insurance” (Table 2).
he introduction of the post-stratiication weight favored the existence of estimates that were similar to those of the face to face household survey. With this technique, the variables age and schooling were similar. he estimates “number of residents”, “skin color” and “physical activity” were adjusted. Despite remaining diferent, the estimates for “health insurance” were close to those obtained by Saúde em Beagá, and the diference decreased from 18.9% to 11.4%; however, this could not be observed for the variables related to habits and behaviors (intake of vegetables/salads and smoking). Eventually, out of the 18 selected variables, 15 had bias free estimates to be compared to the face to face survey (Table 2).
Discussion
he information from the telephone survey VIGITEL in relation to the individuals living in the regions of Oeste and Barreiro, in Belo Horioznte, were analyzed in comparison with the household survey Saúde em Beagá, conducted in the same regions in 2008. Individuals with and without a telephone line signiicantly difered as to the studied variables. Without the post-stratiication weight for VIGITEL, 8 out of the 18 selected variables were diferent in relation to SB. he use of post-stratiication in VIGITEL approximated the estimates of both surveys and the 18 variables; 15 were similar and only 3 (intake of vegetables/salads, smoking and health insurance) presented diferent frequencies.
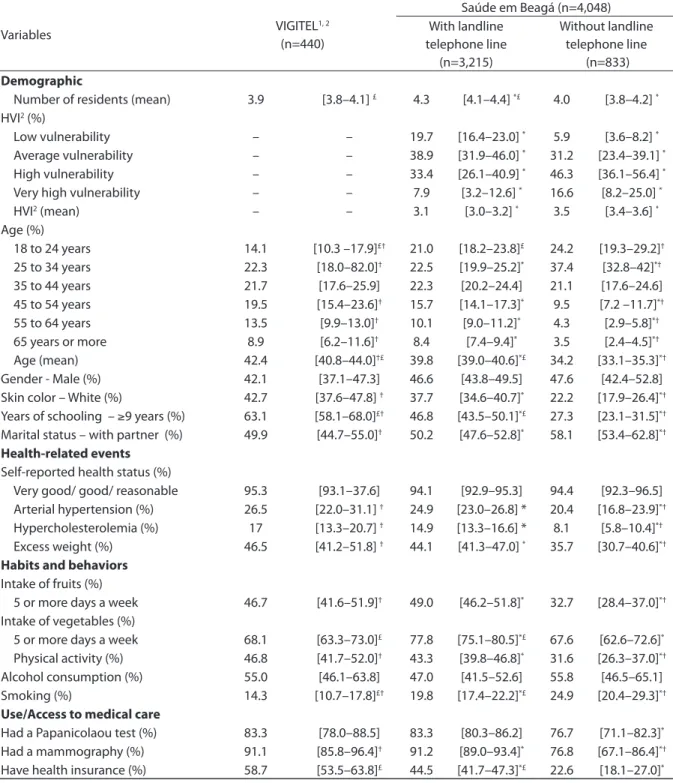
1Considering the weighting factors (1 and 2); 2Health Vulnerability Index; *p value≤0,05 – comparing Saúde em Beagá (with landline telephone line) and
Saúde em Beagá (without landline telephone line); £p value≤0,05 – compare VIGITEL (weight 1 and 2) and Saúde em Beagá (with landline telephone line); †p
value ≤0,05 – compare VIGITEL (weight 1 and 2) e Saúde em Beagá (without landline telephone line)
1Valores obtidos após considerar fatores 1 e 2 de ponderação; 2índice de vulnerabilidade à saúde; *valor p≤0,05 – comparação Saúde em Beagá com telefone e
Saúde em Beagá sem telefone; £valor p valor≤ 0,05 – comparação VIGITEL (pesos 1 e 2) e Saúde em Beagá com telefone; †valor p ≤0,05 – comparação VIGITEL (pesos
1 e 2) e Saúde em Beagá sem telefone
Table 1. Comparison between VIGITEL –2008 crude estimates (without post-stratification weight) and Saúde em Beagá
estimates according to owning a residential telephone line, Belo Horizonte (West and Barreiro regions), 2008
Tabela 1. Comparação entre estimativas brutas (sem uso de fator de ponderação pós-estratificação) obtidas pelo VIGITEL – 2008 com as estimativas obtidas pelo Saúde em Beagá para os subgrupos segundo posse de linha telefônica residencial fixa, Belo Horizonte (regiões Oeste e Barreiro), 2008.
Variables VIGITEL
1, 2
(n=440)
Saúde em Beagá (n=4,048) With landline
telephone line (n=3,215)
Without landline telephone line
(n=833)
Demographic
Number of residents (mean) 3.9 [3.8–4.1] £ 4.3 [4.1–4.4] *£ 4.0 [3.8–4.2] *
HVI2 (%)
Low vulnerability – – 19.7 [16.4–23.0] * 5.9 [3.6–8.2] *
Average vulnerability – – 38.9 [31.9–46.0] * 31.2 [23.4–39.1] *
High vulnerability – – 33.4 [26.1–40.9] * 46.3 [36.1–56.4] *
Very high vulnerability – – 7.9 [3.2–12.6] * 16.6 [8.2–25.0] *
HVI2 (mean) – – 3.1 [3.0–3.2] * 3.5 [3.4–3.6] *
Age (%)
18 to 24 years 14.1 [10.3 –17.9]£† 21.0 [18.2–23.8]£ 24.2 [19.3–29.2]†
25 to 34 years 22.3 [18.0–82.0]† 22.5 [19.9–25.2]* 37.4 [32.8–42]*†
35 to 44 years 21.7 [17.6–25.9] 22.3 [20.2–24.4] 21.1 [17.6–24.6] 45 to 54 years 19.5 [15.4–23.6]† 15.7 [14.1–17.3]* 9.5 [7.2 –11.7]*†
55 to 64 years 13.5 [9.9–13.0]† 10.1 [9.0–11.2]* 4.3 [2.9–5.8]*†
65 years or more 8.9 [6.2–11.6]† 8.4 [7.4–9.4]* 3.5 [2.4–4.5]*†
Age (mean) 42.4 [40.8–44.0]†£ 39.8 [39.0–40.6]*£ 34.2 [33.1–35.3]*†
Gender - Male (%) 42.1 [37.1–47.3] 46.6 [43.8–49.5] 47.6 [42.4–52.8] Skin color – White (%) 42.7 [37.6–47.8] † 37.7 [34.6–40.7]* 22.2 [17.9–26.4]*†
Years of schooling – ≥9 years (%) 63.1 [58.1–68.0]£† 46.8 [43.5–50.1]*£ 27.3 [23.1–31.5]*†
Marital status – with partner (%) 49.9 [44.7–55.0]† 50.2 [47.6–52.8]* 58.1 [53.4–62.8]*† Health-related events
Self-reported health status (%)
Very good/ good/ reasonable 95.3 [93.1–37.6] 94.1 [92.9–95.3] 94.4 [92.3–96.5] Arterial hypertension (%) 26.5 [22.0–31.1] † 24.9 [23.0–26.8] * 20.4 [16.8–23.9]*†
Hypercholesterolemia (%) 17 [13.3–20.7] † 14.9 [13.3–16.6] * 8.1 [5.8–10.4]*†
Excess weight (%) 46.5 [41.2–51.8] † 44.1 [41.3–47.0] * 35.7 [30.7–40.6]*† Habits and behaviors
Intake of fruits (%)
5 or more days a week 46.7 [41.6–51.9]† 49.0 [46.2–51.8]* 32.7 [28.4–37.0]*†
Intake of vegetables (%)
5 or more days a week 68.1 [63.3–73.0]£ 77.8 [75.1–80.5]*£ 67.6 [62.6–72.6]*
Physical activity (%) 46.8 [41.7–52.0]† 43.3 [39.8–46.8]* 31.6 [26.3–37.0]*†
Alcohol consumption (%) 55.0 [46.1–63.8] 47.0 [41.5–52.6] 55.8 [46.5–65.1] Smoking (%) 14.3 [10.7–17.8]£† 19.8 [17.4–22.2]*£ 24.9 [20.4–29.3]*† Use/Access to medical care
Had a Papanicolaou test (%) 83.3 [78.0–88.5] 83.3 [80.3–86.2] 76.7 [71.1–82.3]*
Had a mammography (%) 91.1 [85.8–96.4]† 91.2 [89.0–93.4]* 76.8 [67.1–86.4]*†
they were less exposed to risk factors for chronic non-communicable diseases, such as smoking. Also, this study demon-strated a better proile as to the intake of fruits and vegetables, besides the more frequent performance of physical activities when compared to those who do not own a telephone line. As to the use and access to
medical care, those who reported having a landline telephone line had more access to vaginal smears, mammography (similar to the indings by Segri et al.16) and had health insurance, when compared to the others.
he diferences between the groups as to the parameter of owning a telephone line may signiicantly compromise the
Table 2. Comparison between VIGITEL – 2008 estimates (with and whithout post-stratification weight) and Saúde em Beagá estimates, Belo Horizonte (West and Barreiro regions), 2008
Tabela 2. Comparação entre estimativas obtidas pelo VIGITEL –2008, com e sem o fator de ponderação pós-estratificação, com as estimativas do Saúde em Beagá, Belo Horizonte (regiões Oeste e Barreiro), 2008.
Variables VIGITEL
1, 2
(n=440)
VIGITELfinal weight2
(n=440)
Saúde em Beagá (n=4,048)
Demographic
Number of residents (mean) 3.9 [3.8–4.1]† 4.2 [4.1–4.3] 4.2 [4.1–4.3]†
Age (%)
18 to 24 years 14.1 [10.3 –17.9]† 21.6 [13.2–30.1] 21.7 [19.2–24.2]†
25 to 34 years 22.3 [18.0–82.0] 25.7 [18.1–33.2] 25.7 [23.4–28.1] 35 to 44 years 21.7 [17.6–25.9] 22 [16.9–27.0] 22 [20.2–23.9] 45 to 54 years 19.5 [15.4–23.6]† 14.4 [10.7–18.2] 14.4 [13.0–15.7]†
55 to 64 years 13.5 [9.9–13.0]† 8.8 [5.8–11.7] 8.8 [7.9–9.8]†
65 years or more 8.9 [6.2 - 11.6] 7.5 [4.8–10.2] 7.3 [6.5–8.2] Age (mean) 42.4 [40.8–44.0]† 38.6 [37.9–39.3] 38.6 [37.0–39.3]†
Gender - male (%) 42.1 [37.1–47.3] 46.7 [45.5–60.9] 46.8 [44.1–49.6] Skin color – white (%) 42.7 [37.6–47.8]† 34.6 [28.1–41.2] 34.4 [31.6–37.1]†
Years of schooling – ≥ 9 years (%) 63.1 [58.1–68.0]† 54.6 [47.1–62.1] 55.5 [52.8–58.2]†
Marital status – with partner (%) 49.9 [44.7–55.0] 47.2 [39.6–54.9] 48.0 [45.8–50.3]
Health-related events
Self-reported health status (%)
Very good/ good/ reasonable 95.3 [93.1–37.6] 95.2 [92.0–98.4] 94.2 [93.0–95.3] Arterial hypertension (%) 26.5 [22.0–31.1] 21.5 [16.6–26.5] 23.9 [22.3–25.6] Hypercholesterolemia (%) 17 [13.3–20.7] 13.7 [10.1–17.5] 13.5 [12.1–14.9] Excess weight (%) 46.5 [41.2–51.8] 40.2 [32.9–47.5] 42.5 [40.0–45.1]
Habits and behaviors
Intake of fruits (%)
5 or more days a week 46.7 [41.6–51.9] 39.3 [32.3–46.3] 45.5 [42.8–48.2] Intake of vegetables (%)
5 or more days a week 68.1 [63.3–73.0]† 60.5 [52.2–68.8]£ 75.6 [73.1–78.2]†£
Physical activity (%) 46.8 [41.7–52.0]† 48.5 [40.7–56.2] 40.8 [37.8–43.9]†
Alcohol consumption (%) 55 [46.1–63.8] 60.1 [48.7–71.5] 48.8 [44.0–53.7] Smoking (%) 14.3 [10.7–17.8]† 13.9 [9.3–18.5] £ 20.9 [18.8–22.9]†£ Use/Access to medical care
Had a Papanicolaou test (%) 83.3 [78.0–88.5] 74 [60.6–87.4] 81.9 [79.3–84.5] Had a mammography (%) 91.1 [85.8–96.4] 88.8 [81.7–95.9] 89.2 [87.0–91.5] Have health insurance (%) 58.7 [53.5–63.8]† 51.2 [43.4–58.9]£ 39.8 [37.1–42.5]†£
1Considering the weight factors (1 and 2); 2Considering the weighting factors (1 and 2 and 3); †p value≤0,05 – comparing VIGITEL (weight 1 and 2) and Saúde
em Beagá £p value≤0,05 – comparing VIGITEL (weight 1 and 2 and 3) and Saúde em Beagá
1 Valores obtidos considerando fatores 1 e 2 de ponderação (fator 1 x 2 ); 2 valores obtidos após considerar fator de ponderação final (fator 1 x 2 x 3); †valor p ≤0,05 –
results obtained by telephone survey. hose who do not own a telephone line are necessarily excluded from the sample of telephone surveys, which results in a sample with better social conditions. On the other hand, in face to face surveys the loss is diferentiated, usually of the highest income stratum, due to refusal or impossi-bility of access4, resulting in a sample with worst socioeconomic conditions. Such characteristics contribute with the trend of a sociodemographic proile that is diferent among the participants of telephone surveys and the participants of face to face household surveys.
he social condition is considered as an essential cause for diferent factors associated to health17. In this sense, information on health status, habits and behaviors and use/access to medical care tend to follow the sociodemographic proile of the sample. Individuals with a lower income, fewer years of schooling and non-white skin presented a negative self-reported health status when compared to complementary groups18. Likewise, smoking has been associated with lower family income and fewer years of maternal schooling19, and the access to medical care is less frequent among the youngest, of the economic classes D/E20. Some studies have demonstrated that reported morbidity is signiicantly more prevalent in the segments of lower socioeconomic level21. Adjusting by age and gender (non-presented in this article), there was no association between owning a telephone line and the preva-lence of arterial hypertension; however, as demonstrated in other studies, places that are more vulnerable to health have higher chances to report this chronic disease. However, the same was not observed for hypercholesterolemia and excess weight, whose prevalence was higher in the sample that reported owning a telephone line (more privileged social condition), which may be related to the more frequent access to medical care.
Comparing the estimates from VIGITEl and SB, according to telephone lines (SBwith
landline telephone line and SBwithout landline telephone line – Table 1), it was possible to observe equivalence between VIGITEL and SBwith landline telephone line. he initial hypothesis is that if there were no diferences in the data from each type of interview (face to face or telephone), the estimates obtained by VIGITEL (without the post-stratiication weighting factor) would be similar to those obtained for a sample of individuals who own a landline telephone line (SBwith landline telephone line).
Out of the 18 analyzed variables, only 6 did not meet this criterion: three were sociodemographic variables, being two related to habits and behaviors and one to access to medical care. Despite the statis-tically signiicant diferences observed for the variables “age”, “schooling”, “currently smoking” and “health insurance”, they were not so prevalent when comparing estimates obtained by VIGITEL and the subgroup SBwith landline telephone line, than at the comparison of VIGITEL and SBwithout landline
telephone line. his could not be observed as to “number of residents” and “weekly intake of vegetables/salads”; in these cases, the diferences between estimates were not as prevalent when comparing VIGITEL with the subgroup SBwithout landline telephone line.
the other hand, face to face interviews may cause the “desirable” answer, which favors socially unacceptable risk behaviors to be underestimated.
Despite the signiicant diferences between individuals as to owning a telephone line, VIGITEL estimates were similar to those of Saúde em Beagá, even without considering post-stratiication weight (only 8 out of the 18 selected variables had diferent estimates – Table 2). his similarity was possibly due to the broad telephone coverage in Belo Horizonte and the studied regions, conirming the indings by Bernal and Silva22, which pointed to a greater reliability of the estimates for telephone coverage higher than 70%.
However, regardless of the local telephone coverage, the use of the post-stratiication weighting factor is essential to analyze the data obtained by telephone surveys. It has become usual to adjust the distribution of the telephone sample to the composition of the total population according to characteristics associated with owning a telephone line8,22,23. With the use of post-stratiication weight (term used for the technique of direct standard-ization), the basic assumption is that the non-response process – including omission to a speciic question and non-partici-pation – is non-informative and ignorable. A process can be non-informative and ignorable when the probability of non-re-sponse does not depend on the closure, when the variables are independent and with the inclusion of stratiication variables24. In other words, in order to estimate the prevalence of a condition like smoking, for example, the assumption with the use of post-stratiication is that in each subgroup determined by the post-stratiication variables, the proportion of smokers will not depend on the partici-pation of the individual in the survey. So, the proportion of smokers among those who did not respond will be similar to that among those who responded25. Only with this assumption it is possible to use the
information of those who responded to complete the data of the ones who were not interviewed in each post-stratiication subgroup.
Just as it was observed in this study, Galán, Rodríguez-Artalejo and Zorrilla5 compared estimates obtained by telephone survey (n=1,391) and those obtained by face to face interview (n=739) in Madrid/Spain (1999/2000) and concluded that there were no diferences to obtain information about risk factors related with behavior and preventive practices regarding the method to obtain these data. herefore, like in Belo Horizonte, where the landline telephone coverage was 82.9%, according to data from PNAD 2003, and speciically in the regions studied, of 80.0%, Madrid also had a broad coverage (94.8%)5.
In order to interpret the indings in this study, it is important to consider some issues. At irst, the comparison was conducted between a telephone and a face to face survey, being the latter used as reference. Such strategy was adopted because it was a more traditional method-ology for epidemiological surveys, but this does not indicate that this process is gold standard for such studies.
Despite the limitations, the indings were consistent with VIGITEL in BH, especially for both studied areas. It was possible to obtain estimates that were closer to the proile of the total population due to the broad telephone coverage, which does not exclude the need for the post-stratiication weighting factor to adjust part of the bias estimates. Comparative studies like this are important, and the conduction of periodic household surveys is recommended in places with diferent telephone line coverage in order to accompany regional patterns and prevalence trends between these two types of surveys.
and less time in relation to household face to face surveys, which ensures its systematic and annual performance.
Acknowledgments
To the team of researchers of OSUBH, who participated of the survey Saúde em Beagá. ADF, scholarship student of the Coordination for the Improvement
of Higher Education Personnel (CAPES) (2007-10) and Foundation for Research Support of Minas Gerais (FAPEMIG) (2010); ACSA, scholarship student of technical support at FAPEMIG; CGCR, scientiic initi-ation scholarship student at PIBIC-UFMG; CCC, FAP and WTC, scholarship students of productivity in research of the National Council of Technological and Scientiic Development (CNPq).
References
1. Viacava F. Informações em saúde: a importância dos inquéritos populacionais. Ciên Saúde Coletiva. 2002;7(4):607-21.
2. Malta DC, Leal MC, Costa MFL, Morais OL Neto. Inquéritos nacionais de saúde: experiência acumulada e proposta para o inquérito de saúde brasileiro. Rev Bras Epidemiol 2008;Malta DC, Leal MC, Costa MFL, Neto OLM 11 Suppl 1: 159-67.
3. Campos CEA. Os inquéritos de saúde sob a perspectiva do planejamento. Cad Saúde Pública. 1993;9(2):190-200.
4. Waldman EA, Novaes HMD, Albuquerque MFM, Latorre MRDO, Ribeiro MCSA, Vasconcellos M, et al. Inquéritos populacionais: aspectos metodológicos, operacionais e éticos. Rev Bras Epidemiol. 2008;11 Suppl 1:168-79.
5. Galán I, Rodríguez-Artalejo F, Zorrilla B. Comparación entre encuestas telefónicas y encuestas «cara a cara» domiciliarias en la estimación de hábitos de salud y prácticas preventivas. Gac Sanit. 2004;18(6):440-50.
6. Moura EC, Neto OLM, Malta DC, Moura L, Silva NN, Bernal R, et al. Vigilância de fatores de risco para doenças crônicas por inquérito telefônico nas capitais dos 26 estados brasileiros e no Distrito Federal (2006). Rev Bras Epidemiol. 2008;11 Suppl 1:20-37.
7. Carvalhaes MABL, Moura EC, Monteiro CA. Prevalência de fatores de risco para doenças crônicas: inquérito populacional mediante entrevistas telefônicas em Botucatu, São Paulo, 2004. Rev Bras Epidemiol. 2008;11(1):14-23.
8. Brasil. VIGITEL Brasil 2008: Vigilância de fatores de risco e proteção para doenças crônicas por inquérito telefônico. Brasília: Ministério da Saúde, Secretaria de Vigilância em Saúde, Secretaria de Gestão Estratégica e Participativa; 2009.
9. Marques RM, Berquó ES. Seleção na unidade de informação
em estudos de tipo survey. Um método para construção das
tabelas de sorteio. Rev Bras Estat.1976;37(145):81-92.
10. IBGE. Instituto Brasileiro de Geograia e Estatística. Censo demográico, 2000. Brasília; 2001. [cited 2010 Nov 04].
Available from: http://www.ibge.gov.br/home/estatistica/ populacao/default_censo_2000.shtm.
11. OSUBH. Observatório de Saúde Urbana de Belo Horizonte [on line]. Belo Horizonte: Universidade Federal de Minas Gerais, Faculdade de Medicina. [cited 2010 Nov 04]. Available from: http://www.medicina.ufmg.br/osubh.
12. Caiafa WT, Nabuco AL, Friche AA, Proietti FA. Urban health and governance model in Belo Horizonte, Brazil. In: Vlahov D, Bouforf JI, Pearson C, Norris L. Urban health: global perspectives. New York: John Wiley & Sons, 2010. p 437-452.
13. Caiaffa WT, Dias MAS, Ferreira AD, Casas RL. Evaluation MS/CDC of: Belo Horizonte – MG: Programa Academia da Cidade. In Ministério da Saúde e Centers for Disease
Control and Prevention.The Physical Activity Promotion
in the Brazilian Health System (SUS) according to the Context of the National Policy of Health Promotion. In press, 2011.
14. Secretaria Municipal de Saúde de Belo Horizonte. Gerência de Epidemiologia e Informação – GEEPI. Índice de vulnerabilidade à saúde 2003: Belo Horizonte: 2003. [cited 2010 Dez 12]. Available from: http://www.pbh.gov.br/smsa/ biblioteca/gabinete/risco2003.
15. Stata Statistical Software. Release 10.0. College Station: StataCorp LP; 2007.
16. Segri NJ, Cesar CLG, Barros MBA, Alves MCGP, Carandina L, Goldbaum M. Inquérito de saúde: comparação dos entrevistados segundo posse de linha telefônica residencial. Rev Saúde Pública. 2010;44(3):503-12.
17. Link BG, Phelan JO. Social conditions as fundamental causes of disease. J Health Soc Behav 1995; 35 extra issue: 80-94.
18. Peres MA, Masiero AV, Longo GZ, Rocha GC, IB Mato, K Najnie, et al. Auto-avaliação da saúde em adultos no Sul do Brasil. Rev Saúde Pública. 2010;44(5):901-11.
1982: da adolescência à vida adulta, Pelotas, RS. Rev Saúde Pública. 2008;42 Suppl 2:78-85.
20. Capilheira MF, Santos IS. Fatores individuais associados à utilização de consultas médicas por adultos. Rev Saúde Pública. 2006;40(3):436-43.
21. Barros MBA, César CLG, Carandina L, Torre GD. Desigualdades sociais na prevalência de doenças crônicas no Brasil, PNAD–2003. Ciên Saúde Coletiva. 2006;11(4):911-26.
22. Bernal R, Silva NN. Cobertura de linhas telefônicas residenciais e vícios potenciais em estudos epidemiológicos. Rev Saúde Pública. 2009;43(3):421-6.
23. [CDC] Centers for Disease Control and Prevention. Behavioral Risk Factor Surveillance System – BRFSS. Abouth the BRFSS, [on line] 2007. [cited 2010 Nov 12]. Available from: http://www.cdc.gov/brfss/abourth.htm.
24. Smith TMF. Post-Stratiication. JRstatsocSer. D. – he
Statistician. 1991;40(3) special issue (2):315-23.
25. Rowland ML, Forthofer RN. Adjusting for nonresponse bias in a health examination survey. Public Health Rep. 1993;108(3):380–6.
Submitted on: 05/01/2011 Final version presented on: 15/02/2011