Analytical Methods
Correlation of quantitative sensorial descriptors and chromatographic signals of
beer using multivariate calibration strategies
Gilmare A. da Silva
a, Danilo A. Maretto
b, Helena Maria A. Bolini
c, Reinaldo F. Teófilo
d, Fabio Augusto
b,
Ronei J. Poppi
b,⇑aDepartment of Chemistry, Federal University of Ouro Preto (UFOP), Morro do Cruzeiro, 35400-000 Ouro Preto, MG, Brazil bInstitute of Chemistry, State University of Campinas (UNICAMP), P. O. Box 6154, 13083-970 Campinas, SP, Brazil cFaculty of Food Engineering, State University of Campinas (UNICAMP), P.O. Box 6121, 13083-862 Campinas, SP, Brazil dDepartment of Chemistry, Federal University of Viçosa (UFV), 36570-000 Viçosa, MG, Brazil
a r t i c l e
i n f o
Article history: Received 5 October 2010
Received in revised form 11 November 2011 Accepted 20 March 2012
Available online 29 March 2012
Keywords: Beer
Solid phase microextraction Gas chromatography Sensorial analysis
Quantitative descriptive analyses Genetic algorithm
Ordered predictors selection
a b s t r a c t
In this study, two important sensorial parameters of beer quality – bitterness and grain taste – were cor-related with data obtained after headspace solid phase microextraction – gas chromatography with mass spectrometric detection (HS-SPME–GC–MS) analysis. Sensorial descriptors of 32 samples of Pilsner beers from different brands were previously estimated by conventional quantitative descriptive analyses (QDA). Areas of 54 compounds systematically found in the HS-SPME-GC–MS chromatograms were used as input data. Multivariate calibration models were established between the chromatographic areas and the sensorial parameters. The peaks (compounds) relevant to build each multivariate calibration model were determined by genetic algorithm (GA) and ordered predictors selection (OPS), tools for variable selection. GA selected 11 and 15 chromatographic peak areas, for bitterness and grain taste, respectively; while OPS selected 17 and 16 compounds for the same parameters. It could be noticed that seven vari-ables were commonly pointed out by both variable selection methods to bitterness parameter and 10 variables were commonly selected to grain taste attribute. The peak areas most significant to the evalu-ation of the parameters found by both variable selection methods fed to the PLS algorithm to find the proper models. The obtained models estimated the sensorial descriptors with good accuracy and preci-sion, showing that the utilised approaches were efficient in finding the evaluated correlations. Certainly, the combination of proper chemometric methodologies and instrumental data can be used as a potential tool for sensorial evaluation of foods and beverages, allowing for fast and secure replication of parameters usually measured by trained panellists.
Ó2012 Elsevier Ltd.
1. Introduction
In the literature, numerous investigations aimed at identifying volatile compounds in different types of beer can be found and many hundreds of constituents have been reported (Fritsch & Schieberle, 2005). Beer is a very complex mixture and its constitu-ents, including the volatile ones, vary widely in nature and in con-centration levels and are derived from raw materials including water, yeast, malt, and hops. Aroma substances are very important in beer because they greatly contribute to quality of the final prod-uct (Liu, Zeng, & Xiong, 2005).
Considering the nature and concentration of these chemical species, gas chromatography (GC) is the conventional analytical technique for aroma components. However, a proper isolation and concentration technique should be applied before the
chromatographic analysis itself since many beer components, such as sugar, can cause serious damage to the chromatographic system. A very suitable extraction–concentration method for GC analysis of beer is headspace-solid phase microextraction (HS-SPME) (Paw-liszyn, 1997). Due to the positive characteristics, some applications (Jellen, Wlazly, Wasowicz, & Kaminski, 1998; Pinho, Ferreira, & San-tos, 2006) can be found in the literature focusing on volatile beer fraction composition analyses applying this sampling technique, as well as for the analysis of beer off-flavours, such as sulphur com-pounds (Hill & Smith, 2000; Scarlata & Ebeler, 1999), and carbonyl compounds (Vesely, Lusk, Basarova, Seabrooks, & Ryder, 2003).
Among the many compounds that can be extracted from the volatile beer fraction, specific ones can be pointed out as responsi-ble or specifically related to quality parameters in beer. These parameters can be defined by sensorial analysis, such as quantita-tive descripquantita-tive analyses (QDA) (Stone, Sidel, Oliver, Woolsey, & Singleton, 1974). However, these types of studies are very time-consuming and susceptible to large sources of variation.
0308-8146Ó2012 Elsevier Ltd.
http://dx.doi.org/10.1016/j.foodchem.2012.03.080
⇑ Corresponding author. Tel.: +55 019 35213126; fax: +55 019 35213023. E-mail address:[email protected](R.J. Poppi).
Contents lists available atSciVerse ScienceDirect
Food Chemistry
j o u r n a l h o m e p a g e : w w w . e l s e v i e r . c o m / l o c a t e / f o o d c h e m
Open access under the Elsevier OA license.
Assessing information about beer compounds by means of instrumental measurements would be very beneficial because the great possibility of getting repeatability and reproducibility, besides the fact that instruments do not suffer from fatigue or adaptation. Measurements can be performed at different stages of consumption and on different types of sensory attributes (Meilg-aard, 1982).
In this study the relationships between beer quality parameters, specifically bitterness and grain taste obtained from sensorial anal-ysis and instrumental measurements were investigated, as well as their correlation with calibration models was evaluated.
Pilsner beer samples were analysed using gas chromatography coupled to a mass spectrometric detector, with a sample prepara-tion step applying HS-SPME. The correlaprepara-tion of chromatographic peak areas and sensorial attributes of beer, quantified through QDA, was carried out by applying a multivariate calibration meth-od based on partial least squares (PLS) (Beebe, Pell, & Seasholtz, 1998) and variable selection approaches through genetic algorithm (GA) (Lucasius & Kateman, 1993) and ordered predictors selection (OPS) (Teófilo, Martins, & Ferreira, 2009).
The genetic algorithm for variable selection is a technique that aids in identifying a variable subset that, for a given problem, cor-responds to the most useful and informative one in obtaining an accurate regression model. In the GA variable selection procedure the binary code (0, 1) is utilised to codify the problem. In this case, each gene can assume the 1 or 0 value. When the position referring to a determined variable is 1, this variable is selected. On the other hand, if the position contains the value of 0 this is an indication that this variable was not selected. A subset is generated with the best and most reduced number of variables.
The variable selection realised by GA searches in the data set the variables that present more sensitivity and linearity for the compounds of interest. So, in this study, the intention is to evaluate a strategy based on sensorial and chromatographic analysis and multivariate calibration based on GA variable selection to be able to infer about which volatile beer constituents present direct rela-tionships with beer quality parameters.
In order to compare the results obtained through GA variable selection a new procedure with high ability to enhance prediction of multivariate calibration models with a small number of inter-pretable variables was utilised, the ordered predictors selection (OPS) method. The core of the ordered predictors selection is to sort the variables from an informative vector, followed by a sys-tematic investigation of PLS regression models with the aim of finding the most relevant set of variables by comparing the cross-validation parameters of the models obtained (Teófilo et al., 2009). Many informative vectors can be used such as the regres-sion vector, the correlation vector and the residual vector. Combi-nations of the evaluated vectors can also be applied.
From the proposed study, it will be possible to point out the main volatile compounds related to the two important beer quality parameters, bitterness and grain taste. This study can be imple-mented to be used in future for process monitoring and evaluation of raw materials and final products.
2. Materials and methods
2.1. Samples and HS-SPME materials
Samples from 32 different brands of Pilsner beer (except for one sample, all brewed in Brazil) were obtained at local groceries, stored at ambient temperature (25°C or less) under appropriate conditions and used before their expiration dates. All extractions were performed manually using 65
l
m polydimethylsiloxane/divi-nylbenzene (PDMS/DVB) SPME fibres (Supelco, Bellefonte, PA, USA) coupled to a holder and previously conditioned according to thesupplier’s instructions. The selection of this fibre and of other HS-SPME-GC–MS operational conditions was based on earlier studies (da Silva, Augusto, & Poppi, 2008). For the extractions, sam-ples were enclosed in 16 mL glass vials capped with Teflon/silicone septa (Pierce, Rockford, IL, USA). Sample temperature during extraction was controlled with ±0.1°C using a circulating water bath (Cole-Parmer, Vernon Hills, IL, USA). Toasted barley from a lo-cal market, reagent grade NaCl (J.T. Baker, São Paulo, Brazil) and caffeine (Sigma–Aldrich, St. Louis, MO, USA) were also used, as well as a C8–C20n-alkane standard mix (Fluka, Büchs, Switzerland) for
measurement of linear temperature programming retention in-dexes (LTPRI) of the detected peaks.
2.2. Chromatographic analysis
All chromatographic analysis were performed on a Saturn 2000 Ion Trap GC–MS (Varian, Walnut Creek, CA, USA) equipped with a
30 m0.25 mm0.25
l
m HP-50 column (Agilent Technologies,Wilmington, DE, USA) and a split-splitless injector operated in the splitless mode, fitted with an adequate deactivated glass liner for SPME. The oven temperature was programmed as follows: 2 min at 40°C?10°C min1?140°C?7°C min1?3 min at 250°C. The injector and the MS transfer line were kept at 210 and 280°C, respectively. Helium was used as carrier gas at a flow rate of 1.0 mL/min. The MS scan range was from 50 to 300 amu. Identification of the detected peaks was performed using the auto-mated mass spectral deconvolution and identification system (AM-DIS) software coupled to the NIST mass spectral search programme (NIST, Washington, DC, USA) and confirmed by LTPRI measured from chromatograms of selected samples spiked with the C8–C20
n-alkane mixture. A total of 54 unique peaks, present in all ana-lysed samples, were pre-selected for the modelling.
2.3. HS-SPME procedure
Before analysis, beer bottles were cooled at5°C and, immedi-ately after opening, the bottle content was degassed in an ultra-sonic bath for 15 min. Aliquots of 5 mL of degassed beer were transferred to a glass vial and 1.3500 g of NaCl was added. The vials were sealed and the samples magnetically stirred for 5 min at 50°C. After this sample/headspace equilibration period, a PDMS/ DVB fibre was exposed to the sample headspace for 30 min at the same temperature. The extracted analytes were immediately desorbed in the injection port of the GC–MS at 210°C; the fibre was kept in the GC injector for 15 min to ensure total desorption and avoid inter-run carryover.
2.4. Sensorial analysis
and grain taste, ranging from 1 to 9, were calculated for each sample.
2.5. Bitterness analysis by the standard method
The bitterness parameters of the different beer brands were also determined by the AOAC 970.16 official standard method (AOAC, 1969). It is denominated the bitterness units (BU) method and con-stitutes a spectrophotometric method. It utilises spectral grade 2,2,4-trimethylpentane (isooctane) (Carlo Erba), reagent grade oc-tyl alcohol (Merck) and a 3 mol/L hydrochloric acid (Merck) solu-tion standardised by a sodium hydroxide (Merck) solusolu-tion.
Ten mL of chilled (10°C) carbonated beer were transferred to a 50 mL centrifuge tube, using a pipet which had a minute amount of octyl alcohol in the tip. One millilitre of 3 mol/L HCl and 20 mL of isooctane were added. The centrifuge tube was tightly stoppered and shaken vigorously for 15 min on a mechanical shaker. After that, the samples were centrifuged for 10 min to separate the phases. The clear upper phase (isooctane) was immediately trans-ferred to a cuvette of 1.0 cm path length. The analyses were per-formed with a Femto 700 Plus Spectrophotometer at 275 nm. The instrument was set to read 0A at 275 nm for an isooctane-octyl alcohol blank solution (10 mL of isooctane containing one drop of octyl alcohol).
To calculate the BU the Eq.(1)was used.
BU¼A27550 ð1Þ
TheA275term corresponds to the absorption verified at 275 nm
of the extracted sample.
2.6. Data processing
All calculations were performed in MATLAB 7 programming environment (The MathWorks, Natick, MA, USA) utilizing a genetic algorithm routine from the PLS Toolbox 4.2 (Eigenvector Technol-ogies, Manson, WA, USA) (Wise et al., 2006) and OPS Toolbox rou-tines available on the Internet at http://lqta.iqm.unicamp.br, to perform the selection of the variables.
For each sensorial parameter to be modelled (bitterness and grain taste) the input data consisted of a X matrix with 32 lines (one line per sample) and 54 columns (one column for each se-lected chromatographic peak, containing the corresponding peak area), and a y vector with 32 lines corresponding to the average QDA of each attribute measured for the sample by the panel. For each sensorial attribute, the correlation between X and y was per-formed by partial least squares regression, after a preliminary step to select the variables (peak areas) relevant to the models.
Variable reduction was performed by using a GA approach un-der the following conditions: ten replicates with population size of 64; mutation rate of 0.005; and maximum of 80 generations. Tests with data not submitted to any pre-processing before GA var-iable selection, as well as with the data sets previously auto-scaled and mean-centred were performed. The best and most appropriate results were obtained with auto-scaled data and all discussion will be based on these models. The performances of PLS models gener-ated for each sub-set of selected variables and with different num-bers of latent variables were evaluated by calculating the root mean square error of cross validation (RMSECV). After determina-tion of the relevant variables for each model, the correladetermina-tion of pre-dicted versus measured values of QDA parameters and the distribution of residuals was verified to confirm the reliability of the models developed.
In relation to OPS method, firstly it was performed the investi-gation to the choice of the number of latent variables (LV) to be ap-plied to the generation of the vectors and the number of LV (hOPS) necessary to the construction of the regression vector. These two
parameters are necessary to implement the algorithm in the selec-tion of the variables. Five replicates were performed to all evalu-ated informative vector and all calculations were performed with auto-scaled data and, as done to the GA study, the performances of PLS models generated for each sub-set of selected variables were evaluated by calculating the RMSECV. After determination of the relevant variables for each model, the correlation of predicted ver-sus measured values of QDA parameters and the distribution of residuals was verified to confirm the reliability of the models developed.
3. Results and discussion
Measurements from five out of the 15 original panellists were discarded after ANOVA analysis of the raw data obtained in the training phase; the remainder judges tasted the beer samples in triplicate and the QDA values and respective significance intervals were calculated from their scores. The scores for bitterness ranged from 2.1 to 8.4; the average was 4.8 and the median was 4.6. For grain taste, the scores ranged from 3.5 to 6.1, with 4.8 as average and a median of 4.8. These distributions were deemed as broad en-ough to be representative of the Pilsner beer brands usually avail-able and consumed within the Brazilian market. In the GC–MS data, 54 compounds were systematically found in all examined beer samples (Table 1). Most of chromatographic peaks were iden-tified, however some of them, although being unique chemical spe-cies as indicated by their mass spectra and LTPRI, their identity could not be established. For example, considering the retention index and mass spectrum, peak #18 corresponds to an 8-carbon aliphatic acid, but not exact identification could be attributed. Also in seven chromatographic peaks no identification was possible. Since these unidentified or partially identified peaks could be re-lated to the sensorial properties of the samples and, therefore, could be significant to the PLS models, it was retained on the input data. Most of these compounds had already been identified in pre-vious studies on the composition of the volatile fraction of Pilsner beers and can be related to the brewing process.
3.1. Bitterness parameter
After GA variable selection, 11 variables were selected for the bitterness parameter (Table 1). This corresponds to a reduction of approximately 80% of the 54 original variables.
Also inTable 1, the selected peaks by OPS method to the bitter-ness parameter are presented. Here, it was pointed out 17 vari-ables, representing a reduction of approximately 68.5% of the original variables. In the OPS selection, it was evaluated different informative vectors and combinations of vectors such as the regression (R), the root square (S) error, the net analyte signal (NAS) vectors, and combinations of NAS andS(NS) vectors andR andS(RS) vectors. Comparing the results from all of them evaluat-ing the RMSECV and the correlation coefficients of the obtained models, the best result was obtained utilizing the NS combination vector.
From the selected peaks by the GA and OPS approaches, seven were pointed out commonly. It corresponds to approximately 64% of agreement in the selection performed by OPS relating to the one carried out by the GA.
TheTable 2presents some parameters of the best models to the GA and OPS selection methods. Considering the selected peaks commonly pointed out by both approaches, the compounds prob-ably closed related with the bitterness attribute are ethyl acetate, 1-octanol,p-vinylguaiacol,
c
-nonalactone,b-phenylethyl butyrate, caryophyllene oxide and dibutylphthalate.captured. This means that the selected variables are the ones that are directly related to the bitterness quality parameter. It is impor-tant to emphasise that in most models obtained by OPS method
utilizing other informative vectors, even among other variables, the compounds cited above were always selected.
Ethyl acetate (#3 inTable 1) is an ester derived from ethanol and acetic acid and, as with most esters; it is correlated with the freshness and fruitiness of young beers (Wampler, Washall, & Matheson, 1996). 1-Octanol (#14 inTable 1) has also already been reported in the volatile fraction of beer (Pinho et al., 2006).p -Vinyl-guaiacol (#34 in Table 1) is cited as a derivative of ferulic acid (hydroxycinnamic acid) during the brewing process, and it is fre-quently found in beer when wheat or wheat malt is used as a com-ponent of beer production (Coghe, Benoot, Delvaux, Vanderhaegen, & Delvaux, 2004). As for
c
-nonalactone (#38 inTable 1), it is cited as one of the crucial compounds whose concentration is increased during beer aging. It is supposed to be derived from nonanoic acid metabolization by yeast, and not is found in raw hop extracts (Lermusieau, Bulens, & Collin, 2001). The organic compound b-phenylethyl butyrate (#39 inTable 1), as with most esters, is cor-related with the freshness and fruitiness of young beers (Wampleret al., 1996). Cadinene and caryophyllene (#48 in Table 1)
com-pounds are bicyclical sesquiterpene constituents of the essential oils of plants, reported as volatile components of fermented bever-ages, such as wine (Coelho, Rocha, Delgadillo, & Coimbra, 2006). Phthalate (#54 inTable 1) is also related to bitterness. Phthalates are chemical compounds mainly used as plasticizers (they increase the flexibility of the plastic) (Holadová, Prokupková, Hajšlová, & Poustka, 2007). Although they are not beer constituents, in all data treatment by GA and OPS, this compound was selected, being pres-ent in all brands studied. The presence of phthalate can be due to the contamination by plastic(s) recipient(s) used in some stage during the brewing process.
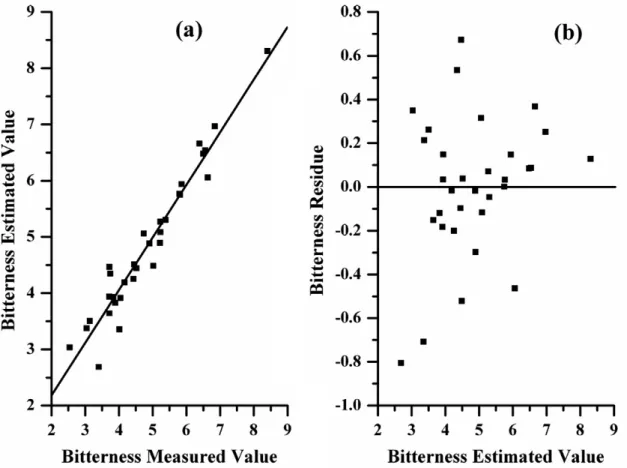
Fig. 1a shows a plot of the values of bitterness measured by QDA against the predicted ones estimated by the PLS approach, after GA variable selection, where a correlation coefficient (R2) of 0.9678 and
a root mean square error of 0.33 were obtained. As can be observed inFig. 1b, the residuals show a random behaviour, reflecting that the subset indicated by GA for bitterness adequately fit the data.
InFig. 2a it is presented the values of bitterness measured by QDA against the estimated ones by the PLS approach after OPS var-iable selection. The correlation coefficient is 0.9517 and the root
mean square error is 0.28.Fig. 2b shows the random behaviour
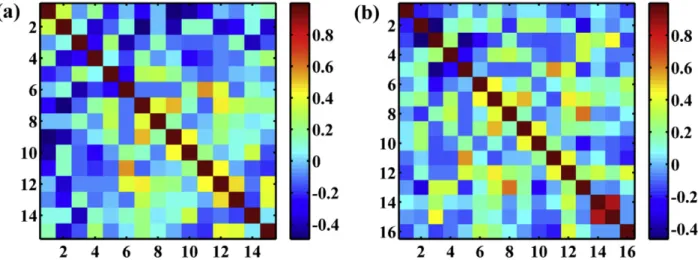
of the residual, showing that the useful information was modelled. The variables selected by GA and OPS are those supposed the most directly related to bitterness. To evaluate which of these ones are independent variables, the correlation coefficient values among the selected variables by GA and OPS approaches were calculated and presented inFig. 3a and b, respectively.
FromFig. 3a and b it can be seen that the selected variables present low correlation coefficients, indicating that these ones are not correlated among themselves, except by the variables 16 and 17 pointed out by the OPS method. The variables 16 and 17 correspond to the penultimate (#53) and last (#54) variables, respectively, from the original data set. Both variable selection ap-proaches pointed out the last peak area as correlated to bitterness. So, probably the peak 54 can efficiently represents the peak 53, which presents a retention time close to that one. From these re-sults, the genetic algorithm and ordered predictors selection se-lected basically orthogonal variables, indicating that the useful information is centralised in independent variables.
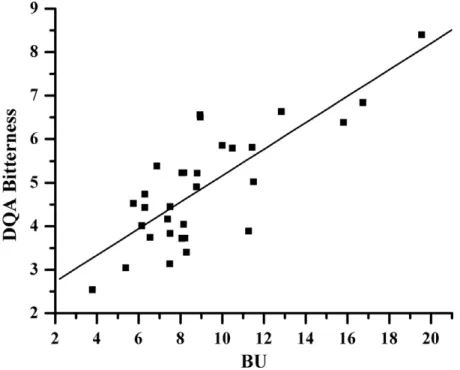
The bitterness attribute was also determined by the AOAC offi-cial standard method.Fig. 4shows the relation of the bitterness values defined by QDA and the ones obtained from the AOAC stan-dard method.Fig. 4shows a linear tendency between the bitter-ness intensity values from QDA and the standard method, since it was obtained a square correlation coefficient of 0.7832. This result validates the quantitative determination of bitterness rea-lised by quantitative descriptive analyses.
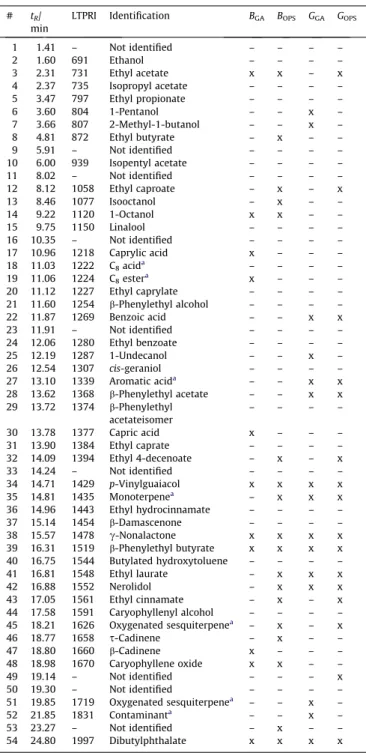
Table 1
Analytes detected on the beer headspace and the compounds selected to bitterness (B) and grain taste (G) attributes according to genetic algorithm (BGAandGGA) and
ordered predictors variable (BOPSandGOPS).
# tR/ min
LTPRI Identification BGA BOPS GGA GOPS
1 1.41 – Not identified – – – –
2 1.60 691 Ethanol – – – –
3 2.31 731 Ethyl acetate x x – x
4 2.37 735 Isopropyl acetate – – – –
5 3.47 797 Ethyl propionate – – – –
6 3.60 804 1-Pentanol – – x –
7 3.66 807 2-Methyl-1-butanol – – x –
8 4.81 872 Ethyl butyrate – x – –
9 5.91 – Not identified – – – –
10 6.00 939 Isopentyl acetate – – – –
11 8.02 – Not identified – – – –
12 8.12 1058 Ethyl caproate – x – x
13 8.46 1077 Isooctanol – x – –
14 9.22 1120 1-Octanol x x – –
15 9.75 1150 Linalool – – – –
16 10.35 – Not identified – – – –
17 10.96 1218 Caprylic acid x – – –
18 11.03 1222 C8acida – – – –
19 11.06 1224 C8estera x – – –
20 11.12 1227 Ethyl caprylate – – – –
21 11.60 1254 b-Phenylethyl alcohol – – – –
22 11.87 1269 Benzoic acid – – x x
23 11.91 – Not identified – – – –
24 12.06 1280 Ethyl benzoate – – – –
25 12.19 1287 1-Undecanol – – x –
26 12.54 1307 cis-geraniol – – – –
27 13.10 1339 Aromatic acida – – x x
28 13.62 1368 b-Phenylethyl acetate – – x x 29 13.72 1374 b-Phenylethyl
acetateisomer
– – – –
30 13.78 1377 Capric acid x – – –
31 13.90 1384 Ethyl caprate – – – –
32 14.09 1394 Ethyl 4-decenoate – x – x
33 14.24 – Not identified – – – –
34 14.71 1429 p-Vinylguaiacol x x x x
35 14.81 1435 Monoterpenea – x x x
36 14.96 1443 Ethyl hydrocinnamate – – – –
37 15.14 1454 b-Damascenone – – – –
38 15.57 1478 c-Nonalactone x x x x
39 16.31 1519 b-Phenylethyl butyrate x x x x 40 16.75 1544 Butylated hydroxytoluene – – – –
41 16.81 1548 Ethyl laurate – x x x
42 16.88 1552 Nerolidol – x x x
43 17.05 1561 Ethyl cinnamate – x – x
44 17.58 1591 Caryophyllenyl alcohol – – – –
45 18.21 1626 Oxygenated sesquiterpenea – x – x
46 18.77 1658 s-Cadinene – x – –
47 18.80 1660 b-Cadinene x – – –
48 18.98 1670 Caryophyllene oxide x x – –
49 19.14 – Not identified – – – x
50 19.30 – Not identified – – – –
51 19.85 1719 Oxygenated sesquiterpenea – – x –
52 21.85 1831 Contaminanta – – x –
53 23.27 – Not identified – x – –
54 24.80 1997 Dibutylphthalate x x x x
atentative assignment.
Table 2
Parameters of the best models obtained from the GA and OPS variable selection methods to the bitterness sensorial attribute.
RMSECV Number of latent variables Number of selected variables
GA 0.65 4 11
Fig. 1.(a) Plot of the values obtained through QDA against the values estimated by the PLS model for the bitterness parameter, after GA variable selection. (b) Residual plot for the bitterness parameter.
Fig. 2.(a) Plot of the values obtained through QDA against the values estimated by the PLS model for the bitterness parameter, after OPS variable selection. (b) Residual plot for the bitterness parameter.
3.2. Grain taste parameter
In the study related to the grain taste parameter, as presented in Table 1, GA modelling selected 15 variables from the original 54 variables. It corresponds to a reduction of approximately 72% of the initial variables. OPS modelling selected 16 variables (Table 1), corresponding to a reduction of approximately 70% of the origi-nal variables.
In the OPS selection, it was evaluated different informative vec-tors such asR,Sand NAS vectors and their combinations as NAS andS(NS) vectors andRandS(RS) vectors. Comparing the results from all of them evaluating the RMSECV and the correlation coef-ficients of the obtained models, the best result was obtained utiliz-ing the R vector.
From the selected peaks by the GA and OPS approaches, ten were pointed out commonly. It corresponds to approximately 67% of agreement in the selection performed by OPS relating to the one carried out by the GA.
TheTable 3presents some parameters of the best models to the GA and OPS selection methods, to grain taste quality parameter. Considering the selected peaks commonly pointed out by both approaches, the compounds probably closed related with the grain taste attribute are benzoic acid (#22 inTable 1), a possible aro-matic acid (#27 inTable 1),b-phenylethyl acetate (#28 in Table 1),p-vinylguaiacol (#34 inTable 1), a possible monoterpene (#35 inTable 1),
c
-nonalactone (#38 inTable 1),b-phenylethyl butyrate (#39 inTable 1), ethyl laurate (#41 inTable 1), nerolidol (#42 in Table 1), and dibutylphthalate (#54 inTable 1).Fig. 3.(a) Correlation coefficient values between the variables selected by GA for the bitterness parameter. (b) Correlation coefficient values between the variables selected by OPS for the bitterness parameter. The lateral bars indicate the correlation coefficient values.
Fig. 4.Relation of the bitterness values defined by QDA and the ones obtained from the AOAC standard method.
Table 3
Parameters of the best models obtained from the GA and OPS variable selection methods to the grain taste sensorial attribute.
RMSECV Number of latent variables Number of selected variables
GA 0.54 3 15
These compounds can be considered directly related to the grain taste quality parameter. As emphasised for bitterness, utilizing these selected variables, it is possible to describe and study the grain taste attribute. Almost all the selected compounds identified by the mass spectra are related to beer composition. Benzoic acid
is extensively used as a preservative in foodstuffs, presenting anti-microbial activity to prevent bacteria, microbe and fungus prolifer-ation (Pan et al., 2005). It is mainly utilised in products presenting acid character, such as beer, due its activity in the pH range of 2.5–4.0 (Ochiai et al., 2002). Aromatic acids are natural constituents
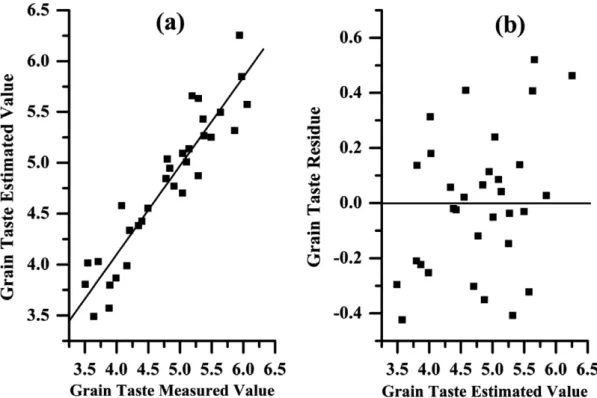
Fig. 5.(a) Plot of the values obtained through QDA against the values estimated by the PLS model for the grain taste parameter, after GA variable selection. (b) Residual plot for the grain taste parameter.
Fig. 6.(a) Plot of the values obtained through QDA against the values estimated by the PLS model for the grain taste parameter, after OPS variable selection. (b) Residual plot for the grain taste parameter.
of cereals utilised in brewing, such as barley and wheat (Coghe et al., 2004). The aromatic esterb-phenylethyl acetate and ethyl dodecanoate were found as some of the most active odorants in var-ious wines (Komes, Ulrich, & Lovric, 2006; Lee & Noble, 2003; Alves, Nascimento, & Nogueira, 2005; Kafkas et al., 2006). Nerolidol is a sesquiterpene present in essential oils of diverse plants, showing antibacterial, antifungal and anti-parasite properties (Cowan, 1999).
As performed for bitterness, a plot was built of the predicted values by PLS versus the measured values by QDA (Fig. 5a) and another to evaluate the residuals of the constructed PLS model (Fig. 5b), after GA variable selection. The selected variables for grain taste were well-modelled as can be revealed by the square correlation coefficient, 0.9334, and the root mean square error, 0.27, of the relation shown in Fig. 5a. The residuals (Fig. 5b) were also randomly distributed, confirming the adequate fitting of the selected subset by GA to the grain taste quality parameter.
In relation to OPS variable selection, it was also evaluated the fit among the predicted values by PLS and the measured values by QDA (Fig. 6a). The residuals from this model can be seen in Fig. 6b. The square correlation coefficient was 0.8851 and the root mean square error was 0.25.
The correlation coefficient values obtained to the grain taste models can be considered to present an adequate linear relation among the evaluated values since these ones are related to senso-rial analysis and the grain taste quality parameter is not so pro-nounced as bitterness.
As performed to bitterness quality parameter, the variables se-lected by GA and OPS were evaluated according to its orthogonal behaviour. To verify this occurrence, the correlation coefficient val-ues were obtained among the valval-ues selected by GA and OPS for grain taste, as presented inFig. 7a and b, respectively.
It can be seen inFig. 7a that the GA selected variables present-ing low correlation coefficients, indicatpresent-ing that these variables are not correlated between each other. According toFig. 7b, all the correlation coefficients obtained from the evaluation of the vari-able selected by OPS presented low values, indicating absence of correlation among them, except to variables 14 and 15. How-ever, these peaks present retention times quite close. Again, according to these results, the genetic algorithm and ordered pre-dictors selection selected basically orthogonal variables, indicat-ing that the useful information is centralised in independent variables.
4. Conclusions
The application of GA and OPS for variable selection allowed the realisation of the correlation between the chromatographic data obtained from 32 commercial beer samples and the data resulting from QDA, for bitterness and grain taste sensorial attributes. The correlation between sensorial and chemical analysis was possible by finding out beer compounds which are linearly related to these quality parameters. The considered substances were that whose peaks were pointed out by both variable selection approaches.
The developed PLS models showed the correlation cited above. Simpler prediction models can now be obtained, since models with fewer and more useful variables can be constructed. These ones can be used to implement monitoring methodologies during beer production, such as to the monitoring of raw material quality.
Acknowledgments
The authors thank the Conselho Nacional de Desenvolvimento Científico e Tecnológico (CNPq) for financial support and for fel-lowships to G.A.S., F.A. and R.J.P., and Prof. Carol Collins for lan-guage assistance.
References
Alves, R. F., Nascimento, A., & Nogueira, J. (2005). Characterization of the aroma profile of Madeira wine by sorptive extraction techniques.Analytica Chimica Acta, 546, 11–21.
AOAC Official Method 970.16 – Bitterness of Beer. (1969). Bitterness units method. ASBC: Beer 23. Journal of the Association of Official Analytical Chemists, 52, 1161.
Beebe, K. R., Pell, R. J., & Seasholtz, M. B. (1998).Chemometrics – A Practical Guide. New York: John Wiley & Sons.
Coghe, S., Benoot, K., Delvaux, F., Vanderhaegen, B., & Delvaux, F. R. (2004). Ferulic acid release and 4-vinylguaiacol formation during brewing and fermentation: Indications for feruloyl esterase activity in Saccharomyces cerevisiae.Journal of Agricultural and Food Chemistry, 52, 602–608.
Cowan, M. M. (1999). Plant products as antimicrobial agents.Clinical Microbiology Reviews, 12, 564–582.
da Silva, G. A., Augusto, F., & Poppi, R. J. (2008). Exploratory analysis of the volatile profile of beers by HS-SPME-GC.Food Chemistry, 111, 1057–1063.
Fritsch, H. T., & Schieberle, P. (2005). Identification based on quantitative measurements and aroma recombination of the character impact odorants in a Bavarian Pilsner-type beer.Journal of Agricultural and Food Chemistry, 53, 7544–7551.
Hill, P. G., & Smith, R. M. (2000). Determination of sulphur compounds in beer using headspace solid-phase microextraction and gas chromatographic analysis with pulsed flame photometric detection. Journal of Chromatography A, 872, 203–213.
Holadová, K., Prokupková, G., Hajšlová, J., & Poustka, J. (2007). Headspace solid-phase microextraction of phthalic acid esters from vegetable oil employing solvent based matrix modification.Analytica Chimica Acta, 582, 24–33. Jellen, H. H., Wlazly, K., Wasowicz, E., & Kaminski, E. (1998). Solid-phase
microextraction for the analysis of some alcohols and esters in beer: Comparison with static headspace method.Journal of Agricultural and Food Chemistry, 46, 1469–1473.
Kafkas, E., Cabaroglu, T., Selli, S., Bozdogan, A., Kurkcuoglu, M., Paydas, S., et al. (2006). Identification of volatile aroma compounds of strawberry wine using solid-phase microextraction techniques coupled with gas chromatography– mass spectrometry.Flavour and Fragrance Journal, 21, 68–71.
Komes, D., Ulrich, D., & Lovric, T. (2006). Characterization of odor-active compounds in Croatian Rhine Riesling wine, subregion Zagorje.European Food Research and Technology, 222, 1–7.
Lee, S., & Noble, A. C. (2003). Characterization of odor-active compounds in Californian Chardonnay wines using GC–Olfactometry and GC–Mass spectrometry.Journal of Agricultural and Food Chemistry, 51, 8036–8044. Lermusieau, G., Bulens, M., & Collin, S. (2001). Use of GC–olfactometry to identify
the hop aromatic compounds in beer.Journal of Agricultural and Food Chemistry, 49, 3867–3874.
Liu, M. M., Zeng, Z. R., & Xiong, B. (2005). Preparation of novel solid-phase microextraction fibers by sol-gel technology for headspace solid-phase microextraction-gas chromatographic analysis of aroma compounds in beer. Journal of Chromatography A, 1065, 287–299.
Lucasius, C. B., & Kateman, G. (1993). Understanding and using genetic algorithms. 1. Concepts, properties and context.Chemometrics and Intelligent Laboratory Systems, 19, 1–33.
Meilgaard, M. C. (1982). Prediction of flavor differences between beers from their chemical-composition. Journal of Agricultural and Food Chemistry, 30, 1009–1017.
Ochiai, N., Sasamoto, K., Takino, M., Yamashita, H., Daishima, S., Heiden, A. C., et al. (2002). Simultaneous determination of preservatives in beverages, vinegar,
aqueous sauces, and quasi-drug drinks by stir-bar sorptive extraction (SBSE) and thermal desorption GS-MS. Analytical and Bioanalytical Chemistry, 373, 56–63.
Pan, Z., Wang, L., Mo, W., Wang, C., Hu, W., & Zhang, J. (2005). Determination of benzoic acid in soft drinks by gas chromatography with on-line pyrolytic methylation technique.Analytica Chimica Acta, 545, 218–223.
Pawliszyn, J. (1997).Solid Phase Microextraction: Theory and Practice. New York: Wiley-VCH.
Pinho, O., Ferreira, I., & Santos, L. (2006). Method optimization by solid-phase microextraction in combination with gas chromatography with mass spectrometry for analysis of beer volatile fraction.Journal of Chromatography A, 1121, 145–153.
Scarlata, C. J., & Ebeler, S. E. (1999). Headspace solid-phase microextraction for the analysis of dimethyl sulfide in beer.Journal of Agricultural and Food Chemistry, 47, 2505–2508.
Stone, E. J. (1992). Quantitative descriptive analysis. In R. C. Hootmann (Ed.),Manual on Descriptive Analysis Testing(13th ed., pp. 13). Conshohoken: ASTM Manual Series MNL.
Stone, H., Sidel, J. L., Oliver, S., Woolsey, A., & Singleton, R. C. (1974). Sensory evaluation by quantitative descriptive analysis.Food Technology, 28, 24–34. Teófilo, R. F., Martins, J. P. A., & Ferreira, M. M. C. (2009). Sorting variables by using
informative vectors as a strategy for feature selection in multivariate regression. Journal of Chemometrics, 23, 32–48.
Vesely, P., Lusk, L., Basarova, G., Seabrooks, J., & Ryder, D. (2003). Analysis of aldehydes in beer using solid-phase microextraction with on-fiber derivatization and gas chromatography/mass spectrometry. Journal of Agricultural and Food Chemistry, 51, 6941–6944.
Wampler, T. P., Washall, J. W., & Matheson, M. J. (1996). Applications of purge-and-trap to the analysis of beer.American Laboratory, 28. 18T-18V.
Wise, B. M., Gallagher, D. A., Bro, R., Shaver, J. M., Winding, W., & Koch, R. S. (2006). PLS Toolbox Version 4.0 for Use with MATLAB, Wenatchee: Eigenvector Research Inc.