0103 - 5053 $6.00+0.00
A
r
ti
c
le
*e-mail: [email protected]
# Present address: Instituto de Química, Universidade de Brasília, CP
04478, 70919-970 Brasília-DF, Brazil
Analysis of Impurities in Crude and Highly-Purified Terephthalic Acid by Capillary
Electrophoresis
Maria de Lourdes L. Moraesa, Joel C. Rubim#,a, Rene R. Realpozob and Marina F. M. Tavares*,a
a
Instituto de Química, Universidade de São Paulo, CP 26077, 05513-970 São Paulo-SP, Brazil b
Tereftalatos Mexicanos S.A., AP 204, Minatitlán, Ver. 96700, México
Neste trabalho, foi desenvolvido um método simples e rápido, utilizando eletroforese capilar (CE), para a análise simultânea de 4-carboxibenzaldeído (4-CBA), ácido p-toluóico (pTOL) e ácido benzóico (BZ), em lotes industriais de ácido tereftálico cru (CTA) e purificado (PTA). As condições eletroforéticas de análise foram: tampão tetraborato a 20 mmol L-1 (pH 9), injeção hidrodinâmica (5
s, 17 kPa), tensão aplicada de +30 kV e detecção direta em 200 nm.
Foram analisados cinco lotes de CTA e quatro lotes de PTA nos teores de 4-CBA e pTOL pela metodologia proposta e as metodologias utilizadas na empresa Tereftalatos Mexicanos S.A. (TEMEX), que são cromatografia gasosa para pTOL e polarografia para 4-CBA, mostrando concordância entre os valores encontrados. Os níveis de BZ foram determinados apenas pela metodologia CE, apresentando no CTA, valores compreendidos entre 60 e 300 ppm, enquanto que no PTA, 5 a 7 ppm. Várias impurezas derivadas da oxidação incompleta do p-xileno foram investigadas, constatando-se a presença do ácido 4-hidroximetilbenzóico por comparação com padrões.
In this work, a simple and fast capillary electrophoresis method for the simultaneous analysis of 4-carboxybenzaldehyde (4-CBA), p-toluic acid (pTOL) and benzoic acid (BZ) in industrial batches of crude (CTA) and highly-purified (PTA) terephthalic acid was developed. The electrophoretic conditions comprise: 20 mmol L-1 tetraborate buffer at pH 9, hydrodynamic injection (5 s/17 kPa),
applied voltage of +30 kV and direct UV detection at 200 nm.
The concentrations of 4-CBA and pTOL in five batches of CTA and four batches of PTA as determined by the proposed CE methodology were in agreement with the results from gas chromatography and polarography methods in current use in Tereftalatos Mexicanos S.A. (TEMEX). Levels of BZ were determined only by the CE methodology and ranged from 60 - 300 ppm in CTA and 5 - 7 ppm in PTA. Several impurities deriving from the incomplete oxidation of p-xylene were investigated. So far the positive identification of 4-hydroxymethylbenzoic acid was accomplished by comparison with pure standards.
Keywords: capillary electrophoresis, terephthalic acid, PTA, 4-CBA
Introduction
One of the major chemistry industrial branches is the petrochemical segment. From ethene (obtained from nafta, petroleum derivatives or directly from natural gas), the petrochemistry can originate many raw materials that allow man to make new ones, substituting with advantage wood, animal furs and other natural products. Plastics and fibers are two important classes of synthetic products, most of them deriving from highly-purified terephthalic acid (PTA)
and its esters.1 About 50% of all PTA are used to make
used in the producing of Kevlar, a particularly strong trademark DuPont material that is incorporated in sailing equipment, aircraft structures and bulletproof vests.2
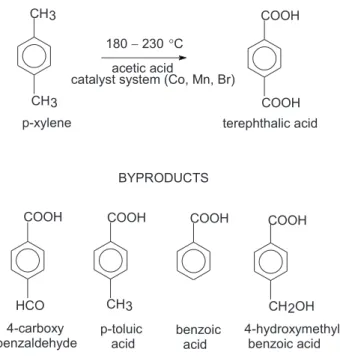
Terephthalic acid is produced industrially by oxidation
of p-xylene in acetic acid medium under the effect of a
catalyst system based on Co, Mn and Br, at high
temperatures (Figure 1).1 The oxidation is a stepwise
reaction involving several intermediates, whose presence as impurities in the final product is highly dependent upon the process parameters. Several side products have been reported and classified by means of their structural features. They comprise the derivatives of benzoic acid, phenol, terephthalic acid, diphenyl, fluorenone and anthraquinone
as well as a variety of esters.3 The presence of these
impurities in terephthalic acid used in the production of polyester, for instance, is undesirable because they can slow down the polymerization process and also impart coloration to the polymer due to thermal instability. This effect is caused by the presence of monoprotic acids, such
p-toluic acid (pTOL), benzoic acid (BZ) and
4-carboxybenzaldehyde (4-CBA).
The impurities 4-CBA and pTOL are customarily monitored in industrial laboratories using polarographic
and gas chromatographic methodologies, respectively.4,5
The disadvantage of this procedure is that two independent techniques must be employed, which is a time consuming practice, demanding two distinct equipments and trained personnel in both techniques.
Few reports based on reversed-phase liquid chromatography of terephthalic acid impurities can also be found.6-8 In one of these reports,6 the authors investigated
the liquid-phase catalytic oxidation of p-xylene to
terephthalic acid, monitoring the product and impurities by gradient elution using methanol:acetonitrile:water mixtures as mobile-phase.
Over the past decade, capillary electrophoresis (CE) has become a resourceful alternative technique for the analysis of a variety of compounds of industrial relevance.9
Even though capillary electrophoresis has been employed in the evaluation of a series of aldehydes,10 organic acids,11
phenolic compounds,12,13 and polycarboxylic acids,14,15 few
reports concerning specifically the analysis of terephthalic acid and the identification of its impurities have been published.16,17
In this work, a simple, fast and reliable capillary electrophoresis methodology for the simultaneous analysis of major impurities in industrial batches of crude (CTA) and highly-purified (PTA) terephthalic acid has been implemented.
Experimental
Equipment
The experiments were conducted in a capillary electrophoresis system (model 270A-HT, Perkin-Elmer, Applied Biosystems Div., Foster City, CA, USA), equipped with a variable UV-Vis detector set at 200 nm, a temperature control device maintained at 25 °C and a data acquisition
and treatment software (TurbochromTM, PE Nelson,
Cupertino, CA, USA). Samples were injected hydro-dynamically (17 kPa pressure) and the electrophoresis system was operated under normal polarity and constant voltage conditions. A fused-silica capillary with dimensions 70 cm total length x 50 cm effective length and 75 µm i.d. was used in the analysis of the crude product. A high-sensitivity optical cell (LC Packings, Amsterdam, The Netherlands), which consisted of a fused-silica capillary assembled in right angles, with dimensions
75 µm i.d., 22 cm short section, 82 cm long section from
injection port and 3 mm pathlength, was used in the evaluation of impurities in the highly-purified product.
Chemicals and samples
All standards were prepared from reagent-grade chemicals (Aldrich/Sigma, St. Louis, MO, USA) and deionized water (Millipore Corporation, Bedford, MA, USA). Stock solutions of terephthalic acid,
4-Figure 1. Schematic representation of the synthesis of terephthalic
carboxybenzaldehyde (4-CBA), p-toluic acid (pTOL), benzoic acid (BZ) and 4-hydroxymethylbenzoic acid (HMB) were prepared at 100 mg/L concentration in 0.15
mol L-1 NaOH. Working solutions in the range of 0.50 to
30 mg/L were prepared by appropriate dilution of the stocks with deionized water. A certified standard of highly-purified terephthalic acid was obtained from AMOCO and
prepared at 10000 mg/L concentration in 0.15 mol L-1
NaOH. Samples of CTA and PTA were obtained from Tereftalatos Mexicanos (TEMEX) and prepared at 5000
mg/L and 10000 mg/L in 0.15 mol L-1 NaOH, respectively.
The electrolyte was a tetraborate buffer solution, prepared at 20 mmol L-1, pH 9, containing eventually 0.20 mmol L-1
of cetyltrimethylammonium bromide (CTAB) as flow modifier.
Analytical procedures
The buffer solutions were prepared fresh daily and filtered through a 0.22 µm membrane filter (Millipore) just prior to use. At the beginning of the day, the capillary was
conditioned by a flush of 1 mol L-1 NaOH solution (20
min), followed by a flush of deionized water (10 min) and a flush of the electrolyte solution (30 min). In between runs, the capillary was just replenished with fresh electrolyte solution (2 min flush).
Results and Discussion
In capillary electrophoresis, the determination of small anions derived from carboxylic acids, is well established in the literature.17-20 It is generally conducted under inverse
polarity and reversed electroosmotic flow.19-21 It is also
possible to carry out anion separations without flow reversal, even though this last approach often leads to longer analysis time.17,22
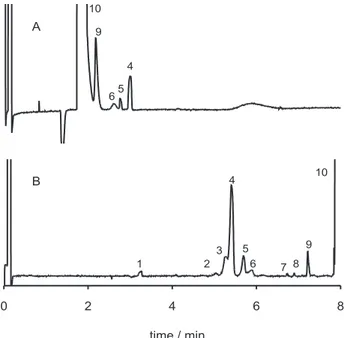
Figure 2 presents an analysis of a crude batch of terephthalic acid in both normal and reversed flow conditions. The sample is very concentrated and the electropherogram was blown, so that the contaminants can be readily visualized. The elution order is dependent on the type of analysis chosen, therefore, the anion of highest mobility, i.e. terephthalate, elute first when flow reversal is employed. Due to the severe peak tailing in borate/CTAB electrolyte medium, even more pronounced due to the compound large concentration, a partial overlap between terephthalic acid and some of its impurities occurs (Figure 2A). Of course, conditions can be optimized to expand the elution window and perhaps have all impurities of interest eluting away from the terephthalic acid peak. However, any attempt to improve the separation will result in a longer
analysis time and perhaps, some amount of tailing will persist, compromising further quantitative work of the impurities. Therefore, the analysis under normal flow conditions seems to be an appropriate choice for the discrimination of the impurities in the presence of a large amount of the major compound (Figure 2B). In this situation, the monocarboxylic acids elute first followed by the terephthalic acid. In borate buffer, the terephthalic acid peak also tails (not shown), but the elution window comprised between the system peak (peak 1 in Figure 2B) and the sharp edge of the terephthalic acid peak (peak 10) can be manipulated easily to achieve separation of the impurities of interest.
Figure 3 presents a further optimized separation of crude terephthalic acid and also an analysis of the highly-purified product, in borate buffer under normal flow conditions, in
regular 75 µm capillaries. The CTA sample was diluted by
a factor of two, so that the resolution between 4-CBA and pTOL was improved (Figure 3A). The major impurities can still be visualized for quantitative treatment. Besides 4-CBA and pTOL, BZ and HMB (peaks labeled as 5 and 2, respectively) are readily identified in the electro-pherogram. Minor impurities (peaks 6, 7 and 8) observed in the previous condition (Figure 2B), decreased considerably and are not seen in the electropherogram due
Figure 2. Comparative analysis of an industrial batch of crude
tereph-thalic acid in reversed electroosmotic flow (A) and normal (B) flow conditions. In (A), 20 mmol L-1 tetraborate buffer, 0.2 mmol L-1
CTAB, pH 9; -30 kV; injection: 5s, 17 kPa: detection: 200 nm; CTA sample: 10000 mg/L concentration in 0.15 mol L-1 NaOH. In (B),
20 mmol L-1 tetraborate buffer, pH 9, +30 kV; other conditions as in
to sample dilution. By decreasing the base width of the terephthalic acid peak, sample dilution affects the migration time of all other sample components.
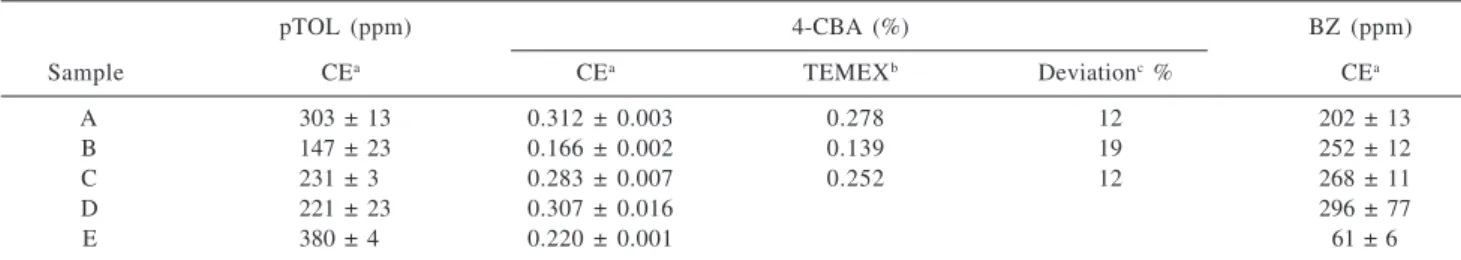
Table 1 presents a quantitative evaluation of five industrial batches of crude terephthalic acid. A comparison between the CE analysis and the analytical data from Tereftalatos Mexicanos (TEMEX) for 4-CBA, using polarography, is also given in Table 1. The results indicated agreement better than 20%. Data for TEMEX analysis of pTOL and BZ for the same batches are not available for comparison.
The PTA electropherogram (Figure 3B) shows that the relative concentration of impurities is altered, for instance, the presence of 4-CBA is hardly visualized, confirming that the industrial purification of the crude product is very successful in removing this compound. Notice that in the electropherogram of Figure 3B, the sample was prepared
at 10000 mg/L concentration. Any attempt to increase area of the 4-CBA peak, either by further concentrating the sample or injecting a larger volume of sample will compromise resolution.
A way to enhance detectability without manipulating sample concentration is to use a high-sensitivity optical cell (HS cell), which presents an enlargement of the optical pathlength for detection. Figure 4 shows the electro-pherogram of a PTA sample analyzed in the HS cell, confirming the possibility of identification and quantitative determination of minor impurities, including 4-CBA.
Table 2 and 3 present statistical parameters of the calibration curves used in the evaluation of limits of detection (LOD) for 4-CBA, pTOL and BZ standards,
analyzed in a regular 75 µm i.d. capillary and in the HS
cell, respectively. The analytical curve equations and coefficients of determination were calculated using linear least-square regression analysis. The results showed an
excellent linearity (r2>0.99) between peak area and
concentration, and an intercept close to the origin. The limits of detection decreased roughly by a factor of ten, when the HS cell was used. Since the expected levels of 4-CBA in the highly-purified terephthalic acid range from 10 to 20 ppm, which corresponds to 0.10 to 0.20 mg/L in
Table 1. Analysis of crude terephthalic acid following optimized methodology using 75 µm fused-silica capillaries
pTOL (ppm) 4-CBA (%) BZ (ppm)
Sample CEa CEa TEMEXb Deviationc% CEa
A 303 ± 13 0.312 ± 0.003 0.278 12 202 ± 13
B 147 ± 23 0.166 ± 0.002 0.139 19 252 ± 12
C 231 ± 3o 0.283 ± 0.007 0.252 12 268 ± 11
D 221 ± 23 0.307 ± 0.016 296 ± 77
E 380 ± 4o 0.220 ± 0.001 61 ± 6
a 3 measurements; b polarography; c calculated as the difference between TEMEX and CE values relative to TEMEX value. Obs.: ppm is g of
contaminant per 106 g of solid product; therefore, values of ppm and % refer to ratios of weight of contaminant per weight of product.
Figure 4. Analysis of an industrial batch of highly-purified
tereph-thalic acid in high-sensitivity optical cell. PTA sample: 10000 mg/L in 0.15 mol L-1 NaOH. Other conditions and peak identification as in
Figure 2B.
Figure 3. Analysis of industrial batches of crude (A) and
highly-purified (B) terephthalic acid in regular 75 µm fused-silica capillar-ies. CTA sample: 5000 mg/L and PTA sample: 10000 mg/L, both in 0.15 mol L-1 NaOH. Other conditions and peak identification as in
the injected sample (due to low solubility of terephthalic acid in water, the impurities are diluted by a factor of 100, during sample preparation), the use of a regular capillary might not be applicable to any industrial sample. Notice that the LOD for 4-CBA is 0.31 mg/L. Therefore, the use of a high-sensitivity cell is definitely advisable for quantitative purposes.
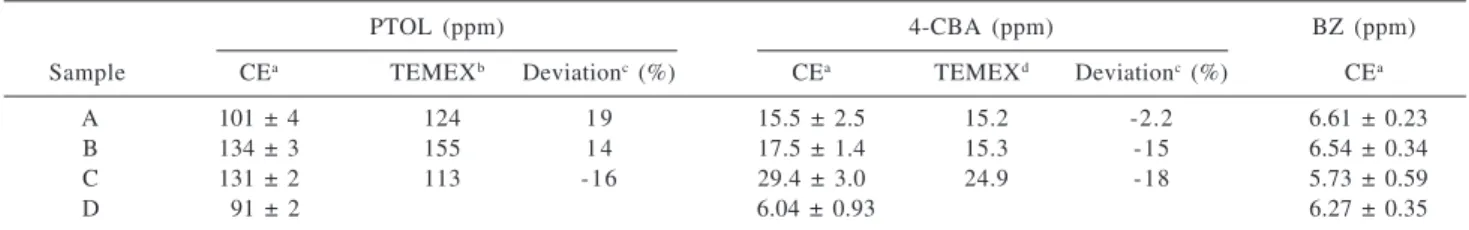
Table 4 shows the results of a capillary electrophoresis analysis of four PTA batches in the HS cell. Correspondingly TEMEX results for 4-CBA and pTOL, when available, are also presented and compared to the CE data. The CE analyses were conducted with one calibration standard, the AMOCO certified standard, whose impurity levels are depicted in the table. The level of benzoic acid in the AMOCO standard was not available, therefore, it was determined electrophoretically in this work using a pure standard (Sigma). As observed previously for the analysis of the crude product, CE and TEMEX methodologies are in good agreement, better than 20% relative deviation. BZ is not currently analyzed in TEMEX laboratories.
Table 2. Statistical parameters of the analytical curves used in the calculation of limits of detection for terephthalic acid and its impurities in
regular 75 µm capillaries
Compound Analytical Curve Coefficient of Determination Limit Of Detectionb
Equationa (mg/L)
p-Toluic acid Y = 7377 X – 33.3 0.998 0.24
4-Carboxy benzaldehyde Y = 2592 X – 74.9 0.997 0.31
Benzoic acid Y = 3212 X – 71.7 0.998 0.23
Terephthalic acid Y = 5739 X – 31.2 0.995 0.37
a concentration range: 0.080 - 3.5 mg/L; based on peak area; b calculated by interpolation: y - y
B = 3sB, where yB is the intercept and sB is the error
associated with the estimate of the intercept.
Table 3. Statistical parameters of the calibration curves used in the calculation of detection limits for terephthalic acid impurities in
high-sensitivity optical cells
Compound Analytical Curve Coefficient of Determination Limit Of Detectionb
Equationa (mg/L)
p-Toluic acid Y = 76339 X – 126 0.9998 0.022
4-Carboxy benzaldehyde Y = 53076 X – o20.3 0.9995 0.034
Benzoic acid Y = 49835 X + o26.4 0.9997 0.027
a concentration range: 0.080 - 1.00 mg/L; based on peak area; b calculated by interpolation: y - y
B = 3sB, where yB is the intercept and sB is the
error associated with the estimate of the intercept.
In order to characterize the CE methodology using the high-sensitivity optical cell, ten consecutive injections of a PTA sample were performed. This experiment showed a 0.52% repeatability in migration time (7.999 ± 0.042 min), 4.8% in peak area and 2.4% in peak height for the pTOL contaminant and a 0.51% repeatability in migration time (8.262 ± 0.043 min), 14.8% in peak area and 7.4% in peak height for the 4-CBA contaminant.
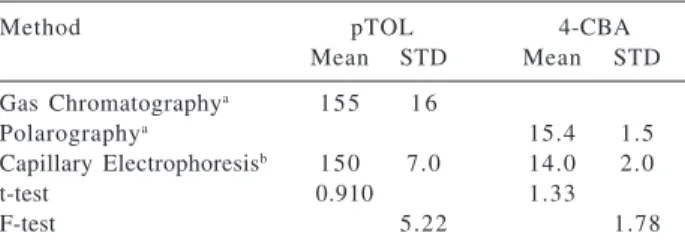
Significance tests were carried out to verify whether there is a statistically significant difference between the results obtained from the proposed CE methodology and the methodologies previously implemented in TEMEX for the analysis of PTA. In order to compare the accuracy and precision of the methods, t test and F test were used, respectively.23
The t test is used to compare the means obtained with two methods or by two persons or by the same person but under different experimental conditions. It is indispensable in analytical chemistry for testing the validity of an analysis. For this purpose, the method variance is
Table 4. Analysis of highly-purified terephthalic acid following optimized methodology using high-sensitivity optical cells
PTOL (ppm) 4-CBA (ppm) BZ (ppm)
Sample CEa TEMEXb Deviationc (%) CEa TEMEXd Deviationc (%) CEa
A 101 ± 4 124 1 9 15.5 ± 2.5 15.2 -2.2 6.61 ± 0.23
B 134 ± 3 155 1 4 17.5 ± 1.4 15.3 -15 6.54 ± 0.34
C 131 ± 2 113 -16 29.4 ± 3.0 24.9 -18 5.73 ± 0.59
D 091 ± 2 6.04 ± 0.93 6.27 ± 0.35
Calibration standard (AMOCO): pTOL = 122 ppm ; 4-CBA = 20.5 ppm; (BZ = 8.2 ppm, as determined by this work). a 3 measurements; based
calculated, using the following equation:
(1)
where S12 and S 2
2 are the variances of the CE and the
TEMEX method under consideration, respectively; n
1 and
n2 are the number of determinations in each method. The t
value is calculated by the equation:
(2)
where X–1 and X–2 are the mean concentration obtained by each method and S is the standard deviation based in both
methods (calculated from equation 1). Values of t are
available in statistical tables for (n1 + n2 - 2) degrees of freedom for a given confidence level.23
If the experimental t value is greater than the theoretical
t value, it indicates that there is a significant difference between the means and, consequently, the methods differ in accuracy.
The F test is used to determine whether there is a
difference in the precision of two methods. The parameter
F is defined as:
, for S12 > S 2
2 (3)
Values of F are available in statistical tables for (n
1 - 1)
and (n2 - 1) degrees of freedom for a given confidence level.
When the experimental F value is greater than the
theoretical F value, it is concluded that S12 is statistically
different from S
2
2 and thus the methods differ in precision.
The results for comparison of accuracy and precision between the proposed CE methodology and the TEMEX methodologies are compiled in Table 5. The statistical
results show that for both impurities, the methods are equally accurate. However, in terms of precision, gas chromatography and CE differ (pTOL analysis), whereas, polarography and CE are equivalently precise (4-CBA analysis). Differences in precision between the electrophoretic and chromatographic methods might be attributed to the larger injection volume fluctuations of the GC-FID equipment used in the analysis.
Conclusions
The use of capillary electrophoresis for the simultaneous analysis of major impurities in industrial batches of crude and highly-purified terephthalic acid has been demonstrated. The advantages of the proposed methodologies over the adopted methodologies in the industrial quality control laboratories (gas chromatography and polarography) is the possibility to determine simultaneously all relevant contaminants with a single technique in a substantially shorter analysis time (less than 7 min).
Acknowledgements
The authors wish to acknowledge the Conselho Nacional de Desenvolvimento Científico e Tecnológico (CNPq) and the Fundação de Amparo à Pesquisa do Estado de São Paulo (FAPESP) of Brazil for financial support (FAPESP 95/2396-9) and fellowships (FAPESP 97/04595-4, CNPq 301201/94-3).
References
1. Sheehan, R.J.; Terephthalic Acid, Dimethyl Terephthalate, and Isophthalic Acid, Ullmann´s Encyclopedia of Industrial Chemistry; Wiley-VCH: Germany, 2002.
2. http://www.kevlar.com/; accessed at July 11th, 2003.
3. Roffia, P.; Calini, P.; Motta, L.; Tonti, S.; Ind. Eng. Chem. Res. Dev. 1984, 23, 629.
4. Koshy, V.J.; Prasad, J.V.; Kalpana, G.; Satish, S.; Anal. Chim. Acta1995, 307, 55.
5. Cao, G.; Cavalien D’Oro, P.; Danoczy, E.; Roffia, P.; Oxidation Comm.1980, 1, 153.
6. Viola, A;. Cao, G.; J. Chromatogr. Science1996, 34, 27. 7. Cao, G.; Servida, A; Pisu, M.; Morbidelli, M.; AIChE J.1994,
40, 1168.
8. Cao, G.; Pisu, M.; Morbidelli, M.; Chem. Eng. Sci.1994, 49, 5775.
9. Beale, S.C.; Anal. Chem.1998, 70, 279R.
10. Pereira, E.A.; Cardoso, A.A.; Tavares, M.F.M.; J. AOAC International1999, 82, 1562.
Table 5. Comparative evaluation of impurities in highly-purified
terephthalic acid by different methodologies
Method pTOL 4-CBA
Mean STD Mean STD
Gas Chromatographya 155 1 6
Polarographya 15.4 1.5
Capillary Electrophoresisb 150 7.0 14.0 2.0
t-test 0.910 1.33
F-test 5.22 1.78
Tabulated values: t-parameter (95 % CL) = 1.80; F-parameter (pTOL) = 3.86; F-parameter (4-CBA) = 8.81; a4 measurements; b10
11. Klampfl, C.W.; Burchberger, W.; Haddad, P.R.; J. Chromatogr. A2000, 88, 1357.
12. Moane, S.; Park, S.; Lunte, C.E.; Smyth, M.R.; Analyst1998,
123, 1931.
13. Fonseca, F.N.; Kato, M.J.; Oliveira Jr, L.; Pinto Neto, N.; Tavares, M.F.M.; J. Microcolumn Sep.2001, 13, 227. 14. Buchberger, W.; Winna, K.; J. Chromatogr. 1996, 739, 389. 15. Jones, W.R.; Jandik, P.; J. Chromatogr. 1992, 608, 385. 16. Moring, S.E.; Pairaud, C.; Albin, M.; Locke, S.; Thibault, P.;
Tindall, G.W.; Am. Lab.1993, 7.
17. Chiou, C.; Shih, J.; Analyst1996, 121, 1107.
18. Jandik, P.; Bonn, G.; Capillary Electrophoresis of Small Molecules and Ions, VCH Publishers, Inc.: New York, 1993.
19. Volger, D.; Zemann, A.J.; Bonn, G.K.; Antal Jr, M.J.; J. Chromatogr. A1997,758, 263.
20. Zemann, A.J.; J. Chromatogr. A1997, 787, 243.
21. Colombara, R.; Tavares, M.F.M.; Massaro, S.; Rubim, J.C.; J. Capillary Electrophor.1996, 3, 147.
22. Tindall, G.W.; Perry, R.L.; J. Chromatogr. A1995, 696, 349. 23. Devore, J.L.; Probability and Statistics for Engineering and
the Sciences, 2nd ed., Brooks/Cole: Monterey, 1987.
Received: January 30, 2002
Published on the web: May 10, 2004