Article
0103 - 5053 $6.00+0.00*e-mail: [email protected]
Kinetic Study of Electrocatalytic Oxidation of Carbohydrates on Cobalt Hydroxide Modified
Glassy Carbon Electrode
Ghasem Karim-Nezhad,*,a Mohammad Hasanzadeh, a Lotfali Saghatforoush,a Nasrin Shadjou,a
Sohrab Earshadb and Balal Khalilzadehc
aDepartment of Chemistry, Payame Noor University, Khoy, Iran
bDepartment of Chemistry, Payame Noor University, Marand, Iran
cDepartment of Chemistry, Arak University, Arak, Iran
Este estudo investigou a oxidação eletrocatalítica de frutose, sacarose, glucose, lactose, arabinose e maltose em nanopartículas de hidróxido de cobalto eletrodepositadas na superfície de eletrodo de carbono vítreo em soluções alcalinas. Voltametria cíclica (VC), cronoamperometria (CA) e também medidas de polarização de estado estacionário foram empregados. Nos estudos de VC, na presença de carboidrato, o aumento na corrente de pico da oxidação do hidróxido de cobalto é seguido pelo decréscimo na correspondente corrente catódica. Isto indica que os carboidratos foram oxidados pelo mediador redox, o qual foi imobilizado na superfície do eletrodo, via um mecanismo eletrocatalítico. Com o uso da equação de Laviron, os valores dos coeficientes de transferência de elétron, anódicos e catódicos, e a constante da razão de transferência de carga para as espécies redox imobilizadas foram determinadas como 0,71 ± 0,03, 0,33 ± 0,03 e 0,21 ± 0,02 s-1, respectivamente.
A constante de velocidade, o coeficiente da transferência de elétron e os coeficientes de difusão envolvidos na oxidação eletrocatalítica dos carboidratos foram determinados.
This study investigated the electrocatalytic oxidation of fructose, sucrose, glucose, lactose, arabinose and maltose on nanoparticles of cobalt hydroxide electrodeposited on the surface of glassy carbon electrode in alkaline solutions. Cyclic voltammetry (CV), chronoamperometry (CA) techniques and also steady state polarization measurements have been employed. In CV studies, in the presence of carbohydrate the increase of the peak current of the oxidation of cobalt hydroxide is followed by a decrease in the corresponding cathodic current. This indicates that carbohydrates were oxidized by the redox mediator which was immobilized on the electrode surface via an electrocatalytic mechanism. With the use of Laviron’s equation, the values of anodic and cathodic electron-transfer coefficients and charge transfer rate constant for the immobilized redox species were determinated as 0.71 ± 0.03, 0.33 ± 0.03 and 0.21 ± 0.02 s-1, respectively. The rate constant,
the electron transfer coefficient and the diffusion coefficients involved in the electrocatalytic oxidation of carbohydrates were determined.
Keywords: carbohydrates, electrocatalysis, cobalt hydroxide,modified electrode
Introduction
Electro-oxidation of organic molecules finds wide application in the development of power sources and sensors. Numerous studies on the anode reaction of direct alcohol fuel cell1-3 bear testimony to the former application,
while studies on carbohydrate oxidation on different electrodes are aimed at the latter purpose4-13 as well as for
specific synthetic goals.14-18 Oxide electrodes are likely
to be suitable for carbohydrate oxidation because these molecules are expected to get easily adsorbed on the oxide layer by formation of hydrogen bonds via the OH groups, which facilitate electron transfer.19,20
In recent years, oxidation processes at copper, nickel, and nickel hydroxide electrodes in alkaline solution have received considerable attention because of their application to the detection of carbohydrates and related compounds in liquid chromatography21-29 and capillary electrophoresis30,31
the fact that carbohydrates are not generally electroactive at the carbon electrodes commonly used for detection in flow systems. Cobalt hydroxide allows the oxidation to proceed smoothly at constant applied potential. As a result, sensitive detection can be obtained conveniently at cobalt hydroxide modified glassy carbon (CHM-GC) electrodes with simple electrochemical instrumentation.
The purpose of the present work is the detailed investigation of carbohydrates oxidation on CHM-GC in alkaline solution aiming at the elucidation of the kinetics and the derivation of the rate constants. The electrocatalytic oxidation of carbohydrates on this type of electrode is attractive because of interest in sugar-oxygen fuel cell application, as well as sugar sensors for the medical and food industry.32-34
Experimental
All chemicals used were of analytical grade from Merck (Darmstadt, Germany) and were used without further purification. All solutions were prepared with doubly distilled water. Electrochemical measurements were carried out in a conventional three-electrode cell powered by an electrochemical system comprising an AUTOLAB system (PGSTAT12, Eco Chemie, Utrecht, The Netherlands). The system was run on a PC using GPES 4.9 softwares. A saturated calomel electrode (SCE) was a reference electrode. All potentials were measured with respect to the SCE which was positioned as close to the working electrode as possible by means of a Luggin capillary. Films of cobalt hydroxide were formed on the GC electrode with surface area 0.125 cm2 by the method
previously reported by Casella.35 The modified electrodes
were prepared by cycling the potential of the working electrode in the range of –250 to 750 mV (vs. SCE) at a scan rate of 100 mV s-1 for 70 cycles. The surface concentration
of cobalt hydroxide was controlled by the number of cycles applied in the deposition process and was electrochemically evaluated in 100 mmol L-1 NaOH solution. Prior to the
modification, the GC electrode was polished with 0.05 µm alumina suspension on a polishing micro-cloth and rinsed thoroughly with doubly distilled water. All experiments were performed at room temperature 22 ± 3 ºC.
Results and Discussion
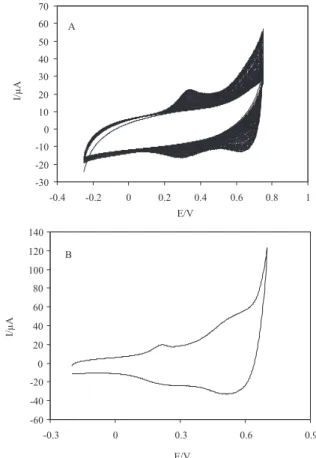
F i g u r e 1 A p r e s e n t s 7 5 c o n s e c u t ive cy c l i c voltammograms (CV) of a GC electrode in the presence of 100 mmol L-1 Na
2CO3 + 40 mmol L
-1 NaK tartrate +
4 mmol L-1 CoCl
2 at pH 11.6 recorded at a potential sweep
rate of 100 mV s-1. The voltammograms are similar to
those reported in literature.35,36 Figure 1B shows a cyclic
voltammogram of CHM-GC electrode in 100 mmol L-1
NaOH solution in the range of −200 to 690 mV recorded at a potential sweep rate of 100 mV s-1. It shows anodic
peaks located at 225 and 550 mV/SCE which are attributed to Co(II)/Co(III) and Co(III)/Co(IV) redox transitions associated with different cobalt oxide species on the electrode surface.37,38 The cathodic peaks at 186 and 522
correspond to the reduction of various cobalt oxide species formed during the positive sweep.
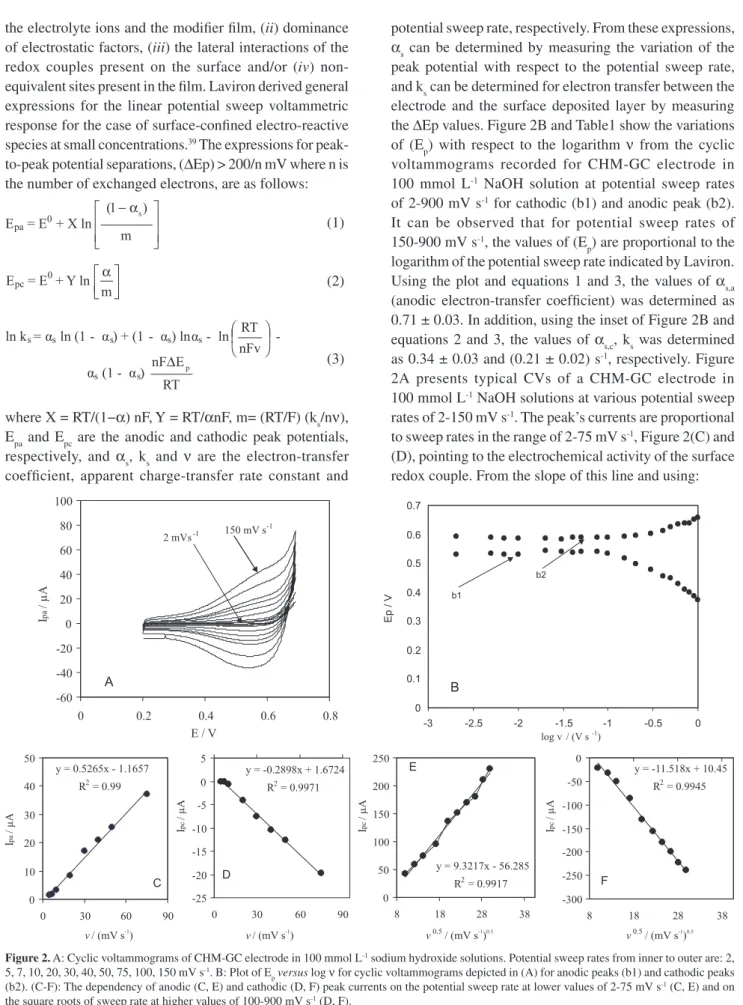
Figure 2A represents cyclic voltammograms of the CHM-GC electrode in 100 mmol L-1 NaOH solution
recorded at different potential sweep rates in a wide range of 2-150 mV s-1.The peak-to-peak potential separation
(at the potential sweep rate of 20 mV s-1) is 51 mV. The
voltammograms shown are similar to those previously reported36 and the redox transition involved is attributed
to the presence of Co (III)/Co (IV) species. The peak-to-peak potential separation deviates from the theoretical value of zero and increases at higher potential sweep rates. This result indicates a limitation in the charge-transfer kinetics, which is due to: (i) chemical interactions between Figure 1. A: Cyclic voltammograms for 4 mmol L-1 CoCl
2 + 40 mmol L -1
Na-K tartrate + 100 mmol L-1 Na
2CO3 using a GC electrode; the potential
was scanned continuously at 100 mV s-1 between −250 and 750 mV. B:
Cyclic voltamogram of CHM-GC in 100 mmol L-1 NaOH solution in the
the electrolyte ions and the modifier film, (ii) dominance of electrostatic factors, (iii) the lateral interactions of the redox couples present on the surface and/or (iv) non-equivalent sites present in the film. Laviron derived general expressions for the linear potential sweep voltammetric response for the case of surface-confined electro-reactive species at small concentrations.39 The expressions for
peak-to-peak potential separations, (ΔEp) > 200/n mV where n is the number of exchanged electrons, are as follows:
(1)
(2)
(3)
where X = RT/(1−α) nF, Y = RT/αnF, m= (RT/F) (ks/nν), Epa and Epc are the anodic and cathodic peak potentials, respectively, and αs, ks and νare the electron-transfer coefficient, apparent charge-transfer rate constant and
potential sweep rate, respectively. From these expressions,
αs can be determined by measuring the variation of the
peak potential with respect to the potential sweep rate, and ks can be determined for electron transfer between the electrode and the surface deposited layer by measuring the ΔEp values. Figure 2B and Table1 show the variations of (Ep) with respect to the logarithm ν from the cyclic voltammograms recorded for CHM-GC electrode in 100 mmol L-1 NaOH solution at potential sweep rates
of 2-900 mV s-1 for cathodic (b1) and anodic peak (b2).
It can be observed that for potential sweep rates of 150-900 mV s-1, the values of (E
p) are proportional to the
logarithm of the potential sweep rate indicated by Laviron. Using the plot and equations 1 and 3, the values of αs,a (anodic electron-transfer coefficient) was determined as 0.71 ± 0.03. In addition, using the inset of Figure 2B and equations 2 and 3, the values of αs,c, ks was determined as 0.34 ± 0.03 and (0.21 ± 0.02) s-1, respectively. Figure
2A presents typical CVs of a CHM-GC electrode in 100 mmol L-1 NaOH solutions at various potential sweep
rates of 2-150 mV s-1. The peak’s currents are proportional
to sweep rates in the range of 2-75 mV s-1, Figure 2(C) and
(D), pointing to the electrochemical activity of the surface redox couple. From the slope of this line and using:
Figure 2. A: Cyclic voltammograms of CHM-GC electrode in 100 mmol L-1 sodium hydroxide solutions. Potential sweep rates from inner to outer are: 2,
5, 7, 10, 20, 30, 40, 50, 75, 100, 150 mV s-1. B: Plot of E
pversus logν for cyclic voltammograms depicted in (A) for anodic peaks (b1) and cathodic peaks
(b2). (C-F): The dependency of anodic (C, E) and cathodic (D, F) peak currents on the potential sweep rate at lower values of 2-75 mV s-1 (C, E) and on
(4)
where G* is the surface coverage of the redox species and ν being the potential sweep rate 40 and taking average
of both cathodic and anodic results, G*values of around
1.98 × 10⁻⁹ mol cm-2 have been derived. In the high range
of sweep rates this dependency is of square root form, Figures 2E and 2F, indicating the dominance of the diffusion controlled processes.
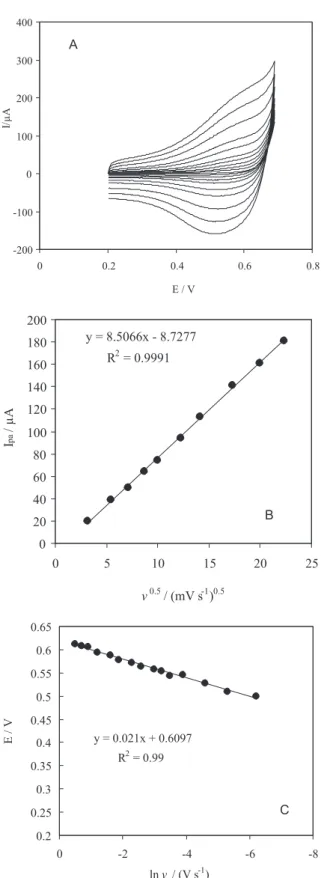
Figure 3A illustrates cyclic voltammograms of 0.8 mmol L-1 glucose using the CHM-GC electrode recorded
at different potential sweep rates. Figure 3B indicates that the anodic peak currents increased linearly with the square root of the potential sweep rate, which indicates a mass transfer-controlling process of oxidation via diffusion. In addition the value of the electron-transfer coefficient for the reaction can be obtained from the following equation: 41
(5)
This is valid for a totally irreversible diffusion-controlled process. Using the dependency of anodic
peak potential on the neperian logarithm of the potential sweep rate (Figure 3C), the value of the electron-transfer coefficient was obtained as (0.59 ± 0.03). Tafel slope is (41.99 ± 0.03). On the basis of the slopes of the linear dependency of the anodic peak currents on the square root of the potential sweep rates (Figure 3B), and the Randles-Sevcik equation: 40
(6)
where Ip is the peak current, A is the electrode surface area, D is the diffusion coefficient, and C* is the bulk
concentration of carbohydrates, the diffusion coefficient for glucose was calculated to be (9.1 ± 0.03) ×10-6 cm2 s-1.
Figure 4A presents the CVs of CHM-GC both in the absence (a) and 0.3 mmol L-1 (low concentration) glucose
in100 mmol L-1 NaOH solution (b). At CHM-GC electrode,
oxidation of glucose resulted in a typical electrocatalytic response. In the presence of glucose, it was observed that the anodic current and the associated anodic charge increased drastically, while the cathodic current and the corresponding charge decreased. In the presence of glucose the ratio ipa/ipc was 82.6 when in absence of it this ratio was decreased to 23.2. This result indicates that glucose is oxidized by active Co(IV) moiety through a cyclic mediation redox process. Cobalt species are immobilized on the electrode surface, and the one with a higher valence oxidizes to Co(IV) via a chemical reaction followed by generation of low-valence cobalt (Co(III) species). Along this line, the high-valence oxide is regenerated through the external electrical circuit. Accordingly, glucose is oxidized
via an EC'mechanism.
Figures 4B, C show that upon increasing glucose concentration its irreversible oxidation develops in the region of the electrochemical formation of Co(IV). Thus, it is likely that the electro-generated Co(IV) species is the active moiety which efficiently speeds up the oxidation of carbohydrates. Any increase in the concentration of carbohydrates causes a proportional almost linear enhancement of the anodic wave. It is worthy to emphasize that the anodic formation of Co(IV) seems to be an irreversible process. Also, plotting the current function (peak current divided by the square root of the potential sweep rate) against the square root of the potential sweep rate (Figure 5) revealed negative slope confirming the electrocatalytic nature of the process.
The redox transition of cobalt species present in the film is:
(7) Table 1. Values of the scan rate(v), Epa and Epc obtained from cyclic
voltammetry method in NaOH 100 mmol L-1
v /(mV s-1) Epa Epc
2 0.592 0.53
5 0.59 0.532
7 0.586 0.53
10 0.585 0.542
20 0.5851 0.539
30 0.5817 0.537
40 0.588 0.541
50 0.5887 0.539
75 0.588 0.532
100 0.5886 0.520
150 0.592 0.498
200 0.5958 0.478
300 0.603 0.456
400 0.613 0.447
500 0.6256 0.43
600 0.633 0.408
700 0.637 0.398
800 0.639 0.386
900 0.65 0.380
Figure 3. A: Cyclic voltammograms of the CHM-GC electrode in 100 mmol L-1 NaOH solution in the presence of 0.8 mmol L-1 glucose at
various potential sweep rates of 5, 10, 50, 75, 100, 150, 200, 300, 400, 500, 600 mV s-1. Inset A: typical cyclic voltammograms of the CHM
electrode in 100 mmol L-1 NaOH solution at sweep rate 50 mV s-1. B:
Dependence of anodic peak current during the forward sweep on the square roots of potential sweep rate. C: Dependence of the peak potential on ln νfor the oxidation of glucose at CHM-GC electrode obtained from the data of panel (A).
Figure 4. A: Cyclic voltammograms of the CHM-GC electrode in 100 mmol L-1 NaOH solution in the absence (a) and the presence
(b) 0.3 mmol L-1 of glucose. Potential sweep rate was 100 mV s-1.
And glucose is oxidized on the modified surface via
the following reaction:
(8)
(9)
The oxidation process on the CHM-GC electrode exhibited similar electrocatalytic responses for other carbohydrates, fructose, arabinose, lactose, maltose, sucrose; thereby exhibiting its capability for selective oxidation of carbohydrates.
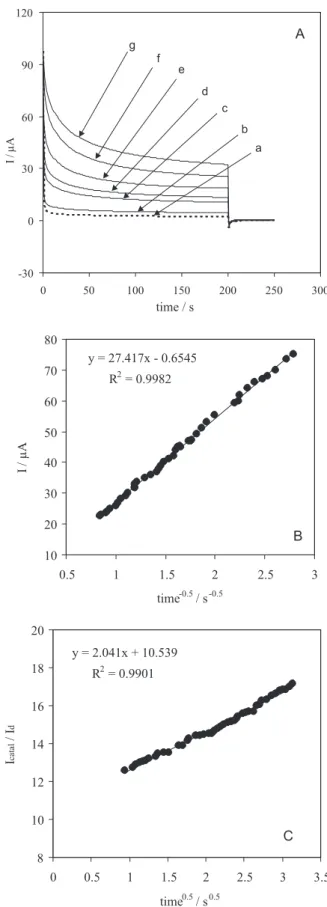
Chronoamperometry, as well as cyclic voltammetry, has been employed for the investigation of the processes occurring
via ErCi mechanism.40 Double steps chronoamperograms
were recorded by setting the working electrode potentials to desired values and were used to measure the catalytic rate constant on the modified surface. Figure 6A shows double steps chronoamperograms for the modified electrode in the absence (a) and presence (b: 0.8, c: 3, d: 5, e: 10, f: 25 and 50 mmol L-1) of glucose over a concentration range of
0.8-50 mmol L-1. The applied potential steps were 230 and
560 mV, respectively. The plot of net current versus time-0.5/s-0.5
which has been obtained by removing the background current by the point-by-point subtraction method gives a straight line that level off around 13 µA, Figure 6B. This indicates that the transient current must be controlled by a diffusion process. The transient current is due to catalytic oxidation of glucose and the current increases as the glucose concentration is raised. No significant cathodic current is observed when the electrolysis potential is stepped to 230 mV/SCE indicating the irreversible nature of the oxidation of carbohydrates by using the slopes of these lines; we can obtain the diffusion coefficients of the glucose according to the Cottrell equation: 40
Figure 5. Current function vs.ν 0.5 for 100 mmol L-1 NaOH solutions in
the presence of 3 mmol L-1 glucose.
Figure 6. A: Double steps chronoamperograms of CHM-GC electrode in the absence (a) and the presence of 0.8 (b), 3 (c), 5 (d), 10 (e), 25 (f) and 50 mmol L-1 (g) glucose in 100 mmol L-1 NaOH solution. Potential
steps were 560 mV and 230 mV, respectively. B: Dependence of transient current on time−0.5/s-0.5. C: Dependence of I
catal/Id on time
0.5 /s0.5 derived from
(10)
where D is the diffusion coefficient, and C* is the bulk
concentration. The mean value of the diffusion coefficients of glucose was found to be (6.49 ± 0.02) ×10-6 cm2 s-1. These
values are in agreement with those obtained using cyclic voltammetry (Figure 3).
The rate constants of the reactions of glucose and the ensued intermediates with the redox sites of the CHM-GC electrode can be derived from the chronoamperograms according to: 40
(11)
where Icatal is the catalytic current in the presence of glucose, Id the limiting current in the absence of glucose and λ= kCt (k , C and t are the catalytic rate constant, bulk concentration of glucose and the elapsed time, respectively) is the argument of the error function. For λ > 1.5, erf (λ1/2)
almost equals unity and equation 11 reduces to:
(12)
From the slope of the Icatal/Id plot the value of k at a given concentration of glucose is derived. The mean value of k in the concentration range of 0.8-50 mmol L-1 was found
to be (2.64 ± 0.03) ×104 cm3 mol-1 s-1. It should be pointed
out that k is either k2 or k3 whichever is smaller.
Similar chronoamperograms were collected for fructose, arabinose, lactose, maltose and sucrose. The values of D and kobtained according to the method described above for these carbohydrates were reported in Table 2. Figure 7 presents chronoamperograms of other carbohydrates at 25 mmol L-1. Herein, it can be qualitatively deduced
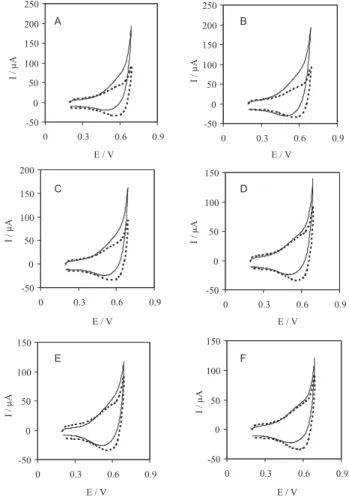
from the cyclic voltammograms depicted in Figure 8 that the CHM-GC electrode has a catalytic activity toward the carbohydrates in the relation of lactose > glucose ≥ fructosemaltose > arabinose > sucrose. The fact that lactose
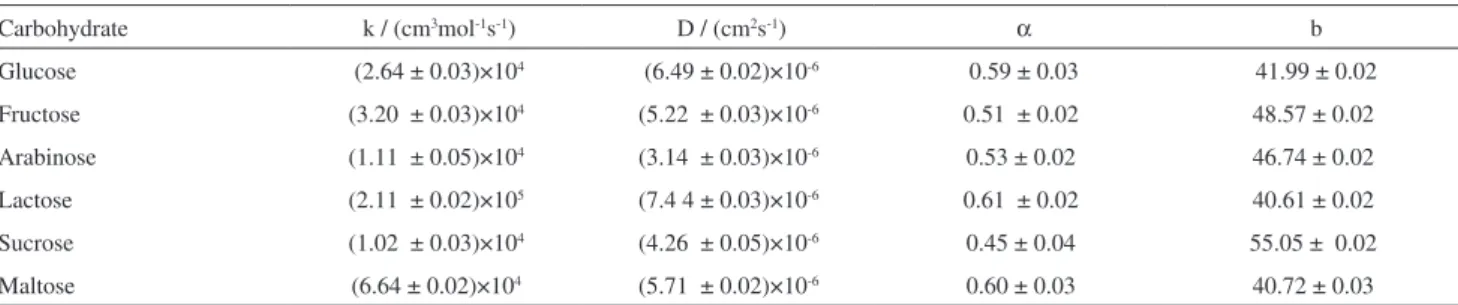
Table 2. The electrocatalytic reaction rate constants (k), the diffusion coefficients (D) and the electron transfer coefficient (α), Tafel slop (b) for the carbohydrates
Carbohydrate k / (cm3mol-1s-1) D / (cm2s-1) α b
Glucose (2.64 ± 0.03)×104 (6.49 ± 0.02)×10-6 0.59 ± 0.03 41.99 ± 0.02
Fructose (3.20 ± 0.03)×104 (5.22 ± 0.03)×10-6 0.51 ± 0.02 48.57 ± 0.02
Arabinose (1.11 ± 0.05)×104 (3.14 ± 0.03)×10-6 0.53 ± 0.02 46.74 ± 0.02
Lactose (2.11 ± 0.02)×105 (7.4 4 ± 0.03)×10-6 0.61 ± 0.02 40.61 ± 0.02
Sucrose (1.02 ± 0.03)×104 (4.26 ± 0.05)×10-6 0.45 ± 0.04 55.05 ± 0.02
Maltose (6.64 ± 0.02)×104 (5.71 ± 0.02)×10-6 0.60 ± 0.03 40.72 ± 0.03
exhibited a slightly more facile oxidation at the cobalt hydroxide electrode than glucose suggested that the primary functionality required for the process might be the hydroxy group or, more likely, several adjacent hydroxy groups.
The rate laws for the reactions 7 and 8 have the forms of:
(13)
(14)
where G is the total number of adsorption sites per unit area of the electrode surface, θ’s represent the fractional surface coverage of different cobalt valence states and Cm is the bulk concentration of glucose. With only the 3 and 4 valence states of cobalt prevailing one has:
(15) Figure 7. Chronoamperograms of the CHM-GC electrode in 100 mmol L-1
NaOH solution in the absence (a) and the presence of 25 mmol L-1 of
Figure 8. Cyclic voltammograms of the CHM-GC electrode in 100 mmol L-1 NaOH solution in the absence (----) and the presence of
0.8 mmol L-1 ( –––), A: glucose, B: fructose, C: arabinose, D: sucrose,
E: lactose, F: maltose. Potential sweep rate was 100 mV s-1.
And the rates of changes of their surface coverages as well as that of the intermediate compounds are:
(16)
(17)
where Ci is the concentration of the intermediate. Assuming that the steady state dominates:
(18)
(19)
One arrives at the values if the coverages:
(20)
(21)
And subsequently:
(22)
On the basis of this rate equation the faradic current will be:
(23)
where A is the surface area of the electrode and the rate constants k1and k-1 are obviously potential dependent and are of the forms:
(24)
(25)
where kº’s are the chemical rate constants measured at E/SCE = 0 with α being the anodic transfer coefficient and other parameters have their usual meanings. Equation 23 is well suited for the calculation of rate constants and the validity test of the kinetics and mechanism of the oxidation process.
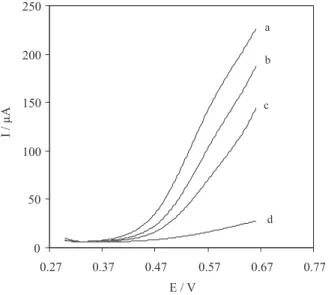
The pseudo-steady state polarization curves of the electro-oxidation of glucose on CHM-GC electrode at a number of glucose concentrations are presented in Figure 9. The oxidation process was found to begin at nearly 400 mV/SCE and to reach a plateau at 615 mV/SCE while the oxygen evolution starts at still higher potentials. In the course of reaction the coverage of Co(IV) increases and reaches a saturation (steady state) level and the oxidation current follows accordingly. According to equation 23 the plots of the inverse of current against the inverse of glucose concentration should be linear:
(26)
Figure 10A presents the I-1versus C m
-1 dependencies
where straight lines at various potentials have been obtained. Both the intercepts and slopes of the straight lines appearing in this figure were potential dependent. The slopes are plotted against exp (_nFE/RT) with n = 1 and the
Figure 9. Typical pseudo-steady state polarization curves of CHM-GC electrode obtained in 50 (a), 25 (b), 10 (c) and 5 mmol L-1 glucose (d),
respectively. The potential sweep rate is 0.005 mV s-1.
Figure 10. A: Plot of i-1(from polarization curves in Figure 9) against C m
-1
at various potentials: 470, 483, 509, 534, 561, 585, 612 mV/SCE as curves (a-g). B: Plot of the slopes (of curves in A) vs. exp (_nFE/RT). C: Plot of
the ln (intercepts) (of curves in A) vs. applied potential. with equations 26 reveals that the rate constant of reaction
8, k2G and the ratio of kº-1/kº1 are 2.33×10⁻¹⁰ cm s-1 and
2.81×10⁸, respectively. Figure 10C presents the variation
of the intercepts of the lines in Figure 10A with the applied potential in a semi-log scale. Using this graph and equation 26 the magnitudes of kº1G and the anodic transfer coefficient of 4.71×10⁻⁸ mol s-1 cm-2 and 0.43 have been obtained.
From the above findings the value of kº-1G was worked out to be 1.32 ×10 mol s-1cm-2. Similar pseudo-steady state
polarization curves were collected for fructose, arabinose, lactose, maltose and sucrose. The values of k2G, kº1G and
α obtained according to the method described above for these carbohydrates were reported in Table 3.
For undergoing electrochemical oxidation these molecules have to get adsorbed on the electrode surface, which can occur by formation of H-bonds between the OH groups and the cobalt hydroxide layer. The electron transfer is likely to be more efficient when an OH group attached to a carbon atom adjacent to the C=O group becomes involved in adsorption. It can be seen that lactose has several OH groups (scheme 1) fructose has two OH groups (C1 and C3 Table 3. Values of the k2G, kº1G andαobtained from polarization curves
α kº1G / (mol s-1 cm-2) k 2G / (cm s
-1 ) carbohydrates
0.43 ± 0.03 4.71×10⁻⁸ 2.33×10⁻¹⁰ Glucose
0.48 ± 0.02 9.11×10⁻⁸ 1.04×10⁻⁹ Fructose
0.44 ± 0.02 2.53×10⁻⁹ 8.30×10⁻¹¹ Arabinose
0.59 ± 0.02 3.33×10⁻⁸ 5.88×10⁻⁹ Lactose
0.41 ± 0.04 7.05×10⁻⁹ 6.64×10⁻¹¹ Sucrose
in Scheme 1), thus making the former oxidation statistically more probable. This may be the reason behind the enhanced electrochemical oxidation kinetics of lactose compared to fructose and other carbohydrates. It is clear that the presence of a larger number of hydroxyl groups facilitates the oxidation. It appears that the presence of at least two hydroxy groups constitutes a minimum requirement for facile oxidation.
Conclusions
This work presents the preparation and usefulness of cobalt hydroxide (oxide) modified glassy carbon electrodes for electro-oxidation of carbohydrates in alkaline solution. The electrode was electrocatalytically active around 530 mV/SCE where the carbohydrate on GC electrode showed no activity. Chronoamperometric experiments showed a large anodic current at the oxidation potential of low valence cobalt hydroxide (oxide) in further support of the mediated electro-oxidation. Using cyclic voltammetry and chronoamperometry techniques, the kinetic parameters of these carbohydrates, such as charge-transfer coefficient, catalytic reaction rate constant and diffusion coefficient for oxidation, were determined. Oxidation of monosaccharide and disaccharide on these modified electrodes is found to follow a catalytic EC’ mechanism in which Co(IV) is continuously generated and consummed on the surface. Within these carbohydrates lactose is oxidized more easily than sucrose owing to the presence of greater number of hydroxy groups adjacent to the carbonyl group in the former case. The unique properties of this electrode suggest several potential analytical applications. First, the electrode may be used as a detector in liquid chromatography or capillary electrophoresis. The electrode may also be used as a glucose sensor in some environments. Finally we noticed that the peak current values exhibited a linear dependence on concentration of glucose, suggesting the utility of the modified electrodes for analytical applications. This analytical aspect is under study and will be presented in detail in our future communications.
Scheme 1. Chemical structure of lactose (1) and fructose (2).
Reference
1. Wasmus, S.; Kuver, A.; J. Electroanal. Chem.1999, 461, 14. 2. Liu, H.; Song, C.; Zhang, L.; Zhang, J.; Wang, H.; Wilkinson,
D. P.; J. Power Sources 2006,155, 95.
3. Lamy, C.; Rousseau, S.; Belgsir, E. M.; Coutanceau, C.; Leger, J. M.; Electrochim. Acta2004, 49, 3901.
4. Zadeii, J. M.; Marioli, J.; Anal. Chem.1991, 63, 649. 5. Santos, L. M.; Baldwin, R. P.; Anal. Chem. 1987, 59, 1766. 6. Reim, R. E.; Van Effen, R. M.; Anal. Chem. 1986, 58, 3203. 7. Zhang, X.; Chan, K.Y.; Tseung, A. C. C.; J. Electroanal. Chem.
1995, 386, 241.
8. Wang, J.; Taha, Z.; Anal. Chem. 1990, 62, 1413.
9. Deo, R. P.; Wang, J.; Electrochem. Commun. 2004, 6, 284. 10. Lee, J.; Park, S. M., Anal. Chim. Acta 2005, 545, 27. 11. Ojani, R.; Raoof, J. B.; Salmany-Afagh, P.; J. Electroanal.
Chem.2004, 571, 1.
12. Park, S.; Chung, T. D.; Kim, H. C.; Anal. Chem.2003, 75, 3046.
13. Tominaga, M.; Shimazoe, T.; Nagashima, M.; Kusuda, H.; Kubo, A.; Kuwahara, Y.; Taniguchi, I.; J. Electroanal. Chem.
2006, 590, 37.
14. Bamba, K.; Leger, J. M.; Garnier, E.; Bachmann, C.; Servat, K.; Kokoh, K. B.; Electrochim. Acta2005, 50, 3341.
15. Parpot, P.; Pires, S. G.; Bettencourt, A. P.; J. Electroanal. Chem.
2004, 566, 401.
16. Torto, N.; Ruzgas, T.; Gorton, L.; J. Electroanal. Chem. 1999,
464, 252.
17. Parpot, P.; Kokoh, K. B.; Belgsir, E. M.; Leger, J. M.; Beden, B.; Lamy, C.; J. Appl. Electrochem.1997, 27, 25.
18. Governo, A. T.; Proenca, L.; Parpot, P.; Lopes, M. I. S.; Fonseca, I. T. E.; Electrochim. Acta2004, 49, 1535.
19. Danaee, I.; Jafarian, M.; Forouzandeh, F.; Gobal, F.; Mahjani, M. G.; Electrochim. Acta2008, 53, 6602.
20. Cataldi, T. R. I.; Guerrieri, A.; Casella, I.; Desimoni, E.;
Electroanalysis1995, 7, 305
21. Prabhu, S. V.; Baldwin, R. P.; Anal. Chem.1989, 61, 852. 22. Prabhu, S. V.; Baldwin, R. P.; Anal. Chem.1989, 61, 2258. 23. Luo, P.; Prabhu, S. V.; Baldwin, R. P.; Anal. Chem.1991, 62,
752.
24. Prabhu, S. V.; Baldwin, R. P.; J. Chromatogr.1991, 513, 227. 25. Luo, P.; Zhang, F.; Baldwin, R. P.; Anal. Chim. Acta1991, 244,
169.
26. Luo, M. Z.; Luo, P.; Baldwin, R. P.; J. Chem. Educ.1993, 711, 679.
27. Zadeii, J. M.; Marioli, J.; Kuwana, T.; Anal. Chem.1991, 63, 649.
28. Xie, Y.; Huber, C. O.; Anal. Chem.199l, 63, 1714.
29. Mannino, S.; Rossi, M.; Ratti, S.; Electroanalysis1991, 3, 71 I. 30. Colon, L. A.; Dadoo, R.; Zare, R. N.; Anal. Chem.1993, 65,
31. Ye, J.; Baldwin, R. P.; Anal. Chem.1993, 65, 3525.
32. Majumdar, G.; Goswami, M.; Sarma, T. K.; Paul, A.; Chattopadhay, A.; Langmuir2005, 21, 1663.
33. Palmore, G. T. R.; Kim, H. H.; J. Electroanal. Chem.1999,
464, 110.
34. Heller, A.; Phys.Chem. Chem. Phys.2004, 6, 209. 35. Casella, I.G.; J. Electroanal. Chem.2002, 520, 119.
36. Jafarian, M.; .Mahjani, M. G.; Heli, H.; Gobal, F.; Khajehsharifi, H.; Hamedi, M. H.; Electrochim. Acta2003, 48, 3423.
37. Barbero, C.; Planes, G. A.; Miras, M. C.; Electrochem. Commun.
2001, 3, 113.
38. Bruckenstein, S.; Shay, M.; J. Electroanal. Chem.1985, 188, 131.
39. Laviron, E.; J. Electroanal. Chem.1979, 101, 19.
40. Bard, A. J.; Faulkner, L. R.; Electrochemical Methods, John Wiley and Sons: New York, 2001.
41. Harrison, J. A.; Khan, Z. A.; J. Electroanal. Chem.1970, 28, 131.