Lombard’s effect’s implication
in intensity, fundamental
frequency and stability on
the voice of individuals with
Parkinson´s disease
Summary
Araken Quedas 1, André de Campos Duprat 2, Gisele Gasparini 3
1 M.S in Otorhinolaryngology, Otorhinolaryngologist.
2 PhD in Otorhinolaryngology, Professor of Otorhinolaryngology - School of Medical Sciences of Santa Casa de São Paulo. 3 Specialist in Voice, Speech Therapist at the Centro de Estudos da Voz.
Department of Otorhinolaryngology - Medical Sciences School Santa Casa de São Paulo.
Send correspondence to: A. Quedas - Rua Maestro João Gomes de Araújo 50 cj 33 Santana São Paulo SP 02332-020. CNPQ.
Paper submitted to the ABORL-CCF SGP (Management Publications System) on August 8th, 2006 and accepted for publication on September 23th, 2006. cod. 3324.
P
arkinson´s disease affects the central nervous system resulting in voice quality alterations. It is typically resistant to drug therapy and often persists despite extensive behavioural speech and language therapy. Previous findings show that masking noise will produce a consistent increase in voice intensity in most normal individuals (Lombard’s effect). Aim: we evaluated Lombard’s effect’s implication in intensity, fundamental frequency and stability on the voice of individuals with Parkinson´s disease (N=17). Material and methods: through acoustic analysis, we evaluated intensity alterations and fundamental frequency, before and after white masking noise 40, 70 and 90 dBSL intensities, as well as variations during each vocalization and compared with a control group (N=16). Results: voice intensity varied according to masking intensity, tending to non-linear increases in both groups and gender. Fundamental frequency varied, tending to non-linear increase in both groups and gender. Improvement stability occurred in fundamental frequency and vocal intensity. Conclusion: Lombard’s effect increased intensity, fundamental frequency and improves voice stability on these patients. Study: clinical and experimental.Keywords: speech acoustics, parkinson´s disease, voice.
ORIGINAL ARTICLE Rev Bras Otorrinolaringol
INTRODUCTION
Parkinson’s Disease (PD) was described in 1817 by an English Physician called James Parkinson, publi-shed with the title: “An assay on agitating paralysis”. It is a disease that affects the central nervous system, more specifically the neurons of the mesencephalic substantia nigra, responsible for releasing dopamine. A reduction in dopamine results in less inhibition of the basal nuclei’s activities, more precisely that of the corpus striatum, re-sulting in muscle rigidity, bradykinesia, tremor at rest and
postural disorders1.
As far as speech is concerned, these patients have: intensity reduction (this is the major and most marked vocal alteration, it is progressive as the disease evolves), vocal instability, monotones, qualitative alterations such as tremor, hoarseness and pitch alterations, difficulties to start a phrase, articulatory alterations, accelerated speech and words repetition in an unconscious and uncontrolled way. This set of alterations is called hypokinetic dysarthria
or disartrophonia2-8.
As an alternative to reduce the complaints of hypo-phonia in these patients, some authors have used auditory
masking with the aim of improving voice intensity11,12. This
method is known as the Lombard’s Effect, which makes it natural for the individual to speak louder, because of noise exposure, preventing him to hear it properly, or
because of hearing loss9. The mechanisms involved in this
phenomenon are yet to be established10.
Lombard’s Effect (LE) was studied, and there was a marked improvement in voice intensity of these patients when submitted to auditory masking at 90dB SPL (decibels
sound pressure level)11. Other authors12 also studied the
LE’s repercussion on the voice of patients with Parkinson’s, submitting them to auditory masking with 10 and 20 dBSL (decibels sensation level), and they did not obtain the same
results achieved by Adams, Lang (1992)11.
The little information on this topic and the lack of agreement among the few papers available, about the method or the results attained, has triggered the interest for a study assessing the behavior of sound intensity and fundamental frequency, as well as voice utterance stabi-lity in this group of patients when exposed to auditory masking.
Thus, this paper aimed at assessing, by means of an acoustic analysis, LE’s interference on the intensity and fundamental frequency in the voices of patients with PD, as well as the stability of each utterance.
MATERIALS AND METHODS
This study was approved by the Ethics Committee of our Institution, under protocol # 070/06.
Participants
We selected 33 participants: Patients with Parkinson’s (N=17, 8 men and 9 women) and the Control Group (N=16, 8 men and 8 women). All the participants freely signed the Informed Consent Form after being duly infor-med about the procedures.
Inclusion Criteria for the Parkinson’s Group
1. Patients diagnosed with idiopathic Parkinson’s Disease (PD), without other associated neurological di-sorders.
2. Audiometric threshold averages equal to or below 20dB hearing level (dBHL) in the frequencies of 500, 1000 and 2000 Hz, in both ears.
3. Have vocal quality between zero and one in the item: level of dysphonia, in the GRBAS scale13.
4. Have language impairment level between zero and one in the Webster scale14 of PD disability assess-ment scale.
5. Have general impairment level between stages one and two in the Hoehn and Yahr’s scale15.
6. Use L-Dopa as drug treatment 7. Age between 60 and 75 years.
Exclusion criteria for the Parkinson’s Group
We excluded those individuals who did not fit in items 1 to 7.
Control Group
We selected 16 individuals (8 women and 8 men) without auditory or vocal complaints, with ages varying between 60 and 75 years, who were later evaluated accor-ding to items 2 and 3 as inclusion criteria for this group.
Procedures
Auditory evaluation
We carried out tonal audiometry in the frequencies of 500, 1,000 and 2,000Hz in both ears.
Perceptive vocal assessment
An assessment, according to the GRBAS and Webs-ter scales, carried out by three speech therapists and two otorhinolaryngologists, followed by the classification in each one of these scales, with the agreement of at least four evaluators.
Voice capture
at 40, 70 and 90 decibels sensation level (dBSL)17.
Acoustic analysis
The data set collected was submitted to acoustic analysis by the voxmetria® software, in which we analyzed intensity variation in dB and the fundamental frequency in Hz of vocal utterance, before and after auditory masking, indirectly assessed by standard deviation within each utterance.
Statistical Analysis of the Data
For each parameter analyzed, we assessed the follo-wing factors: auditory masking intensity interference, the behavior of the Control and the Parkinson’s Groups, the behavior of males and females, the difference between the control and Parkinson’s groups, differences between males and females, and the behavior of gender and group factors when assessed simultaneously.
The comparisons made between Parkinson and con-trol were expressed as average and statistically analyzed by Repetitive Measures Variance Analysis.
In all the tests, we used a significance level of 5% (p 0.05).
RESULTS
Intensity
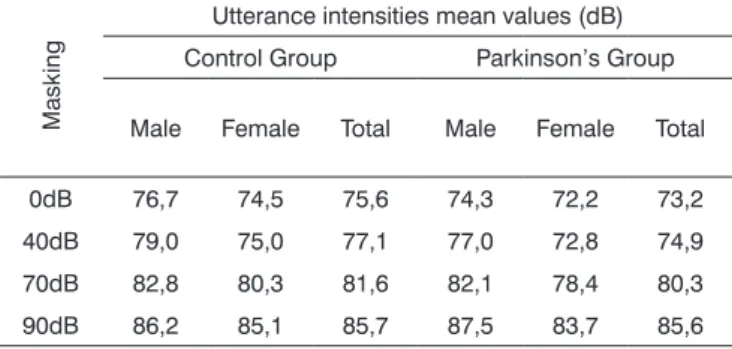
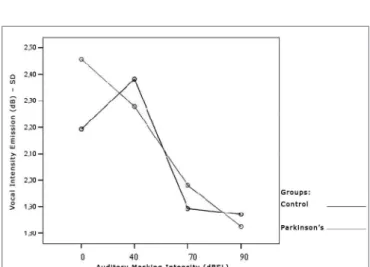
Tables 1 and 2 show that vocal utterance intensity varies according to masking intensity (p<0.001), tending towards a non-linear increase (p<0.001). This increase is not influenced by Group (p=0.066) and nor by gen-der (p=0.683). There is no behavior difference between genders (p=0.240) nor between groups (p=0.430). When we compared both groups and genders simultaneously, behavior is similar (p=0.826). Such results show that, regardless of the group studied and gender, the trend is always of intensity increase. The graph represented in Figures 1, 2 and 3 show vocal utterance intensity behavior in the control and Parkinson’s Groups, as well as male and female genders.
Table 1. Utterance intensity average in dB, according to the auditory masking, by group and gender.
Masking
Utterance intensities mean values (dB) Control Group Parkinson’s Group
Male Female Total Male Female Total
0dB 76,7 74,5 75,6 74,3 72,2 73,2 40dB 79,0 75,0 77,1 77,0 72,8 74,9 70dB 82,8 80,3 81,6 82,1 78,4 80,3 90dB 86,2 85,1 85,7 87,5 83,7 85,6
Table 2. Vocal utterance intensity repetitive measures variance analysis.
Factor p value
Masking intensity < 0.001
Group interaction 0.066
Gender interaction 0.683
Group differences 0.430
Gender differences 0.240
Group x gender interaction 0.826
Figure 1. Vocal utterance intensity (dB), according to auditory masking intensity in the Control and Parkinson’s Groups.
Intensity stability within each vocal utterance
This parameter was indirectly assessed through the intensity standard deviation within each vocal utterance.
Tables 3 and 4 show that the intensity standard deviation within each vocal utterance varies according to masking intensity (p<0.001), tending towards a non-linear reduction (p<0.001). This reduction is not influenced by group (p=0.557), nor by gender (p=0.807). There is no behavior difference between the genders (p=0.180) nor between the groups (p=0.776). When compared both groups and genders simultaneously, behavior was similar (p=0.460). Thus, the results show a trend towards stability, with a more uniform vocal utterance as far as intensity is concerned. The graphs shown on Figures 4, 5 and 6 present the intensity standard deviation behavior in each utterance in the Control and Parkinson’s Groups, as well as in males and females.
Table 3. Mean values of the intensity standard deviations within each vocal utterance in dB, according to auditory masking by group and gender.
Masking
Utterance intensities standard deviation mean values (dB)
Control Group Parkinson’s Group Male Female Total Male Female Total 0dB 2,4 1,9 2,1 2,6 2,3 2,5 40dB 2,7 2,0 2,4 2,2 2,4 2,3 70dB 1,9 1,8 1,9 2,2 1,8 2,0 90dB 1,9 1,8 1,9 1,8 1,8 1,8
Table 4. Repetitive measures variance analysis for the intensity stan-dard deviation within each vocal utterance.
Factor p Value
Masking intensity < 0.001
Group interaction 0.557
Gender interaction 0.807
Group differences 0.776
Gender differences 0.180
Group x gender interaction 0.460
Figure 3. Vocal utterance intensity (dB), according to auditory masking intensity in the Parkinson’s Group, males and females.
Figure 4. Vocal utterance intensity standard deviation (dB), according to auditory masking intensity, Control and Parkinson’s Group.
Vocal utterance frequency
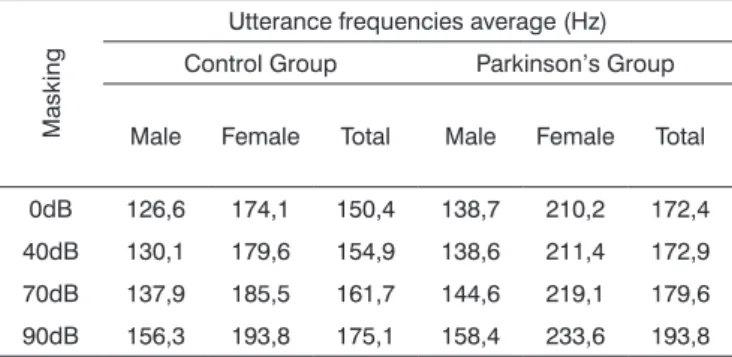
Tables 5 and 6 show that vocal utterance frequency varies according to masking intensity (p<0.001), tending towards non-linear increase (p<0.001). This increase is not influenced by group (p=0.747) nor by gender (p=0.640). There is a behavior difference between genders (p<0.001), and it was higher for females. Repetitive measures variance analysis suggests a difference between groups (p=0.056), which was higher in the Parkinson’s group. When we compared both groups and gender simultaneously, the behavior was similar (p=0.201). This result means that, in both groups and genders there is an increase in vocal utterance frequency during exposure to auditory masking. The behavior in both the Control and Parkinson’s groups, as well as in males and females can be seen in the charts shown in Figures 7, 8 and 9.
Figure 6. Vocal utterance intensity standard deviation (dB), according to auditory masking intensity, Parkinson’s Group males and females.
Table 5. Utterance frequencies average in Hz, according to auditory masking, by group and gender.
Masking
Utterance frequencies average (Hz) Control Group Parkinson’s Group
Male Female Total Male Female Total
0dB 126,6 174,1 150,4 138,7 210,2 172,4 40dB 130,1 179,6 154,9 138,6 211,4 172,9 70dB 137,9 185,5 161,7 144,6 219,1 179,6 90dB 156,3 193,8 175,1 158,4 233,6 193,8
Table 6. Variance analysis of the repeated vocal utterance fre-quency.
Factor p Value
Masking intensity < 0.001
Group interaction 0.747
Gender interaction 0.640
Group differences 0.056
Gender differences < 0.001 Group x gender interaction 0.201
Figure 7. Vocal utterance frequency (Hz), according to auditory masking intensity, Control and Parkinson’s groups.
Frequency stability within a given vocal utterance
This parameter was assessed indirectly through the frequency standard deviation within each vocal ut-terance.
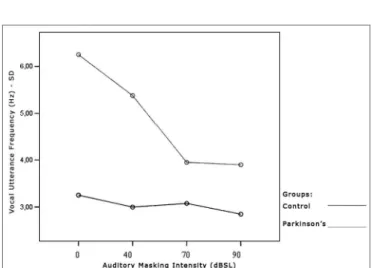
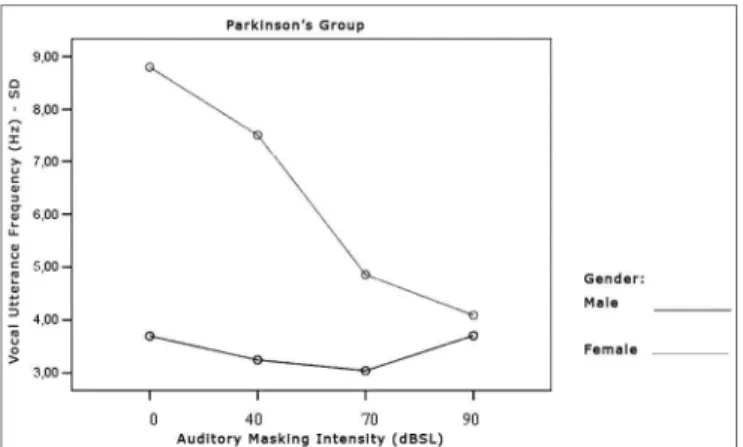
Tables 7 and 8 show that the frequency standard deviation within each vocal utterance varies according to masking intensity (p<0.001), tending towards non-linear reduction (p<0.001). This reduction occurs differently in the different groups (p=0.012) and genders (p=0.002). This behavior difference does not allow testing the differences between the Control and the Parkinson’s Group and betwe-en males and females. It is possible to suggest that there is a trend towards vocal utterance frequency stability. The graphs presented in Figures 10, 11 and 12 show different behavior between the Control and Parkinson’s groups, as it happens between males and females in both groups. Figure 9. Vocal utterance frequency (Hz), according to auditory masking intensity, Parkinson’s group, males and females.
Table 7. Average value of frequency standard deviation within each vocal utterance in Hz, according to auditory masking, by group and gender.
Masking
Mean values of the standard deviation in the utterance frequencies (Hz)
Control Group Parkinson’s Group Male Female Total Male Female Total 0dB 2,7 3,7 3,2 3,7 8,8 6,1 40dB 2,5 3,5 3,0 3,2 7,5 5,2 70dB 2,6 3,6 3,1 3,0 4,8 3,9 90dB 2,6 3,1 2,8 3,7 4,1 3,9
Table 8. Variance analysis of the frequency standard deviation mea-sures within each vocal utterance.
Factor p Value
Masking intensity <0.001
Group interaction 0.012
Gender interaction 0.002
Group difference 0.003
Gender difference 0.002
Group x gender difference 0.086
Figure 10. Vocal utterance frequency standard deviation (Hz), accor-ding to auditory masking intensity, Control and Parkinson’s groups.
DISCUSSION
Voice neural control involves integration between the somatic motor system and the limbic system, invol-ving fibers that go from the cortex, passing through the
basal nuclei and by the mesencephalic substantia nigra18.
The basal nucleus plays an important role in modulating
cortical impulses19. Such modulation is reduced in PD,
because of degeneration in the substantia nigra present at the base of the mesencephalus, involving not only dopa-minergic neurons, but also other structures that produce serotonin, noradrenalin and acetylcholine in the genesis of the disease. The affected zone influences extra-pyramidal motor control, in other words, they control autonomous movements such as facial muscles (unconscious emotional communication), for example. Moreover, these neurons modify basic conscious commands coming from motor cortical neurons in a way to execute movements smoothly and without losing balance. It is also this extrapyramidal system that prevents continuous contraction or relaxation,
and these events directly affect voice production20,21.
Thus, voice and speech difference, known as dy-sarthrophonia, represent an important set of signs and symptoms in PD. Traditional methods of
phonotherapeu-tic treatment were not efficient to treat these alterations6.
Currently, LSVT® has been the most used technique, and
the one showing the best results6,21. Some authors have
proposed some alternatives to improve these patients11,12,22,
however, the only statistically proven method is LSVT®
21.
This limited number of alternatives was the major driver for this study, and besides, the method proposed is simple to use and it can be improved in the future to be used in screening patients for treatment, indicating, for instance, those patients with better prognoses.
Discussion of the results
In order to facilitate results discussion, each
para-meter was analyzed separately.
Vocal utterance intensity
Utterance intensity increased in both groups eva-luated and in both genders, matching results found in
the literature9,11,23,24,25. This increase was progressive and
proportional to the increase in masking that is offered, that is, the greater the masking, the greater will be vocal utterance intensity, in agreement with studies previously
published (Figure 1, Figure 2, Figure 3)9,11,12,26-30.
However, the initial average intensity of auditory pre-masking utterance was reduced in the group with Parkinson’s when compared to the Control group (Figure 1), confirming hypophonia as an important characteristic
in these individuals3,5,6,11,12,31.
All the individuals in the Parkinson’s group used levodopa or dopaminergic agonists as a pharmacologic measure. There is no consensus in the literature as to voice improvements with the use of levodopa and dopaminergic agonists. Some papers suggest that pharmacologic treat-ment does not bring about significant improvetreat-ments in
vocal traits31,32. Others suggest that speech improvements
due to medication use occur mainly with the symptoms related with joint and posture, considered dopamine-dependents, and were not very much felt in parameters
such as tremor5,33. There are those that advocate that drug
treatment promotes significant speech improvements34,35.
In our study, although there has been an increase in voice intensity, both in auditory perception and through acous-tic analysis, utterance intensity in the Parkinson’s group was less, suggesting that the “pharmacological treatment” factor, although bringing some voice improvement, is not enough to normalize patterns.
Results suggest that, as it happens with vocal thera-py, the goal in voice intensity increase is reached through LE6,11,12,21,22,36.
Vocal Utterance Intensity Instability
This parameter was indirectly checked by means of a standard deviation pattern within each vocal utterance. It tended towards reduction in both groups, varying pro-portionally in relation to masking intensity. That is, the more intense the masking, the lower is the vocal utteran-ce standard deviation. There was no behavior differenutteran-ce between Parkinson’s and the Control group. It is possible to visually perceive these findings (Figure 4).
Such findings suggest that an increase in vocal ut-terance intensity improves stability in terms of intensity, and this improvement was similar in both groups. This is an important finding in patients with PD, since one of the characteristics of this group is the difficulty in maintaining
vocal utterance stability during speech4,5.
There are no papers in the literature describing the use of this analysis parameter. Thus, the comments hereby Figure 12. Vocal utterance frequency standard deviation (Hz),
made were based on acoustic and perception analysis findings, and on statistical analysis of the data.
Vocal Utterance Frequency
Utterance frequency increased in both groups as-sessed and in both genders. This increase was progressive and proportional to the increase in masking used, that is, the higher the masking, the greater the vocal utterance intensity reflecting in a higher fundamental frequency and
a greater vocal utterance power37. Average utterance
fre-quency was greater in females, which did not confirm the
findings from Holmes et al. (2000)5, who found a reduction
in the fundamental frequency in women and an increase in men. Perception and auditory findings match the results from the acoustic analysis, also in disagreement from the
findings by Holmes et al. (2000)5. A hypothesis that could
explain this disagreement is the fact that patients in this study were in the initial stages of the disease, while those from the study aforementioned belonged to many stages of the disease.
As to the fundamental frequency in these patients, literature is scarce, showing that their major interest is utterance intensity, followed by the alterations that mark the instability. In this sense, it is important to assess vocal utterance frequency in PD patients.
Vocal Utterance Frequency Stability
Just as it happened with vocal utterance intensity stability, this parameter was indirectly assessed by means of the fundamental frequency standard deviation within each vocal utterance. In both groups, this parameter tended to reduce, varying proportionally in relation to masking intensity. That is, the more intense the masking, the lower is vocal utterance frequency standard deviation. However, the behavior difference did not let us test differences be-tween the Control and the Parkinson’s Groups as far as gender is concerned. It is possible to suggest that there is a trend towards vocal utterance frequency stability.
The comments made hereby were based on evalu-ating the Graph (Figure 10) that represent the analysis of the parameter tested, assessing the behavior of both, the Control and the Parkinson’s Groups.
The Graph (Figure 10) shows that the control group curve tends to be flatter, suggesting greater frequency sta-bility in vocal utterance in this group. In the Parkinson’s group, values start high and tend to stabilize after masking with 70dBSL. This stability is important for total voice
improvement in these patients4,5.
Literature has no paper describing the use of such analysis parameter. The comments hereby made were based on the findings of acoustic analyses, perception and auditory analysis, and data statistical analysis.
FINAL REMARKS
If we consider that speech mirrors our personalities, which is unique in its vibrations, tones and musicality, it becomes easier to understand how much these changes interfere in the daily activities of these patients and in their social relations. However, the means specifically created for language improvement in these patients are still limited, currently being restricted to LSVT®. Surgical treatment is still far from us. The “Deep Brain Stimulation”, whose goal is to reduce the activities of the globus pallidus, subtha-lamic nucleus and thalamus, is a great promise for these
patients38. Postoperative results have been very promising
with important voice improvements, showing the way to
a new therapeutic horizon39-42. However, we have to take
into account that this technology is not available to most of these patients, especially in a developing country like Brazil, thus the importance of developing innovative and accessible approaches that help in assessing and treating vocal symptoms in this group. Studies such as those from
Adams, Lang (1992)11, and Angelis et al. (1997)22 and Ho et
al. (1999)12 are highly important because, besides opening
new therapeutic horizons, have fostered new studies in search of a better quality of life for this group.
CONCLUSION
The Lombard effect causes significant increase in vocal utterance fundamental frequency for individuals with Parkinson’s disease. Results also suggest an improvement in vocal utterance stability, both in terms of intensity and fundamental frequency. When we compare the results between the Control and the Parkinson’s Group, both present similar behavior, suggesting that the LE occur in both groups apparently in the same way.
REFERENCES
1. de Mattos JP. Diagnóstico diferencial. Em: Meneses MS, Teive HAG, editores. Doença de Parkinson. Aspectos clínicos e cirúrgicos. 2nd ed. Rio de Janeiro: Guanabara Koogan; 1996.
2. Logemann JA, Fisher HB, Boshes B, Blonsky ER. Frequency and oc-currence of vocal tract dysfunctions in the speech of a large sample of Parkinson patients. J Speech Hear Disord 1978;43(1):47-57. 3. Streifler M, Hofman S. Disorders of verbal expression in parkinsonism.
Adv Neurol 1984;40:385-93.
4. Illes J, Metter EJ, Hanson WR, Iritani S. Language production in Pa-rkinsons disease: acoustic and linguistic considerations. Brain Lang 1988;33(1):146-60.
5. Holmes RJ, Oates JM, Phyland DJ, Hughes AJ. Voice characteristics in the progression of Parkinsons disease. Int J Lang Commun Disord 2000;35(3):407-18.
6. Dias AE, Limongi JCP. Treatment of vocal symptoms in Parkinsons disease: the Lee Silverman method. Arq Neuropsiquiatr 2003;61(1):61-6.
7. Blumin JH, Pcolinsky DE, Atkins JP. Laryngeal findings in advanced Parkinsons disease. Ann Otol Rhinol Laryngol 2004;113(4):253-8. 8. Rosen KM, Kent RD, Duffy JR. Task-based profile of vocal intensity
2005;57(1):28-37.
9. Lombard E. Le signe de lelevation de la voix. Ann maladie oreille larynx nez pharynx 1911;37:101-19.
10. Nonaka S, Takahashi R, Enomoto K, Katada A, Unno T. Lombard reflex during PAG-induced vocalization in decerebrate cats. Neurosci Res 1997;29(4):283-9.
11. Adams SG, Lang A. E. Can the Lombard effect be used to improve low voice intensity in Parkinsons disease? Eur J Disord Commun 1992;27(2):121-7.
12. Ho AK, Bradshaw JL, Iansek R, Alfredson R. Speech volume regulation in Parkinsons disease: effects of implicit cues and explicit instructions. Neuropsychologia 1999;37(13):1453-60.
13. Isshiki N, Okamura H, Tanabe M, Morimoto M. Differential diagnosis of hoarseness. Folia Phoniatr (Basel) 1969;21(1):9-19.
14. Webster DD. Critical analysis of the disability in Parkinson’s disease. Mod Treat 1968;5:257-282.
15. Hoehn MM, Yahr MD. Parkinsonism: onset, progression, and morta-lity. Neurology 1967;17:427-42.
16. Behlau M. Voz. O livro do especialista. São Paulo: Revinter; 2001. p.130-63.
17. Almeida K, Russo ICP, Momensohn-Santos TM. A aplicação do mas-caramento em audiologia. São Paulo: Lovise; 2001. p.21-36. 18. Fernandes AMF. Estudo dos aspectos neurológicos do Controle Motor
Laríngeo [dissertação-mestrado]. São Paulo: Faculdade de Ciências Médicas da Santa Casa de São Paulo; 1999.
19. Gerfen CR. The Neoestriatal Mosaic: Multiple levels of compartmental organization in the basal ganglia. Annu Ver Neurosci 1992;15:285-320.
20. Mink JW. The basal ganglia and involuntary movements, impaired inhibition of competing motor patterns. Arch Neurol 2003;60:1365-8.
21. Ramig LO, Countryman S, OBrien C, Hoehn M, Thompson L. Intensive speech treatment for patients with Parkinsons disease: short-and long-term comparison of two techniques. Neurology 1996;47:1496-504. 22. de Angelis EC, Mourao LF, Ferraz HB, Behlau MS, Pontes PA, Andrade
LA. Effect of voice rehabilitation on oral communication of Parkinsons disease patients. Acta Neurol Scand 1997;96:199-205.
23. Siegel GM, Schork EJ, Pick HL, Garber SR. Parameters of auditory feedback. J Speech Hear Res 1982;25(3):473-5.
24. Amazi DK, Garber SR. The Lombard sign as a function of age and task. Speech Hear Res 1982;25(4):581-5.
25. Zeine L, Brandt JF. The Lombard effect on alaryngeal speech. J Commun Disord 1988; 21(5):373-83.
26. Black JW. The effect of delayed side-tone upon vocal rate and in-tensity. J Speech Disord 1951;16(1):56-60.
27. Black JW. The persistence of the effects of delayed side-tone. J Speech Disord 1955;20(1):65-8.
28. Lane H, Tranel B. The Lombard sign and the role of hearing in speech. J Speech Hear Res 1971;14(1):677-709.
29. Letowski T, Frank T, Caravella J. Acoustical properties of speech produced in noise presented through supra-aural earphones. Ear Hear 1993;14(5):332-8.
30. Winkworth AL, Davis PJ. Speech breathing and the Lombard effect. J Speech Lang Hear Res 1997;40(1):159-69.
31. Gamboa J, Jimenez-Jimenez FJ, Nieto A, Montojo J, Orti-Pareja M, Molina JA,Garcia-Albea E, Cobeta I. Acoustic voice analysis in patients with Parkinsons disease treated with dopaminergic drugs. J Voice 1997;11(3):314-20.
32. Stewart C, Winfield L, Hunt A, Bressman SB, Fahn S, Blitzer A, Brin MF. Speech dysfunction in early Parkinsons disease. Mov Disord 1995;10(5):562-5.
33. Goberman AM. Correlation between acoustic speech characteristics and non-speech motor performance in Parkinson Disease. Med Sci Monit 2005;11(3):CR109-16.
34. Azevedo LL, Cardoso F, Reis C. Acoustic analysis of prosody in fe-males with Parkinsons disease: effect of L-dopa. Arq Neuropsiquiatr 2000;61(4):995-8.
35. Azevedo LL, Cardoso F, Reis C. Acoustic analysis of prosody in females with Parkinsons disease: comparison with normal controls. Arq Neuropsiquiatr 2003;61(4):999-1003.
36. Ramig LO, Verdolini K. Treatment efficacy: voice disorders. J Speech Lang Hear Res 1998;41:S101-116.
37. Hsiao TY, Solomon NP, Luschei ES, Titze IR, Liu K, Fu TC, Hsu MM. Effect of subglottic pressure on fundamental frequency of the canine larynx with active muscle tensions. Ann Otol Rhinol Laryngol 1994;103(10):817-21.
38. Panikar D, Kishore A. Deep brain stimulation for Parkinsons disease. Neurol India 2003 Jun;51(2):167-75.
39. Schulz GM, Peterson T, Sapienza CM, Greer M, Friedman W. Voice and speech characteristics of persons with Parkinsons disease pre- and post pallidotomy surgery: preliminary findings. J Speech Lang Hear Res 1999;42(5):1176-94.
40. Schulz GM, Grant MK. Effects of speech therapy and pharmacologic and surgical treatments on voice and speech in Parkinsons disease: a review of the literature. J Commun Disord 2000;33(1):59-88. 41. Nagulic M, Davidovic J, Nagulic I. Parkinsonian voice acoustic analysis
in real-time after stereotactic thalamotomy. Stereotact Funct Neurosurg 2005;83(2-3):115-21.