1Department of Geology, Universidade Federal do Paraná – UFPR, Curitiba (PR), Brasil. E-mail: [email protected], [email protected]
*Corresponding author.
Manuscript ID: 20160031. Received in: 02/26/2016. Approved in: 10/10/2016. ABSTRACT: Seismic facies analysis and seismic geomorphology are important tools for the analysis of depositional elements in sub-surface. his paper aimed to investigate the character and genesis of depositional elements and erosive features associated with an Eocene progradational shelf margin in northern Santos Basin. Identiied seis-mic facies are interpreted as shelf-margin deltas/shoreface deposits, tangential (oblique) clinoforms, sigmoidal clinoforms, topset relec-tors, mass-transport deposits and turbidites. hese facies are grouped into four associations representing periods of relatively constant en-vironmental conditions. Association 1 is composed of shelf-margin deltas/shoreface deposits, tangential clinoforms and extensive sand--rich turbidites disposed as submarine channels and frontal splays. A progressive increase in clinoform angle within this association has been identiied, culminating in high-relief sigmoidal clinoforms with less voluminous turbidites of facies association 2. Association 3 is composed by subparallel to divergent topset relectors, interpreted as continental to shelfal deposits placed during base-level rises. hese are always truncated basinward by slump scars, formed as a conse-quence of sediment overload at the shelf margin during aggradations. Association 4 is composed of sigmoidal clinoforms, mass-transport deposits and turbidites. Early clinoforms are steeper as a consequence of the topography of the slump scars. Subsequently, dip angles beco-me progressively gentler as the system approach to the equilibrium proile. he steep physiography was favorable for canyon incision, which played an important role in turbidite deposition. Mass-trans-port deposits, formed subsequent to slope collapse, are composed of mud-rich diamictites, and show strong internal deformation. KEYWORDS: Seismic facies; Seismic geomorphology; Deep-marine deposition; Mass-transport deposits; Turbidite systems.
RESUMO: A análise de fácies sísmicas e a geomorfologia sísmica são ferramentas importantes para o estudo de elementos deposicionais em subsuperfície. Neste trabalho foram avaliadas as características e a gênese de elementos deposicionais e de feições erosivas associadas a uma mar-gem progradante desenvolvida no Eoceno no norte da bacia de Santos. As fácies sísmicas identiicadas são interpretadas como deltas de margem de plataforma/depósitos de shoreface, clinoformas tangenciais (oblíquas), clinoformas sigmoides, depósitos de topset, depósitos de transporte em mas-sa e turbiditos. As fácies foram agrupadas em associações que representam períodos com condições ambientais relativamente constantes. A associação 1 é composta de deltas de margem de plataforma/depósitos de shoreface, clinoformas tangenciais e depósitos turbidíticos arenosos, dispostos em ca-nais submarinos e espraiamentos frontais. Um aumento progressivo no ângulo das clinoformas culmina na formação de clinoformas sigmoides com grandes dimensões verticais e turbiditos que compõem a associação 2. A associação 3 é constituída de reletores subparalelos a divergentes, in-terpretados como depósitos continentais a plataformais formados durante subidas do nível de base. Esses reletores são truncados em direção à bacia por cicatrizes de escorregamento formadas em consequência da sobrecarga sedimentar na plataforma durante agradações. A associação 4 consiste em clinoformas sigmoides, depósitos de transporte em massa e turbiditos. As clinoformas mais antigas são mais íngremes, em função da topograia imposta pelas cicatrizes de escorregamento. Os ângulos diminuem pro-gressivamente, enquanto o sistema se aproxima do peril de equilíbrio. Depósitos de transporte em massa, formados após o colapso do talude, são compostos de diamictitos argilosos com intensa deformação interna. PALAVRAS-CHAVE: Fácies sísmicas; Geomorfologia sísmica; Deposição marinha profunda; Depósitos de transporte em massa; Sistemas turbidíticos.
Seismic expression of depositional
elements associated with a strongly
progradational shelf margin: northern
Santos Basin, southeastern Brazil
Expressão sísmica de elementos deposicionais associados
a uma margem de plataforma fortemente progradante: Eoceno
do norte da bacia de Santos, margem sudeste brasileira
Fábio Berton¹*, Fernando Farias Vesely1
INTRODUCTION
he Eocene interval in northern Santos basin, Brazilian ofshore, comprises a complex of high-relief progradational clinoforms (Moreira et al., 2001; Henriksen et al. 2011; Dixon, 2013; Berton & Vesely, 2016) associated with shelf-margin accretion developed under relatively high-sediment supply and low accommodation rates. Because of these characteris-tics, depositional elements from outer shelf to basinal settings are well preserved, including slope clinoforms, submarine channels and lobes, slump scars and mass-transport deposits (e.g., Moreira & Carminatti, 2004). he succession is well imaged by two- and three-dimensional seismic surveys on oil exploration, providing the opportunity of investigating the depositional architecture by applying concepts and meth-ods of seismic facies analysis and seismic geomorphology.
Seismic facies analysis and seismic geomorphology (e.g., Posamentier & Kolla, 2003) are important tools for seis-mic stratigraphy and hydrocarbon exploration, allowing a detailed visualization of internal and external architecture of depositional elements in subsurface, and have been spe-cially applied to infer sedimentary processes operating in deep-marine environments (e.g., Benan & Cauquil, 2000; Prather & Steele, 2000). Despite the indirect character of seismic data and inherent diiculties associated to lim-ited data resolution (see Shanmugam, 2000, for a critical review), reliable genetic interpretations for buried deep-ma-rine deposits have been done based on high-quality seismic data (e.g., Gee et al., 2007; Back et al., 2011; Jiang et al., 2012; Sylvester et al., 2012).
he present paper applied the methodology of seismic facies analysis and seismic geomorphology to the Eocene interval of northern Santos Basin, in order to characterize the depositional architecture of a strongly progradational shelf-margin. Emphasis is on depositional and erosive fea-tures developed in the outer shelf, slope and basin with the objective of determining the spatial and genetic relationships among diferent sediment dispersal systems.
REGIONAL SETTING
he Santos Basin is located in the southeastern Brazilian margin and is limited in the north by the Cabo Frio High and in the south by the Florianópolis High (Fig. 1). Basin evolu-tion is related to the break-up of Gondwana and opening of the South Atlantic Ocean, including an early Cretaceous rift and a late Cretaceous to modern divergent margin (Moreira
et al., 2007). Remarkable was the development of a late Aptian evaporitic phase, during which very thick halite deposits accumulated in a restricted marine environment
(Dias, 2008). Subsequent displacement of salt played an important role creating depocenters and structural highs for post-salt deposition.
After a maximum marine lood in the Turonian, isostatic adjustments on the continental margin resulted in the Serra do Mar uplift. Denudation of this mountain range increased sediment supply to the basin and started an extensive regres-sive phase (Juréia progradation; Macedo, 1989), which per-sisted through the Eocene (Mohriak & Magalhães, 1993) (Fig. 1). Sediment load associated with progradation con-tributed to the ofshore movement of salt and for the gen-eration of important structures in the basin (Sombra et al., 1990; Assine et al., 2008; Badalini et al., 2010).
he Eocene interval, object of the present study, com-prises the uppermost section of the Juréia progradation. In addition to uplifting and denudation, this period was the stage for a dramatic climate warming (Eocene thermal maximum; Lourens et al., 2005) that increased rainfall in the hinterland and contributed to intensify the sediment supply (Zalán & Oliveira, 2005). In northern Santos Basin, the high-sediment input during the Eocene was controlled by the Paraíba do Sul paleodrainage system (Modica & Brush, 2004; Ribeiro, 2007). Due to this combination of climatic and tectonic controls, high-relief slope clinoforms with thin to truncated topsets are the most common dep-ositional geometry of the Eocene. In slope-to-basin areas, expressive muddy and sandy deposits associated with sed-iment gravity lows have formed and can be identiied in diferent stratigraphic levels within the clinoform packages (d’Ávila et al., 2008).
he end of the Eocene records another important climate change, when a global cooling altered the rainfall regime (Sahy
et al., 2015). In addition to that, tectonic adjustments in the Serra do Mar range caused a reorganization of the drain-age system, leading Paraíba do Sul River to migrate north and to start delivering its load to Campos Basin (Karner & Driscoll, 1999). As a result, a dramatic reduction in sedi-mentation rate took place in northern Santos Basin, leading to transgression and reworking by bottom currents (Duarte & Viana, 2007).
DATASET AND METHODS
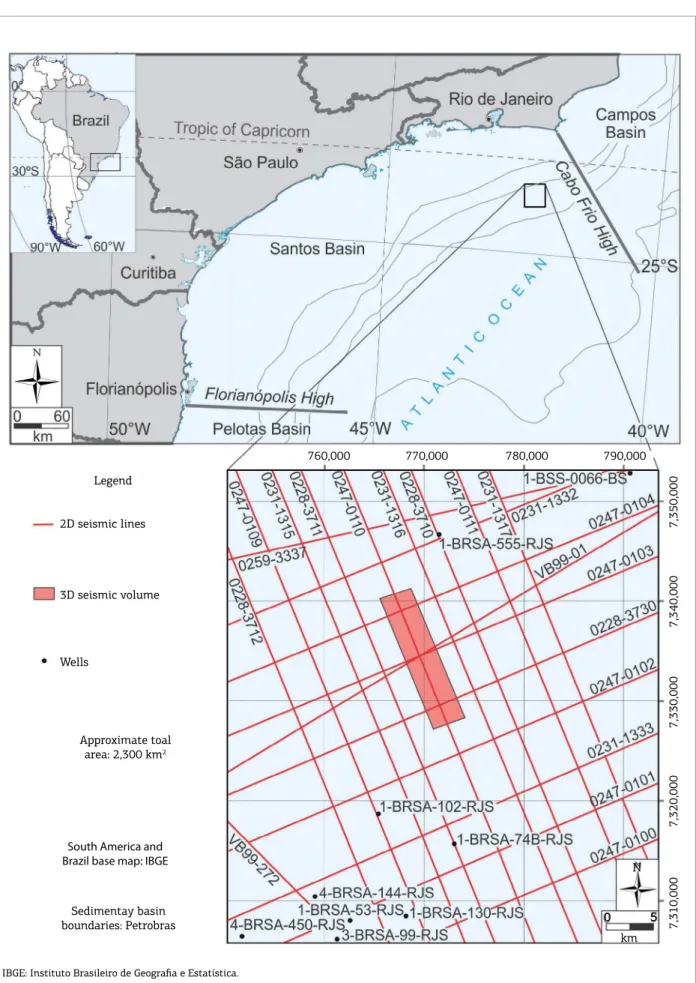
The study area is located in northern Santos Basin, approximately 150 km ofshore from the city of Rio de Janeiro (Fig. 2). Database was provided by the Brazilian National Agency of Petroleum, Natural Gas and Biofuels (BDEP-ANP) and consists of 20 two-dimensional (2D) seismic lines with approximately 2,300 km2 of total
Santos 18A, 0247 Cabo Frio 3A, 0261 VB99 2D BMS, and R0003 0259 2D SPP 2Q 1999, approximately 50 km2
of a three-dimensional (3D) seismic volume (survey 0276 BS500), and composite logs of ten exploratory wells (Fig 2). Seismic facies analysis consists of the visual determina-tion of three-dimensionally-recognizable relecdetermina-tion patterns,
represented by their amplitude-, geometry- and continui-ty-related characteristics, and by general trends of relector terminations (e.g., Mitchum Jr. et al., 1977a, 1977b; Veeken & Van Moerkerken, 2013). According to Posamentier et al.
(2007), seismic geomorphology consists of the interpretation of ancient geomorphic features in the subsurface using 3D
My Geocronology
Period Epoch Age
30
40
50
60
70
80
90
100
110
P
aleogene
Oligocene
Eocene
Paleocene
Chattian
Rupelian Priabonian Bartonian
Lutetian
Ypresian
Thanetian Selandian Danian
Cretaceous
Upper
Lower
Maastrichtian
Campanian
Santonian Coniacian Turonian
Cenomanian
Albian
Santos Basin
NW SE
Eocene
flooding
Jureia Progradation
Turonian
flooding
Eocene int.
Salt domes
Conglomerades Mass-transport deposits Marls Calcilutites
Sandstones Shales and siltstones Calcarenites Volcanics Evaporites
Legend
2D seismic lines
3D seismic volume
Wells
Approximate toal area: 2,300 km2
South America and Brazil base map: IBGE
Sedimentay basin boundaries: Petrobras
760,000 770,000 780,000 790,000
7,350,000
7,340,000
7,330,000
7,320,000
7,310,000
N
0 5
km
IBGE: Instituto Brasileiro de Geograia e Estatística.
seismic data. he interpretation of these geomorphic features, along with the recognition of the environmental setting of the analyzed interval (Hadler-Jacobsen et al., 2007), allows the determination of the paleogeomorphological evolution through time (Prather et al., 2012).
In this study, seismic facies analysis and seismic geomor-phology were complemented by the analysis of shelf-edge trajectories (e.g., Steel & Olsen, 2002; Henriksen et al., 2011) in order to determine base-level luctuations during the deposition of each of the seismic facies recognized.
SEISMIC FACIES
he Eocene interval in the study area ranges in thickness from approximately 460 m in proximal (shelf) and distal (basin) areas, to approximately 1,000 m at the slope-accre-tion prisms. he basal boundary of the interval is a down-lap surface with predominantly low-seismic amplitudes that limits the top of the Paleocene interval (Fig. 3). he upper boundary (Eocene–Oligocene limit) is a truncation surface with predominantly high-seismic amplitudes at the study area (Fig. 3).
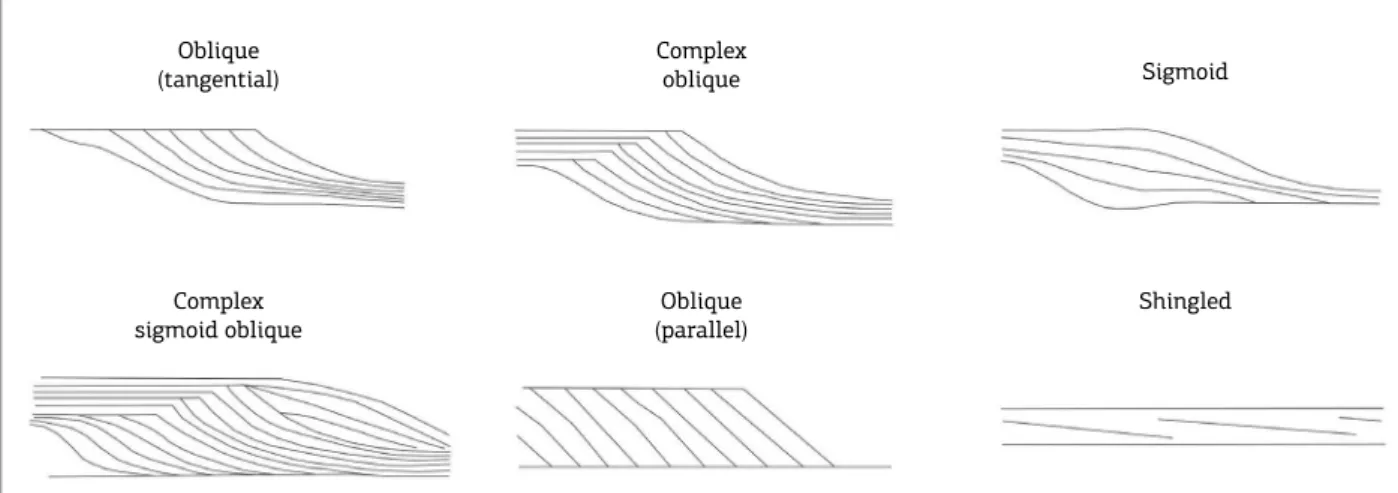
Six main seismic facies were recognized (Fig. 4), includ-ing progradinclud-ing clinoforms, subparallel reflectors in the topset domain, high-amplitude relectors at the bottomset of clinoforms, and mound-shaped chaotic bodies associated with high-angle truncation surfaces. Clinoform classiication took into account their geometry, using an adaptation of the
classiication system of Mitchum Jr. et al. (1977a) and Berg (1982) (Fig. 5). his system considers relection patterns for luvial- and wave-dominated deltas, in geometries such as oblique (tangential), complex oblique, sigmoid, complex oblique sigmoid, oblique (parallel), and shingled. As most clinoforms in the studied area are limited above by truncation surfaces, clinoforms with truncated topsets but recognizable sigmoidal geometries are referred to as “sigmoid clinoforms”, because of the clear geometric diferences when compared to “oblique (tangential) clinoforms” (Fig. 5).
It is important to consider that clinoforms in seismic data are depositional forms with dimensions varying from few hundreds of meters to several kilometers (slope-ac-cretion clinoforms; Steel & Olsen, 2002; Johannessen & Steel, 2005). Slope-accretion clinoforms are composed of topset, foreset and bottomset domains. he topset corre-sponds to the continental to shelfal domain, extending to the shelf margin and encompassing relectors that dip in very low angles towards the basin (Safronova et al., 2014). An inlexion marks the shelf break, when gradients become steeper in slope areas (foreset domain). At the slope toe, a new gradient change marks the decrease in dip angles, in the transition between slope to basin, and beginning of the bottomset domain.
Within these domains, depositional elements and erosive features were interpreted based on morphological character-istics identiied in seismic sections, and on modern exam-ples described in the literature, following the orientations by Stow and Mayall (2000) for sub-surface studies. he term
TWT 0 ms
Estimated vertical scale (in meters)
500 m 400
800 1,200 1,600 2,000 2,400 2,800 3,200 3,600
1,600
2,000
2,400
2,800
3,200
100 m
Estimated vertical scale (in meters)
Legend Eocene– Oligocene Limit
Paleocene– Eocene Limit Cretaceous– Paleocene Limit Seismic line:
0228-3711
TWT: two-way-time.
clinoform set is an informal classiication used here to deine groups of clinoforms with similar geometric characteristics, limited above and below by localized truncation surfaces and their downdip equivalent surfaces (e.g., Sydow et al., 1992). he term mass-transport deposit (MTD) is used in this text as a reference to mud-rich chaotic deep-marine deposits related
to slumps and debris lows (e.g., Weimer, 1989; Omosanya & Alves, 2013; Alves et al., 2014; Deckers, 2015).
Seismic facies A
his facies is composed of small-sized oblique (tangential) and complex sigmoid-oblique clinoforms, with maximum
TWT 2,000 ms
2,200
2,400
2,600
2,800
3,000
3,200
30 km 35 40 45 50 55
Top of Eocene
Base of Eocene
0 ms
100
200
0 ms 100 200 0 ms
100 200 300
0 ms
100 200
300 400 0 ms
100 200 300 0 ms
100
200
1
0 km 2 3 4
1
0 km 2 3 4
1
0 km 2 3 4 0 km 1 2 3
1
0 km 2 3 4
5
1
0 km 2 3 4 5 6
Seismic facies A Legend
Downlap
Seismic facies B and C Onlap
Seismic facies D Seismic facies E Truncation
Seismic facies F Slump scar
A
A
B
B F
F D
D
C
C E
E
Figure 4. Main seismic facies recognized in the Eocene interval in northern Santos Basin. (A) Seismic facies A, interpreted as shelf-margin deltas/shoreface deposits; (B) seismic facies B, interpreted as slope clinoforms with tangential (oblique) geometry; (C) seismic facies C, interpreted as slope clinoforms with sigmoidal geometry; (D) seismic facies D, interpreted as turbidites; (E) seismic facies E, interpreted as mass-transport deposits; (F) seismic facies F, interpreted as continental to shelfal deposits.
TWT: two-way-time.
Shingled Oblique
(tangential)
Complex
oblique Sigmoid
Complex sigmoid oblique
Oblique (parallel)
relief reaching 200 ms two-way-time (TWT) (approximately 250 m) and maximum longitudinal extension of 3 km (Fig. 6). Seismic amplitudes are moderate to high, and in many cases a transition of high acoustic impedance contrasts on tops-ets to low contrasts on forestops-ets, and bottomstops-ets is observed (Fig. 6). Topsets are generally truncated (toplap terminations), with lat to descending trajectories of the clinoform rollover (Fig. 6). Foreset angles vary from 4º to 5º.
his facies is interpreted as shelf-margin deltas (e.g., Porębski & Steel, 2003; Moreira & Carminatti, 2004; Patruno et al., 2015) or shoreface deposits (e.g., Bourget
et al., 2014) formed when sand-rich progradational systems advanced beyond the original shelf edge. In seismic data, both deposits appear as smaller-scale prograding clinoforms, and in well data both show a sand-rich composition. Shelf-edge trajectories, long-term progradation and thin to trun-cated topsets indicate that the progradation was inluenced by high-sediment supply in periods of stationary to falling base level. Acoustic impedance contrast variations indicate a transition from sandy proximal deposits to muddy dis-tal deposits which, in many cases drape onto high-relief oblique clinoforms.
Seismic facies B
his facies is composed of high-relief oblique (tangen-tial) clinoforms with relatively low angles (up to 2º), longi-tudinal extension reaching 15 km, and maximum relief of 800 ms TWT (approximately 1,000 m; Fig. 7A and 7B). A gentle increase in slope dip angles is observed from the oldest to the youngest clinoforms, from approximately 1º up to 2º (Fig. 7A and 7B). Topsets are generally truncated, and trajectory of clinoforms rollover is slightly (when tops-ets are preserved) to strongly descending (when topstops-ets are truncated; Fig. 7B). Seismic amplitudes are generally high in topset areas, but a transition to low amplitudes in
bottomset areas can also be identiied. In some cases, seis-mic amplitude peaks are veriied in the foresets. Frequency of the relections varies from low to moderate.
In many cases, these high-relief clinoforms are contig-uous to the shelf-margin deltas/shoreface deposits (seismic facies A), being interpreted as low-angle tangential (oblique) slope clinoforms (e.g., Porębski & Steel, 2003; Johannessen & Steel, 2005; Patruno et al., 2015). Descending trajec-tories and truncated topsets indicate that their genesis is related to periods of relative sea-level fall. Variations of seismic amplitudes are associated to the transition from proximal sandy deposits to distal muddy deposits, while amplitude peaks in foreset areas suggest the occurrence of intra-slope (shingled) sand-rich turbidites (e.g., Johannessen & Steel, 2005).
Despite the lack of well control and/or 3D seismic data to reinforce the interpretation of such accumulations, sand concentration on slope areas is generally associated to channel and/or canyon illing (e.g., Carvajal & Steel, 2006). he gradual increase in foreset dip with time may be related to a progressive increase on sediment supply, as a consequence of relative sea level fall and erosion in the shel-fal domain (Zecchin & Catuneanu, 2013).
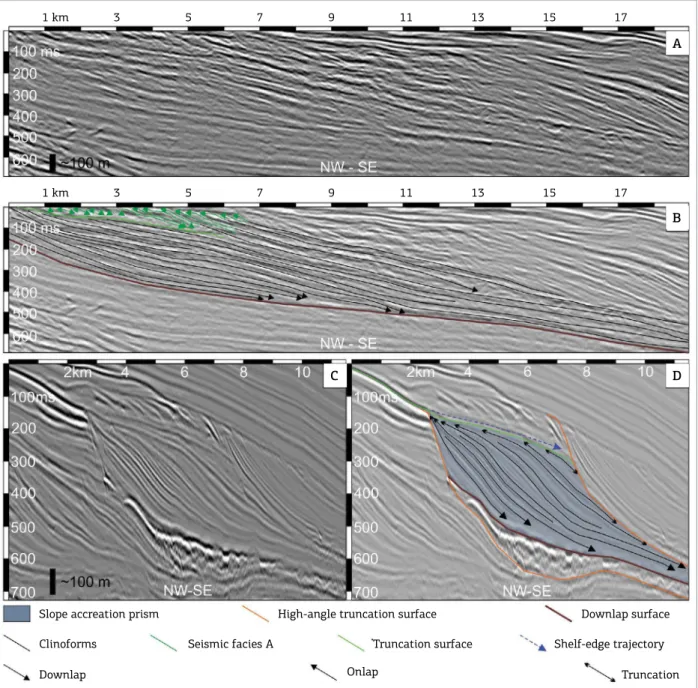
Seismic facies C
his is the most characteristic seismic facies in the study area, and is composed of high-relief (up to 700 ms TWT; approximately 875 m) sigmoidal clinoforms, with maxi-mum longitudinal extension of 15 km (Fig. 7C and 7D). Dip angles slightly decreases from the older to the youngest clinoforms (from 9º to 6º). Seismic amplitudes are high on foreset areas and low to moderate on the bottomsets, and frequency of the relections is moderate to high. In most cases, topsets are truncated, and shelf-edge trajectories are descending (Fig. 7D).
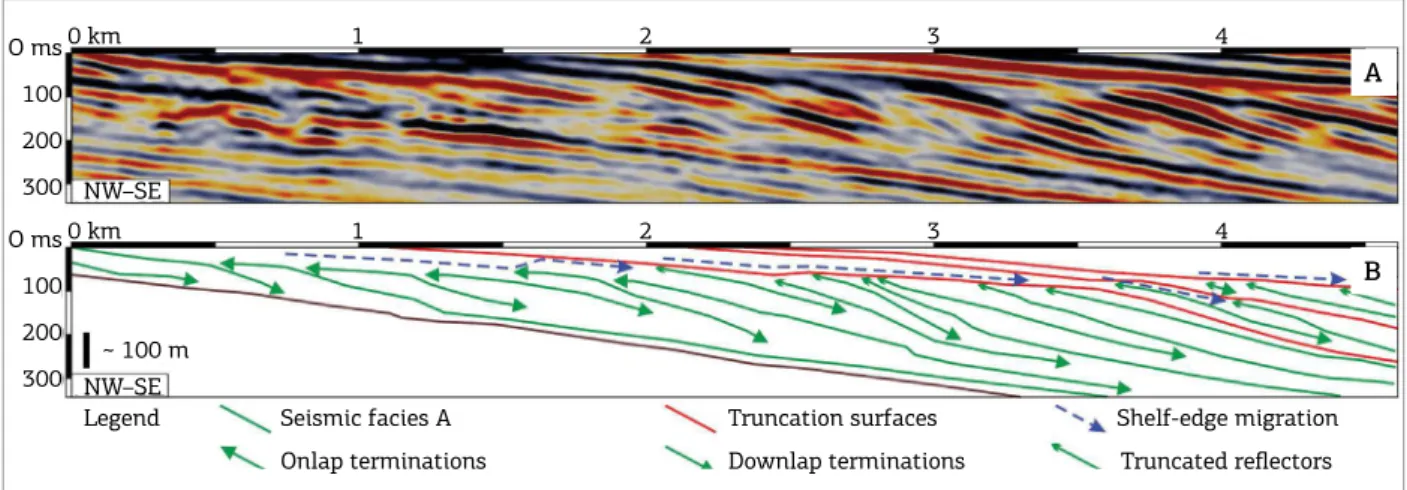
Truncated reflectors O ms
100
200
300
O ms
100
200
300
0 km 1 2 3 4
0 km 1 2 3 4
~ 100 m NW–SE NW–SE
Legend Seismic facies A
Onlap terminations
Truncation surfaces Downlap terminations
Shelf-edge migration A
B
Clinoforms from seismic facies C are interpreted as sigmoidal slope clinoforms (e.g., Porębski & Steel, 2003; Johannessen & Steel, 2005; Patruno et al., 2015), deposited during base-level falls. he external geome-try of the clinoform sets is of high-relief slope-accretion prisms, limited on the top by subaerial unconformities (Fig. 7D). he accretion prisms were formed from steep physiographies, in most cases associated to high-angle truncation surfaces interpreted as large-scale slump scars (Fig. 7D). Variations on clinoform dip angles are inter-preted as a consequence of the progressive approach to
1 km 3 5 7 9 11 13 15 17
1 km 3 5 7 9 11 13 15 17
Slope accreation prism
Clinoforms
Downlap
Seismic facies A
High-angle truncation surface
Truncation surface
Onlap
Downlap surface
Shelf-edge trajectory
Truncation
A
B
D C
Figure 7. Diferent architectural patterns of slope clinoforms with lat to descending trajectories. (A, B) Oblique (tangential) clinoforms from seismic facies B, attached to shelf-margin deltas/shoreface deposits from seismic facies A; (C, D) sigmoidal clinoforms from seismic facies C, with high-angle.
equilibrium proile from an initial steep gradient pro-moted by slope failure.
Seismic facies D
(e.g., Posamentier & Erskine, 1991; Moreira & Carminatti, 2004; Johannessen & Steel, 2005).
In 3D seismic data, it is possible to observe that this facies conigures channels and frontal splays (Fig. 9). Submarine channels width varies from 100 to 150 m, generally with low to moderate sinuosity and, more locally, with high sinuos-ity (Fig. 9A and 9B). Moreira & Carminatti (2004), using a larger 3D seismic volume than the one used in the pres-ent paper, recognized a meandering pattern for submarine channels that compose the turbidite systems. herefore, the mainly straight geometry observed in the study area may be a local characteristic.
In the terminal portions of the submarine channels, asymmetric-fan-shaped frontal splays were identified (Fig. 9). Lateral extension of the frontal splays varies from few hundreds of meters to thousands of meters. Negative acoustic impedance peaks and well information indicate a sandy composition for these deposits (Figs. 8 and 9). Sediment-feeding of these splays seem to be related to submarine canyon incision on slope areas. Canyons reach up to 35 ms TWT deep (approximately 45 m), and have a mainly straight morphology. hese erosive forms acted as preferential points to clastic sediment inlux to the basin
(Stow & Mayall, 2000). Canyon-ill deposits display a diver-gent seismic coniguration according to the classiication by Mitchum et al. (1977a).
Seismic facies E
Seismic facies E has a predominantly chaotic relector pattern, with low to moderate seismic amplitudes and high frequencies. he external form of the deposits, in strike and dip sections, is of mound-shaped bodies at the slope toe, with few to tens of kilometers of longitudinal exten-sion (maximum of 30 km; Fig. 10). he chaotic pattern is interpreted as mass-transport deposits (e.g., Posamentier & Kolla, 2003; Martinez et al., 2005; Alfaro & Holz, 2014).
In well data, the chaotic facies is described as of gravelly mudstones (diamictites) or mudstones with sand interbeds. Internally, this facies is strongly afected by sin-sedimentary deformation, more typically reverse faults pointing to a com-pressive regime (Fig. 10; e.g., Posamentier & Kolla, 2003; Posamentier & Martinsen, 2011). Other compressive struc-tures, such as open folds (Fig. 10), are observed both in 2D seismic lines and in the 3D seismic volume, being compa-rable to examples reported in the literature (e.g., Martinez
et al., 2005; Moscardelli et al., 2006; Alfaro & Holz, 2014).
0 km 0 MS
200
400
600
800
900
1000
0 MS
200
400
600
800
900
1000
2 4 6 8 10 12 14 16 18 20 22 24 26 28
0 km 2 4 6 8 10 12 14 16 18 20 22 24 26 28
Estimated vertical scale (in meters)
Estimated vertical scale (in meters)
100 m 100 m
1-BRSA-74B-RJS
GR DT4P
0.0 150.0 125.0 40.0
1,650 m
1,750
1,850
1,950
2,050 2,150
2,250
2,350
2,450
Eocene
2,550 2,650
2,750 2,850
Cretaceous
2,950
3,050
Seismic facies A (reflectors) Bottomset reflectors
Legend – seismic section Seismic facies A Top of Cretaceous
Seismic facies D Top of Eocene
Legend – well Shale Calcilutite
Sandstone Marl
Conglomerate Volcanics
Figure 8. 2D seismic section and line drawing highlighting sandy turbidites in the bottomsets of slope clinoforms. Note the association between seismic facies D (interpreted as turbidites) and seismic facies A (interpreted as shelf-margin deltas/shoreface deposits, shown as green relectors in the topset domain). The well log to the right shows sand-rich deposits (indicated by a black arrow) associated to the seismic facies interpreted as turbidites. Figure adapted from Berton and Vesely (2016).
Blue: 55 Hz Green: 40 Hz
Red: 30 Hz
N
N E
E
N
N
N N
E
E Splay
500 m
Channel B
5 km
5 km
Blue: 55 Hz Green: 40 Hz
Red: 30 Hz
A B C
D
E
F
0 km 1 2 3 4 5 6
Isopach maps for the two largest MTDs show a max-imum thickness of 135 ms TWT (approximately 170 m) and a longitudinal extension of 30 km for MTD 1 (Fig. 11). hickness variation in MTD 1 is subtle, but larger thicknesses are concentrated in its northwestern portion. his pattern is also observed in the smaller deposit (MTD 2), but in this case the chaotic facies is restricted to the central to northwest-ern part of the deposit and not observed in the SE domain. he third MTD, associated to a smaller slump scar, was not mapped, as it is observed only in few strike sections.
he MTDs are associated to three major slump scars and the generation of these deposits is interpreted as related to the gravitational collapse of the slope (Figs. 10 and 12). Relief of the slump scars vary from 420 to 550 ms (525–690 m, approx-imately), while their longitudinal extension vary from 3.0 to
3.7 km, resulting in a steep topography with angles exceeding 10º. In the upper slope, the scars are truncated by unconfor-mities, and basinward they are contiguous to the basal detach-ment surfaces of the MTDs (Fig. 12). Relectors with more lateral and longitudinal continuity and higher amplitudes are also associated with the chaotic facies (Fig. 10). hese are inter-preted as low-deformed sand-rich slipped blocks, transported as rafts within the mass low (Fig. 10; e.g., Gamboa et al., 2012; Alfaro & Holz, 2014). he rafted blocks are concen-trated in the upper part of the MTDs, but they also occur in the middle part or directly on the basal detachment surfaces.
Seismic facies F
his facies is composed of topset relectors with subpar-allel to divergent pattern, with moderate to high amplitudes
Post-slump forced-regressive phases ms
2,800 2,900 3,000 3,100 3,200
0 ms
100
200
300
400
500
600
700
0 ms
100
200
300
400
500
600
700 ms
2,600 2,700 2,800 2,900
ms 2,600 2,700 2,800 2,900
km 209 210 211 212 213 214 215 216
km
km
0 km 60
5 10 0 km 5 10
NW-SE
61 62 63 km 60 61 62 63
209 210 211 212 213 214 215 216
0247-0102 A
E
B
C
F G
D
SW
NW SE
NE
~ 100 m ~ 100 m ~ 100 m
4-BRSA-144-RJS
Legend: Seismic facies E Blocks (raſts) Reflectors Faults
GR DT4P
0.0 150.0 140.0 40.0 2,200 m
Mid. Eocene
2,250
2,300
2,350
2,400
2,450
Paleocene
Legend – well Shale
Diamictite Calcilutite
Sandstone
Marl
Slump scars
Raſted blocks Seismic facies E Pre-slump forced-regressive phases
Refletors truncaded by slump scars
High-amplitude shelf-margin reflectors (possible source of high-amplitude raſted blocks) Subparallel shelf-margin reflectors
Progradational clinoforms
and high frequency (Fig. 13). Onlap terminations of the relectors migrate toward the continent, while basinward they are truncated by the slump scars (Fig. 13). he max-imum thickness of these topset deposits is about 300 ms TWT (approximately 375 m), recording extensive peri-ods of aggradation on the shelf. hey are probably consti-tuted of non-marine (coastal plain) to outer shelf deposits, formed in periods of positive accommodation in the shelf related to rising base-level and high sedimentation rates (normal regressions).
Seismic facies associations
Seismic facies were grouped in genetic associations (Fig. 14) that relect the environmental conditions during deposition. Association 1 is composed of shelf-margin del-tas/shoreface deposits (seismic facies A), tangential (oblique) slope clinoforms (seismic facies B) and sand-rich turbidites
(seismic facies D). In association 2, only sigmoidal slope clinoforms from seismic facies C and turbidites from seis-mic facies D have been identiied. Association 3 is composed only by seismic facies F, with subparallel to divergent topset relectors. Association 4 is composed of chaotic bodies from seismic facies E, sigmoidal clinoforms from seismic facies C and turbidites from seismic facies D.
he characteristics of the seismic facies that compose the interpreted facies associations allow the assessment of the depositional conditions acting during the deposition of each association. Association 1 represents periods of rel-atively high sediment supply and stationary to falling base level, with the development of long-term progradations and deposition of thick and extensive turbidites. In the younger part of the association shelf-margin deltas/shore-face deposits are rarer than in the older part, and low-an-gle tangential (oblique) slope clinoforms with truncated
0 km 5 10 15 20
0 ms
500
1,000
1,500
2,000
2,500 Estimated verticalscale (in meters) ~ 200 m
Slump scar Slump scar
Seismic facies E – deposit 1
Seismic facies E – deposit 2
NW–SE Isopach map of seismic facies E – deposit 1
N N
-42.20 -42.30 -42.20
-24.18
-24.18
Legend
Legend
Position of shelf margin
aſter slope failure
Position of shelf margin
aſter slope failure Classes – thickness
of chaotic facies (ms)
Classes – thickness of chaotic facies (ms)
0–15 15–30 30–45 45–60 60–75 75–90 90–105 105–120 120–135
0 2.5 5 Geographic coordinate system - datum South America 1969
km
0 2.5 5 km Isopach map of seismic facies E – deposit 2
-42.40 -42.30 -42.20
0–5 5–15 15–25 25–35 35–45 45–55 55–65
A
B B
Exposed shelf
Paleoshore deposits
Outer shelf
Slope
Basin floor
1 km N N
E E
Z
A B
C D
MTD: mass-transport deposit.
Figure 14. Dip-oriented seismic section highlighting genetically associated seismic facies. Each facies association represents a depositional interval when conditions of sediment supply and relative sea-level were relatively constant.
Facies association 1: shelf-margin deltas/shoreface deposits, tangential (oblique) slope clinoforms, turbidites Facies association 2: sigmoidal slope clinoforms, turbidites
Facies association 3: subparallel to divergent topset deposits
Facies association 4: mass-transport deposits, sigmoidal slope clinoforms, turbidities Top of the Eocene
Slump scar
Base of the Eocene
Truncation Slump scar
km 1 2 3 4
km 1 2 3 4 ms
100
200
300
ms
100
200
300
Onlap termination Seismic facies F
Onlap surface
Figure 13. Dip-oriented seismic section showing subparallel to divergent relectors from seismic facies F, on the topset domain and with onlap terminations migrating towards the continent. Basinward, these are truncated by a slump scar.
topsets and turbidites are predominant. his coniguration is coherent to a period of falling sea-level, when shelf-margin deltas/shoreface deposits were eroded. Despite the rela-tive low angle of the slope clinoforms, a gradually steeper slope is built from the older part of the association to the
Association 3 records a period of relative sea-level rise, when aggrading deposits associated to normal regressions were deposited in the shelf. he aggradational phases culmi-nate in the slope gravitational collapse and consequent gen-eration of chaotic deposits interpreted as MTDs. As a conse-quence, these deposits conigure the basal part of association 4, overlapped by high-angle sigmoidal slope clinoforms and sand-rich turbidites. he seismic facies from association 4 are coherent to periods of base-level fall, following periods of base-level rise and deposition of aggradational relectors from association 3. Consequently, slope collapse marks the onset of base-level fall.
DISCUSSION
he studied interval is dominated by prograding clino-forms with few aggradation (Figs. 4, 7 and 14), indicating conditions of forced regressions and relatively high sediment supply (e.g., Zecchin & Catuneanu, 2013). In this context, seismic facies associations with their related depositional ele-ments and erosive features represent tridimensional deposi-tional intervals characterized by speciic paleoenvironmen-tal conditions and associated base-level behavior (Fig. 14). High-sediment supply and forced regressions are favor-able for the development of shelf-margin deltas (Mellere et al., 2002), but in such conditions, prograding shoreface deposits may result in a similar seismic facies. In the studied interval, seismically detectable shelf-margin deltas/shoreface deposits are concentrated in the irst seismic facies association, being sparse in the remaining ones (Figs. 4, 6 and 14). his char-acteristic is possibly a consequence of erosion of these depos-its during extensive periods of exposure of the shelf margin, associated to base-level falls (Mellere et al., 2002). In these periods, the knick-points of canyons developed on slope areas may migrate landward and become connected to shelf-incised luvial systems, preventing the generation of shelf-margin deltas (Kolla & Perlmutter, 1993). Such connection was suggested by Moreira & Carminatti (2004) in their analysis of can-yons developed during the Eocene in northern Santos Basin. Oblique (tangential) slope clinoforms (seismic facies B) and sand-rich turbidites (seismic facies D) occur in associa-tion with the shelf-margin deltas/shoreface deposits (seismic facies A). he increase on dip angles from older to young-est slope clinoforms (Fig. 7B) in association 1 suggyoung-ests an increase in sediment supply and sediment caliper as a result of base level fall and erosion on the shelf (e.g., Zecchin & Catuneanu, 2013; Safronova et al., 2014). While in the irst parts of association 1, lower-angle slope clinoforms (maxi-mum slope angle of approximately 1º) are associated to lat to mildly descending shelf-edge trajectories, steeper clinoforms
in the last stages of the association (maximum slope angle reaching 2º) are related to strongly descending trajectories (Figs. 7 and 14). Consequently, shelf-margin deltas/shore-face deposits are abundant in the older stages of association 1, and rarer in the younger ones which were formed during a more expressive phase of base level fall (Fig. 14). Slope angle increase in this depositional interval is a consequence of extensive forced regressions that caused the migration of the sediment input points to areas closer to the shelf margin and upper slope (Catuneanu, 2006; Catuneanu et al., 2009).
Although sand transport to the deep-sea is favored by forced regressions (e.g., Muto & Steel, 2002; Helland-Hansen & Hampson, 2009), occurrence and volume of turbidites are not exclusively controlled by base-level falls (e.g., Burgess & Hovius, 1998; Plink-Björklund & Steel, 2002; Carvajal & Steel, 2006; Dixon et al., 2012; Safronova et al., 2014; Berton & Vesely, 2016). Turbidites were identiied in all seismic facies associations formed during base-level falls, but they are more frequently observed on the bottomset of clino-forms from association 1, in which well-developed shelf-mar-gin deltas/shoreface deposits occur (Figs. 4 and 8). Based on similar observations, Moreira & Carminatti (2004) divided the Eocene deep-water deposits in north Santos Basin in a sand-rich domain — corresponding to association 1 in the present paper —, and a mud-rich domain, equivalent to asso-ciation 4 (Fig. 14). Sand-rich turbidites are also identiied in facies associations corresponding to the mud-rich domain of Moreira & Carminatti (2004), but MTDs associated with submarine slumps in these associations probably prevented the formation of well-developed submarine fans, by creating an irregular topography over the sea-loor with barriers to the propagation of the turbiditic low (e.g., Machado et al., 2004). Only in more distal parts of the basin, well-developed turbidites with high-amplitude relectors and extensions up to 10 km are observed, subsequent to MTD emplacement.
Recurrence of submarine slumps truncating relectors from associations 2 to 4 and the low thickness of bottomset deposits make hard to correlate these distal submarine fans to a speciic depositional interval or base-level trend. However, considering the relatively high-sediment supply in relation to the mainly falling base-level trend, it seems coherent to ponder that the more distal submarine fans were fed by tur-bidity current during both rising and falling of relative sea level (e.g., Mutti & Normark, 1991; Burgess & Hovius, 1998; Shanmugam, 2002; Dixon et al., 2012; Safronova
et al., 2014; de Gasperi & Catuneanu, 2014) (Fig. 14). herefore, the primary control on turbidite deposition was the sediment supply (e.g., Burgess & Hovius, 1998; Dixon
main feeders for deep-water sands (e.g., Mellere et al., 2002; Johannessen & Steel, 2005; Dixon et al., 2013). he architec-tural pattern of the turbidite systems (channels ending in frontal splays) is well known and well documented in the classic liter-ature on deep-water systems (e.g., Mutti & Normark, 1991; Posamentier & Erskine, 1991; Shanmugam, 2000; Sylvester
et al., 2012; de Gasperi & Catuneanu, 2014). he mainly straight geometry of the submarine channels identiied in the study area (Fig. 9) difers from the meandering pattern identiied by Moreira & Carminatti (2004). However, in the Pleistocene of the Gulf of Mexico, Sylvester et al. (2012) iden-tiied sinuous channels conined (entrenched) within straight features (Fig. 9C and 9D). his was a result of coninement between levees that prevented a larger-scale lateral migration of the channel system. hus, the straight character of channels observed in the present study may imply that intra-channel features are smaller than the seismic resolution.
Slope-accretion clinoforms show important geometric changes, which are a consequence of variations on depositional conditions (e.g., Saller & Dharmasamadhi, 2012; Patruno
et al., 2015; Fig. 7). As discussed before, an increase in the dip angles of oblique (tangential) clinoforms is observed within association 1 (Figs. 7 and 14). his increase culmi-nated in high-relief sigmoid clinoforms with truncated tops-ets in facies association 2 (Fig. 14). Progradation of these clinoforms resulted in the construction of a steep gradient (approximately 6º) that probably inluenced the depositional morphology of the relectors of association 3. his association records an aggradational phase on the shelf following a rela-tive sea-level rise, but the relectors are truncated basinward by a slump scar (Fig. 13). he slump scar created a steep submarine physiography (exceeding 10º) that inluenced the geometry of the subsequent slope-accretion clinoforms (Fig. 12). herefore, a slope-accretion prism composed of high-relief sigmoidal clinoforms (higher than in association 2) is part of association 4 (Fig. 7 B and C).
A decrease in slope angle with time, in association, 4 records a progressive approach to the equilibrium proile, compensating the initial steep slope (e.g., Friedrichs & Wright, 2004). Considering the depositional conditions during the interval, post-slump physiography and main-tenance of high-sediment supply during forced regressions controlled the geometry and high angle of the clinoforms formed just after slope failure (e.g., Zecchin & Catuneanu, 2013; Safronova et al., 2014). hese conditions are repeated during the interval, with new aggradation phases and for-mation of parallel to divergent relectors from association 3 preceding slumps and deposition of association 4 (Fig. 14). Sigmoidal slope clinoforms from association 4 show a gradual decrease of foreset angles, in some cases from approximately 9º to 6º. he steep submarine bathymetry resultant from
slope failure controlled the geometry and angles of these clinoforms, and favored the incision of straight canyons (e.g., Clausen et al., 2012) (Fig. 12). hese features represent preferential conduits for sediment transfer to deeper waters, and their development afected the deposition of turbidites. he successive occurrence of submarine slumps during the interval also caused the deposition of large MTDs at the slope toe. All slumps occurred immediately after an aggra-dational phase composed of topset relectors, which are the most probable source of sediments for the MTDs. Despite the relative scarcity of normal-regressive, and aggradational strata in the succession, their deposition was important for MTD generation in accumulating sediment at the shelf mar-gin. In the case of the larger MTD, the volume of displaced shelf deposits was suiciently large to originate a deposit with up to 30 km of lateral extent and an average thickness of about 70 ms TWT (approximately 88 m; Figs. 4 and 14). he smaller-sized MTDs are also proportional to the thick-ness of the precursor topset deposits (association 3), which are signiicantly thinner than those of the irst stage of asso-ciation 3 (Fig. 14). he emplacement of MTDs over sand-rich turbidites has relevance for oil exploration, as potential reservoirs (turbidites) are capped by potential seals (muddy MTDs). he sandy turbidites of the Eocene were previously recognized as good reservoirs (Moreira & Carminatti, 2004; Chang et al., 2008), and oil shows associated to these deposits were detected in some wells. However, Moreira & Carminatti (2004) do not consider the MTDs as good seals due to the presence of compressive structures such as thrust faults that reduce sealing capacity (e.g., Bull et al., 2009; Posamentier & Martinsen, 2011; Alves et al., 2014; Fig. 10). herefore, 3D mapping of these deformational structures, combined with petrophysical data of the diamictites, may help in the determination of the quality of these deposits as top seals.
CONCLUSIONS
Seismic facies analysis combined with seismic geomor-phology and analysis of shelf-edge trajectories allowed a better understanding of the environmental conditions that operated during the evolution of the Eocene shelf-margin in northern Santos Basin:
■ the geometry of strongly prograding clinoforms with thin to truncated topsets and lat to descending shelf-edge trajecto-ries is the most common in the interval, indicating condi-tions of relatively high sediment supply and base level falls;
■ moments of base-level rise and maintenance of high sediment supply caused sediment storage at the outer shelf, which was essential to subsequent slope failure;
■ mud-rich MTDs with chaotic internal pattern and deformation by compressive structures are associated to slump scars;
■ the geometry of high-relief clinoforms was conditioned by relatively high sediment supply and steep physiog-raphies associated to slumps. A progressive decrease on slope gradient during progradation records approach to the submarine equilibrium proile;
■ shelf-margin deltas/shoreface deposits (equivalent to seis-mic facies A) were eicient for the transport of sand to the deep-marine environment, as the largest volumes of sand-rich turbidites (equivalent to seismic facies D) are associated to the occurrence of seismic facies A;
■ turbidite systems included channels and frontal splays. In many cases, these features are amalgamated;
■ the steep physiography associated to slump scars was favor-able for canyon incisions. hese canyons were important for sediment-feeding of deep-marine turbiditic splays;
■ turbidites have a good potential as reservoir rocks, but the compressive structures in the MTDs decrease their potential as sealing rocks.
ACKNOWLEDGEMENTS
The authors thank Universidade Federal do Paraná (UFPR) and Laboratório de Análise de Bacias (LABAP) for infrastructure and institutional support. We thank the three anonymous reviewers for constructive comments that improved the quality of the manuscript. We also thank Mario Luis Assine and Rodolfo José Angulo for their suggestions and comments in an early version of the text. Fábio Berton acknowledges the scholarship provided by the Programa Interdisciplinar em Engenharia de Petróleo e Gás Natural of UFPR (PRH-24). Fernando F. Vesely thanks the Conselho Nacional de Desenvolvimento Cientíico e Tecnológico (CNPq) for inancial support (grants: 461628/2014-7). Seismic and well data were provided by the Agência Nacional do Petróleo, Gás Natural e Biocombustíveis (BDEP-ANP).
Alfaro E. & Holz M. 2014. Seismic geomorphological analysis of deepwater gravity-driven deposits on a slope system of the southern Colombian Caribbean margin. Marine and Petroleum Geology,
57:294-311. doi: 10.1016/j.marpetgeo.2014.06.002
Alves T.M., Kurtev K., Moore G.F., Strasser M. 2014. Assessing the internal character, reservoir potential, and seal competence of mass-transport deposits using seismic texture: a geophysical and petrophysical approach. AAPG Bulletin, 98(4):793-824. doi: 10.1306/09121313117 Assine M.L., Corrêa F.S., Chang H.K. 2008. Migração de depocentros na bacia de Santos: importância na exploração de hidrocarbonetos. Revista Brasileira de Geociências, 38(2):111-127.
Back S, Van Gent H., Reuning L., Grötsch J., Niederau J., Kukla P. 2011. 3D seismic geomorphology and sedimentology of the Chalk Group, southern Danish North Sea. Journal of the Geological Society,
168:393-405. doi: 10.1144/0016-76492010-047
Badalini G., Browner F., Bourque R., Blight R., de Bruin G. 2010. Seismic-sequence stratigraphic analysis of regional 2D lines in the
Santos Basin, ofshore Brazil. Search and Discovery Article, 40538. Benan A.O.A.C. & Cauquil, E. 2000. Seabed morphologies and recent turbidite architectural elements as interpreted from 3D seismic data – some implications for exploration and production of the deep
ofshore. In: Appi, C.J. (Ed.). Deep-water sedimentation: technological challenges for the next millennium: 31st International Geological Congress. Rio de Janeiro, ABGP, p. 111-112.
Berg O.R. 1982. Seismic detection and evaluation of delta and turbidite sequences; their application to exploration for the subtle trap. AAPG Bulletin, 66(9):1271-1288.
Berton F. & Vesely F.F. 2016. Stratigraphic evolution of Eocene clinoforms
from northern Santos Basin, ofshore Brazil: evaluating controlling factors
on shelf-margin growth and deep water sedimentation. Marine and Petroleum Geology, 78:356-372. doi: 10.1016/j.marpetgeo.2016.09.007
REFERENCES
Bourget J., Ainsworth R.B., Thompson S. 2014. Seismic stratigraphy and geomorphology of tide or wave dominated shelf-edge delta
(NW Australia): process-based classiication from 3D seismic
attributes and implications for the prediction of deep-water sands. Marine and Petroleum Geology, 57:359-384. doi: 10.1016/j. marpetgeo.2014.0 5.021
Bull S., Cartwright J., Huuse M. 2009. A review of kinematic indicators from mass-transport complexes using 3D seismic data. Marine and Petroleum Geology, 26(7):1132-1151.
Burgess P.M. & Hovius N. 1998. Rates of delta progradation during highstands: consequences for timing of deposition in deep-marine systems. Journal of the Geological Society, 155(2):217-222. doi: 10.1144/gsjgs.155.2.0217
Carvajal C.R. & Steel R.J. 2006. Thick turbidite successions from supply-dominated shelves during sea-level highstand. Geology,
34(8):665-668.doi: 10.1130/G22505.1
Catuneanu O. 2006. Principles of sequence stratigraphy. Amsterdam, Elsevier, 375p.
Catuneanu O., Abreu V., Bhattacharya J.P., Blum M.D., Dalrymple R.W., Eriksson P.G., Fielding C.R., Fisher W.L., Galloway W.E., Gibling M.R., Giles K.A., Holbrook J.M., Jordan R., Kendall C.G.St.C., Macurda B., Martinsen O.J., Miall A.D., Neal J.E., Nummedal D., Pomar L., Posamentier H.W., Pratt B.R., Sarg J.F., Shanley K.W., Steel R.J., Strasser A., Tucker M.E., Winker C. 2009. Towards the standardization of sequence stratigraphy. Earth-Science Reviews, 92:1-33.
Chang H.K., Assine M.L., Corrêa F.S., Tinen J.S., Vidal A.C., Koike L. 2008. Sistemas petrolíferos e modelos de acumulação de hidrocarbonetos na bacia de Santos. Revista Brasileira de Geociências, 38(2):29-46.
Clausen O.R., Śliwińska K.K., Gołędowski B. 2012. Oligocene climate
D’Ávila R.S.F., Arienti L.M., Aragão M.A.N.F., Vesely F.F., Santos S.F., Voelcker H.E., Viana A.R., Kowsmann R.O., Moreira J.L.P., Coura A.P.P., Paim P.S.G., Matos R.S., Machado L.C.R. 2008. Ambientes de águas profundas. In: Silva A.J.C.L.P., Aragão M.A.N.F., Magalhães A.J.C. (Orgs.). Ambientes de sedimentação siliciclástica do Brasil. São Paulo, Beca, p. 244-300.
de Gasperi A. & Catuneanu O. 2014. Sequence stratigraphy
of the Eocene turbidite reservoirs in Albacora ield, Campos Basin, ofshore Brazil. AAPG Bulletin, 98(2):279-313. doi: 10.1306/07031312117
Deckers J. 2015. Middle Miocene mass transport deposits in the southern part of the Roer Valley Graben. Marine and Petroleum Geology, 66(4):653-659.
Dias J.L. 2008. Estratigraia e sedimentação dos evaporitos
neo-aptianos na margem leste brasileira. In: Mohriak W.U., Szatman P., Anjos S.M.C. (Orgs.). Sal – geologia e tectônica. São Paulo, Beca, p. 220-229.
Dixon J.F. 2013. Shelf-edge deltas: stratigraphic complexity and relationship to deep-water deposition. PhD Thesis, University of Texas, 217 p.
Dixon J.F., Steel R.J., Olariu C. 2012. Shelf-edge delta regime as a predictor of deep-water deposition. Journal of Sedimentary Research,
82(9):681-687. doi: 10.2110/jsr.2012.59
Dixon J.F., Steel R.J., Olariu C. 2013. A model for cutting and healing of deltaic mouth bars at the shelf edge: mechanism for basin-margin accretion. Journal of Sedimentary Research, 83(3):284-299. doi: 10.2110/jsr.2013.25
Duarte C.S.L. & Viana A.R. 2007. Santos Drit system: stratigraphic
organization and implications for late Cenozoic palaeocirculation in the Santos Basin, SW Atlantic Ocean. In: Viana A.R. & Rebesco M. (Eds.). Economic and Palaeoceanographic Signiicance of Contourite
Deposits, 276:171-198.
Friedrichs C.T. & Wright L.D. 2004. Gravity-driven sediment transport
on the continental shelf: implications for equilibrium proiles near
river mouths. Coastal Engineering, 51(8-9):795-811.
Gamboa D., Alves T.M., Cartwright J.A. 2012. Seismic-scale rated
and remnant blocks over salt ridges in the Espírito Santo Basin, Brazil. In: Yamada Y., Kawamura K., Ikehara K., Ogawa Y., Urgeles R., Mosher D., Chaytor J., Strasser M. (Eds.). Submarine mass movements and their consequences. Berlin, Springer, p. 629-638. doi: 10.1007/978-94-007-2162-3_56
Garcia S.F.M., Letouzey J., Rudkiewicz J.-L., Danderfer Filho A., de Lamotte D.F. 2012. Structural modeling based on sequential restoration of gravitational salt deformation in the Santos Basin. Marine and Petroleum Geology, 35(1):337-353.
Gee M.J.R., Gawthorpe R.L., Bakke K., Friedmann S.J. 2007. Seismic geomorphology and evolution of submarine channels from the Angolan continental margin. Journal of Sedimentary Research,
77(5-6):433-446. doi: 10.2110/jsr.2007.042
Hadler-Jacobsen F., Gardner M.H., Borer J.M. 2007. Seismic stratigraphic and geomorphic analysis of deep-marine deposition along the West African continental margin. In: Davies R.J., Posamentier H.W., Wood L.J., Cartwright J.A. (Eds.). Seismic geomorphology: applications to hydrocarbon exploration and production. Geological Society Special Publication, 277:47-84. Helland-Hansen W. & Hampson G.J. 2009. Trajectory analysis: concepts and applications. Basin Research, 21(5):454-483.
Henriksen S., Helland-Hansen W., Bullimore S. 2010. Relationships between shelf-edge trajectories and sediment
dispersal along depositional dip and strike: a diferent approach
to sequence stratigraphy. Basin Research, 23(1):3-21. doi: 10.1111/j.1365-2117.2010.00463.x
Jiang S., Weimer P., Henriksen S., Hammon III W.S. 2012. 3D seismic stratigraphy and evolution of Upper Pleistocene deepwater depositional systems, Alaminos Canyon, northwestern deep Gulf of Mexico. In: Prather B.E., Deptuck M.E., Mohrig D., Van Hoorn B., Wynn R.B. Application of the principles seismic geomorphology to continental-slope and base-of-slope systems: case studies from
sealoor and near-sealoor analogues. Society for Sedimentary Geology (SEPM) Special Publication, 99:309-327. doi: 10.2110/ pec.12.99.0309
Johannessen E.P. & Steel R.J. 2005. Shelf-margin clinoforms and prediction of deepwater sands. Basin Research, 17(4):521-550. Karner G.D. & Driscoll N.W. 1999. Tectonic and stratigraphic development of the West African and Eastern Brazilian margins: insights from quantitative basin modeling. In: Cameron N.R., Bate R.H., Clure V.S. (Eds.). The oil and gas habitats of the South Atlantic. Geological Society, 153:11-40. doi: 10.1144/GSL.SP.1999.153.01.02 Kolla V. & Perlmutter M.A. 1993. Timing of turbidite sedimentation on the Mississippi Fan. AAPG Bulletin, 77(7):1129-1141.
Lourens L.J., Sluijs A., Kroon D., Zachos J.C., Thomas E., Röhl U.,
Bowles J., Rai I. 2005. Astronomical pacing of late Palaeocene to
early Eocene global warming events. Nature, 435(7045):1083-1087. Macedo J.M. 1989. Evolução tectônica da bacia de Santos e áreas continentais adjacentes. Boletim de Geociências da Petrobras,
3:159-173.
Machado L.C.R., Kowsmann R.O., Almeida Jr. W., Murakami C.Y., Schreiner S., Miller D.J., Piauilino P.O.V. 2004. Geometria da porção proximal do sistema deposicional turbidítico moderno da Formação Carapebus, bacia de Campos; modelo para heterogeneidades de reservatório. Boletim de Geociências da Petrobras, 12(2):287-315. Martinez J.F., Cartwright J., Hall B. 2005. 3D seismic interpretation of slump complexes: examples from the continental margin of Israel. Basin Research, 17:83-108. doi: 10.1111/j.1365-2117.2005.00255.x.
Mellere D., Plink-Björklund P., Steel R.J. 2002. Anatomy of shelf deltas at the edge of a prograding Eocene shelf margin, Spitsbergen. Sedimentology, 49(6):1181-1206. doi: 10.1046/j.1365-3091.2002.00484.x.
Mitchum R.M., Vail P.R., Sangree J.B. 1977a. Seismic stratigraphy and global changes in sea level, part 6: stratigraphic interpretation of
seismic relection patterns in depositional sequences. In: Payton C.E. (ed.). Seismic stratigraphy: application to hydrocarbon exploration,
26:117-133.
Mitchum R.M., Vail P.R., Thompson S. 1977b. Seismic stratigraphy and global changes in sea level, part 2: the depositional sequence as a basic unit for stratigraphic analysis. In: Payton C.E. (Ed.). Seismic stratigraphy: application to hydrocarbon exploration, 26:53-62.
Modica C.J. & Brush E.R. 2004. Postrit sequence stratigraphy, paleogeography, and ill history of the deep-water Santos Basin, ofshore southeast Brazil. AAPG Bulletin, 88(7):923-945.
Mohriak W.U. & Magalhães J.M. 1993. Estratigraia e evolução
estrutural da área norte da bacia de Santos. In: III Simpósio de Geologia do Sudeste, Atas, v. 1,p. 19-26.
Moreira J.L.P. & Carminatti M. 2004. Sistemas deposicionais de talude e bacia no Eoceno da bacia de Santos. Boletim de Geociências da Petrobras, 12(1):73-87.
Moreira J.L.P., Madeira C.V., Gil J.A., Machado M.A.P. 2007. Bacia de Santos. Boletim de Geociências da Petrobras, 15(2):531-549. Moreira J.L.P., Nalpas T., Joseph P., Guillocheau F. 2001. Stratigraphie sismique de la marge Eocène du Nord du Bassin de Santos (Brésil): relations plateforme/systèmes turbiditiques; distortion des séquences de dépôt. Comptes Rendus de l’Académie des
Moscardelli L., Wood L., Mann P. 2006. Mass-transport complexes and
associated processes in the ofshore area of Trinidad and Venezuela.
AAPG Bulletin, 90(7):1059-1088. doi: 10.1306/02210605052 Muto T. & Steel R.J. 2002. In defense of shelf-edge delta development during falling and lowstand of relative sea level. The Journal of Geology, 110(4):421-436. doi: 10.1086/340631.
Mutti E. & Normark W.R. 1991. An integrated approach to the study of turbidite systems. In: Weimer P. & Link M.H. (Eds.). Seismic facies and sedimentary processes of submarine fans and turbidite systems. London, Springer, p. 75-106.
Omosanya K.O. & Alves T.M. 2013. A 3-dimensional seismic method to assess the provenance of mass-transport deposits (MTDs) on salt-rich continental slopes (Espírito Santo Basin, SE Brazil). Marine and Petroleum Geology, 44:223-239.
Patruno S., Hampson G.J., Jackson, C.A.-L. 2015. Quantitative characterisation of deltaic and subaqueous clinoforms. Earth-Science Reviews, 142:79-119.
Plink-Björklund P. & Steel R.J. 2002. Sea-level fall below the
shelf edge, without basin-loor fans. Geology, 30(2):115-118. doi: 10.1130/0091-7613.
Porębski S.J. & Steel R.J. 2003. Shelf-margin deltas: their stratigraphic signiicance and relation to deepwater sands. Earth-Science Reviews,
62:283-326.
Posamentier H.W. & Erskine R.D. 1991. Seismic expression and recognition criteria of ancient submarine fans. In: Weimer P., Link M.H. (Eds.). Seismic facies and sedimentary processes of modern and ancient submarine fans and turbidite systems. Springer, 197-222.
Posamentier H.W. & Kolla V. 2003. Seismic geomorphology and stratigraphy of depositional elements in deep-water settings. Journal of Sedimentary Research, 73(3):367-388. doi: 10.1306/111302730367.
Posamentier H.W., Martinsen O.J. 2011. The character and genesis of submarine mass-transport deposits: insights from outcrop and 3D seismic data. In: Shipp R.C., Weimer P., Posamentier H.W. (Eds.). SEPM Special Publication, 96:7-38.
Posamentier H.W., Davies R.J., Cartwright J.A., Wood L.J. 2007. Seismic geomorphology – an overview. In: Davies R.J., Posamentier H.W., Wood L.J., Cartwright J.A. (Eds.). Seismic geomorphology: applications to hydrocarbon exploration and production, Special Publication, p. 1-14.
Prather B.E. & Steele D.R. 2000. Methodologies for uncertainty assessment of deep-water facies and basins. In: Appi C.J. (Ed.). Deep-water sedimentation: technological challenges for the next millennium – 31st International Geological Congress. Rio de Janeiro, ABGP, p. 85-92.
Prather B.E., Deptuck M.E., Mohrig D., van Hoom B., Wynn R.B. 2012. Application of the principles of seismic geomorphology to continental-slope and base-of-slope systems: case studies from
sealoor and near-sealoor analogues. In: Prather B.E., Deptuck M.E., Mohrig D., Van Hoorn B., Wynn R.B. Application of the principles seismic geomorphology to continental slope and base-of-slope systems: case studies from sealoor and near-sealoor analogues,
Special Publication, 99:5-9. doi: 10.2110 /pec.12.99.0005.
Ribeiro M.C.S. 2007. Termocronologia e história denudacional da Serra do Mar e implicações no controle deposicional da bacia de Santos. PhD Thesis, Instituto de Geociências e Ciências Exatas, Universidade Estadual Paulista, Rio Claro, 227 p.
Safronova P.A., Henriksen S., Andreassen K., Laberg J.S., Vorren T.O. 2014. Evolution of shelf-margin clinoforms and deep-water fans during the middle Eocene in the Sørvestsnaget Basin, southwest Barents Sea. AAPG Bulletin, 98(3):515-544.
Sahy D., Condon D.J., Terry Jr. D.O., Fischer A.U., Kuiper K.F. 2015. Synchronizing terrestrial and marine records of environmental change across the Eocene-Oligocene transition. Earth and Planetary Science Letters, 427:171-182. doi: 10.1016/j.epsl.2015.06.057.
Saller A. & Dharmasamadhi I.N.W. 2012. Controls on the
development of valleys, canyons, and unconined channel-levee
complexes on the Pleistocene slope of East Kalimantan, Indonesia. Marine and Petroleum Geology, 29:15-34.
Shanmugam G. 2000. 50 years of the turbidite paradigm (1950s – 1990s): deep-water processes and facies models – a critical perspective. Marine and Petroleum Geology, 17(2):285-342.
Shanmugam G. 2002. Ten turbidite myths. Earth-Science Reviews,
58:311-341.
Sombra C.L., Arienti L.M., Pereira M.J., Macedo J.M. 1990. Parâmetros controladores da porosidade e da permeabilidade nos reservatórios clásticos profundos do Campo de Merluza, bacia de Santos, Brasil. Boletim de Geociências da Petrobras, 4(4):451-466.
Steel R.J. & Olsen T. 2002. Clinoforms, clinoform trajectories and deepwater sands. In: Armentrout J.M. & Rosen N.C. (Eds.). Sequence stratigraphic models for exploration and production: evolving models and application histories, GCS-SEPM Special Publication, 22:367-381.
Stow D.A.V. & Mayall M. 2000. Deep-water sedimentary systems: new models for the 21st century. Marine and Petroleum Geology,
17(2):125-135. doi:10.1016/S0264-8172(99)00064-1.
Sydow J., Roberts H.H., Bouma A.H., Winn, R. 1992. Constructional subcomponents of shelf-edge delta, northeast Gulf of Mexico.
Gulf Coast Association of the Geological Societies Transactions,
42:717-726.
Sylvester Z., Deptuck, M.E., Prather B.E., Pirmez C., O’Byrne C. 2012. Seismic stratigraphy of a shelf-edge delta and linked submarine channels in the northeastern Gulf of Mexico. In: Prather B.E., Deptuck M.E., Mohrig D., van Hoorn B., Wynn R.B.Application of the principles seismic geomorphology to continental slope and base-of-slope systems: case studies from sealoor and near-sealoor analogues. Society for Sedimentary Geology (SEPM) Special Publication, 99 :31-59. doi: 10.2110/pec.12.99.0031.
Veeken P.C.H. & Van Moerkerken B. 2013. Seismic stratigraphy and depositional facies models. Houten, EAGE, 496 p.
Weimer P. 1989. Sequence stratigraphy of the Mississippi Fan (Plio-Pleistocene), Gulf of Mexico. Geo-Marine Letters, 9:185-272. Williams B.G. & Hubbard R.J. 1984. Seismic stratigraphic framework and depositional sequences in the Santos Basin. Marine and Petroleum Geology, 1:90-104.
Zalán P.V. & Oliveira J.A.B. 2005. Origem e evolução estrutural
do sistema de rites cenozóicos do Sudeste do Brasil. Boletim de Geociências da Petrobras, 13(2):269-300.
Zecchin M. & Catuneanu O. 2013. High-resolution sequence stratigraphy of clastic shelves I: units and bounding surfaces. Marine and Petroleum Geology, 39:1-25.