J. of the Braz. Soc. of Mech. Sci. & Eng. Copyright © 2008 by ABCM July-September 2008, Vol. XXX, No. 3 / 253
Cyro Albuquerque Neto
Jurandir Itizo Yanagihara
Senior Member, ABCM [email protected]
Fábio Turri
[email protected] University of Sao Paulo - USP Escola Politécnica Department of Mechanical Engineering 055809-900 São Paulo, SP, Brazil
A Carbon Monoxide Transport Model
of the Human Respiratory System
Applied to Urban Atmosphere
Exposure Analysis
The aim of this work is to analyze the carbon monoxide (CO) transport in the human body submitted to several physical activity levels. A complete mathematical model of the human respiratory system was developed, considering the exchanges of CO, oxygen (O2) and carbon dioxide (CO2) in the lung, blood and tissues. The human body was divided in the following compartments: alveolar, pulmonary capillaries, arterial, venous, tissue capillary and tissues. The gas transport in the blood and tissues is represented by empirical equations. The physiological parameters were described in function of physical activity. The model was validated by comparing its results with experimental data of controlled CO exposition. The agreement was excellent. CO concentration curves for critical days of São Caetano do Sul city (SP, Brazil) atmosphere were used as model input. The simulation results for some physical activities show that the more intense the activity, the larger the blood carboxyhemoglobin (COHb) level variations. The COHb level was compared with a CO quality air criteria, which showed to be adequate for low and moderate physical activity levels.
Keywords: compartment model, carbon monoxide, gas transport, respiratory system, air pollution
Introduction
1
The carbon monoxide (CO) is a colorless, odorless and insipid gas. It has been the main cause of accidental deaths from poisoning. It is responsible for the largest amount of pollutant launched in the atmosphere, produced by man and nature. The main source is the fossil fuel burning (coal, oil and natural gas), mostly produced by motorized vehicles. The human body produces CO at low levels.
The function of the human respiratory system is to provide oxygen (O2) to the tissues and to eliminate the carbon dioxide (CO2)
produced by them. Most of the O2 transported by the blood is
through its reaction with hemoglobin molecules. The transport of CO happens in the same way, but its affinity with hemoglobin is about 250 times higher than O2. The presence of CO in the blood
reduces its capacity to carry O2. Therefore, large CO concentrations
produce the lack of O2 in the tissues. The bond between CO and
hemoglobin is called carboxyhemoglobin (COHb), represented by the amount (%) of hemoglobin reacted with CO. It is used to relate the CO effects in the human body (Tab. 1). It is measured by blood analysis or exhaled air. In the absence of measurement methods, the COHb can be estimated through mathematical models.
Most mathematical models are empirical (Forbes, Sargent and Roughton, 1945; Pace et al., 1946; Lilienthal and Pine, 1946). The output of an empirical model has consistency only for the conditions in which the experiment was carried out. More elaborated empirical models were proposed by Peterson and Stewart (1970) and Stewart et al. (1973) for a large range of CO concentrations. The empirical models of Goldsmith, Terzaghi and Hackney (1963), Ott and Mage (1978) and Venkatram and Lough (1979) take into account CO fluctuations in urban atmospheres.
Recently, models describing the physiological processes related to CO transport in the human body have presented satisfactory results. Among them the CFK model (Coburn, Forster and Kane, 1965) has been extensively used. There are several applications and validations of that model. Marcus (1980) and Collier and Goldsmith (1983) applied it in urban atmospheres.
Paper accepted April, 2008. Technical Editor: Agenor de Toledo Fleury.
The models of Selvakumar, Sharan and Singh (1992) and Sharan and Selvakumar (1999) divide the lung into compartments, one alveolar and several pulmonary capillaries. They consider, besides CO, the exchanges of the gases O2, CO2 and nitrogen (N2).
Selvakumar, Sharan and Singh (1992) applied their model to high altitudes and Sharan and Selvakumar (1999) to the end-expired breath technique. The model of Bruce and Bruce (2003) also divides the human body into compartments, including the muscular and non-muscular tissues. The present model has characteristics of the lung representation of Selvakumar, Sharan and Singh (1992) and Sharan and Selvakumar (1999), and the tissue representation of Bruce and Bruce (2003).
Table 1. Effects of COHb level in the blood of healthy subjects [adapted from WHO(1999)].
COHb (%) Effect
< 2 Small decreases in work capacity
5 Decrease of oxygen uptake and exercise performance;
decrements in neurobehavioral function
10 Shortness of breath on vigorous exertion; possible
tightness across the forehead; dilation of cutaneous blood vessel
20 Shortness of breath on moderate exertion; occasional headache with throbbing in temples
30 Decided headache; irritable; easily fatigued; judgement disturbed; possible dizziness; dimness of vision 40 – 50 Headache; confusion; collapse; fainting on exertion 60 – 70 Unconsciousness; intermittent convulsion; respiratory
failure; death if exposure is long continued
80 Rapidly fatal
The carbon monoxide transport model of the human respiratory system developed in the present work considers the exchanges of CO, O2 and CO2. The human body was divided into the following
Nomenclature
BE = base excess, mmol/L
COHb = CO hemoglobin saturation, 0 to 1
DL = diffusion coefficient through the respiratory membrane,
ml/(min.kPa)
F = fraction of gas in inspired air, 0 to 1
[Hb] = hemoglobin concentration, g/ml M = Haldane constant, non-dimensional
n = number of pulmonary capillary compartments O2Hb = O2 hemoglobin saturation, 0 to 1
P = partial pressure, kPa pH = blood pH
QB = cardiac output, ml/min
RQ = respiratory quotient V = volume, ml
A
V& = alveolar ventilation, ml/min
g
V& = metabolic consumption or production rate of g in the
tissues, ml/min x = content, ml/ml
Greek Symbols
α
= solubility coefficient, ml/(ml kPa)σ
= fraction of unshunted blood, 0 to 1Subscripts
a = arterial compartment
A = alveolar compartment
bar = barometric
CO = carbon monoxide
CO2 = carbon dioxide
cp = pulmonary capillary compartment
ct = tissue capillary compartment
H2O = water
i = index of the pulmonary capillary compartment, 1 to n in = inspired
g = gas CO, O2 or CO2 O2 = oxygen
pl = plasma
t = tissue and tissue capillary compartment
tm = muscular tissues
tn = non-muscular tissues
v = venous compartment
Gases Transport
The respiration process starts with the air passing through the dead space, where it is totally humidified. The water vapor pressure (PH2O) at the body temperature of 37 °C is 6.27 kPa (47 mmHg).
The pressure of the inhaled gases arriving in the alveoli is the barometric pressure less the water vapor pressure.
) (
=
2 ,
,in gin bar HO
g F P P
P − (1)
where g = CO, O2, CO2; Pg,in = partial pressure of g inspired [kPa];
Fg,in = fraction of g in inspired air [0 to 1]; Pbar = barometric
pressure [kPa]; PHO
2 = water vapor pressure [kPa].
The gas diffusion capacity through the respiratory membrane is known in physiology by DL. It is the relation between the flux of a
gas through the respiratory membrane and its driving force, which is the difference between the alveolar partial pressure and the average of the pulmonary capillary partial pressures. It includes the diffusion through the membranes and the speed of the chemical reactions in the erythrocytes.
The CO, O2 and CO2 gases are transported by the blood
dissolved and chemically reacted with hemoglobin. In the tissues, they are stored dissolved. In the muscular tissues, the CO and O2 are
also chemically reacted with myoglobin.
The amount of dissolved gases is equal to their partial pressures multiplied by the gas solubility coefficient. These coefficients for the blood at body temperature (37 °C) are (1.7, 2.2 and 50.3) x 10-4 ml/(ml.kPa) for CO, O2 and CO2 respectively. For the tissues
(assumed to be the same as water), these coefficients are (1.82, 2.36 and 56) x 10-4 ml/(ml.kPa) for CO, O2 and CO2 (Altman and
Dittmer, 1971).
Most of O2 is carried by the blood through its chemical reaction
with hemoglobin, forming a compound called oxyhemoglobin (O2Hb). It represents the O2 hemoglobin saturation (relation
between the amount of O2 reacted and the total amount of
hemoglobin), where 100% corresponds to the maximum capacity of 1.34 ml O2/g Hb (Guyton and Hall, 2006). The hemoglobin
concentration in the blood [Hb] of a normal subject is 0.15 g Hb/ml blood (Guyton and Hall, 2006). The relation between the O2 partial
pressure and its saturation is given by the dissociation curve. It varies in function of the CO2 amount in the blood and temperature.
The oxygen saturation is obtained as proposed by Kelman (1966) and Thomas (1972), considering the temperature equal to 37 °C:
6 2 3 4 2 3 4 2 10 x 2.4 100 31 400 2 15 000 2 045 2 15 = + − + − + + − N N N N N N N N Hb
O (2)
] 0.0013 7.4) ( [0.48 10 x 7.5 = 2 BE pH O P
N − − (3)
where O2Hb = hemoglobin saturation of O2 [0 to 1]; PO2 = partial
pressure of O2 [kPa]; BE = base excess [mmol/L].
The following relation represents the O2 transport in the blood.
Hb O Hb P
xO2 =αO2 O2+1.34[ ] 2 (4)
where
2
O
x = content of O2 [ml/ml]; αO2 = solubility coefficient of
O2 [ml/(ml.kPa)]; PO2 = partial pressure of O2 [kPa]; [Hb] =
hemoglobin concentration [g/ml]; O2Hb = hemoglobin saturation of
O2 [0 to 1].
The blood carries CO in the same way as O2, dissolved and
chemically reacted with hemoglobin. The reversible reaction of CO with hemoglobin forms the carboxyhemoglobin (COHb), also known as the CO hemoglobin saturation (COHb). The hemoglobin affinity of CO is about 250 times higher than O2. The maximum
blood capacity to carry reacted CO is the same as that of O2.
The classic work by Douglas, Haldane and Haldane (1912) is the first theoretical study of the interdependence between the CO and O2 hemoglobin saturation. They concluded that the presence of
CO in the blood moves the O2 dissociation curve to the left, reduces
its inclination and turns it more hyperbolic. That variation is known as the Haldane effect. Based on these observations, the theoretical relation named the Haldane equation was developed:
2 = 2 O CO P P M Hb O COHb (5)
where M = Haldane constant.
The value of the Haldane constant (M) is the hemoglobin affinity relation between CO and O2. Several researchers attempt to
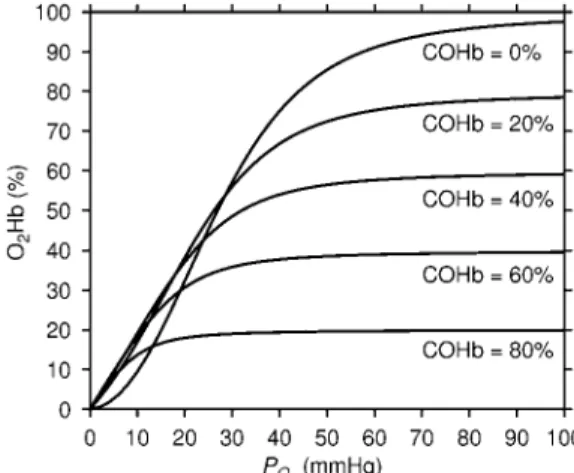
J. of the Braz. Soc. of Mech. Sci. & Eng. Copyright © 2008 by ABCM July-September 2008, Vol. XXX, No. 3 / 255 Figure 1 shows the O2 dissociation curve for several values of
COHb, obtained by the equations presented previously. Due to the similarity between the hemoglobin reactions of CO and O2, the CO
dissociation curve in the absence of O2 has the same form of the O2
dissociation curve in the absence of CO. The total hemoglobin saturation by O2 and CO is obtained by the O2 dissociation curve in
the absence of CO, considering the 2
O
P as PO2+MPCO.
Figure 1. Dissociation curve of O2 in the blood for several values of COHb.
CO2 is transported by the blood dissolved, bonded with
hemoglobin, and as bicarbonate ion. The CO2 bonded with the
hemoglobin forms the carbamino (CO2Hb). However, CO2 does not
occupy the same bonds with the iron atom of CO or O2. The amount
of CO2Hb depends on the hemoglobin saturation by CO and O2.
Most CO2 (approximately 70%) is transported in the form of
bicarbonate ion after reacting with water. To determine the total blood content of CO2, the model proposed by Douglas, Jones and
Reed (1988) is used:
⎥ ⎥ ⎦ ⎤ ⎢
⎢ ⎣ ⎡
− −
−
) (8.142 ) 0.456 (3.352
] [ 0.0289 1
=
2 ,
2
2 O Hb pH
Hb x
xCO CO pl (6)
[
( 6.1)]
, = 2 21 10
2
−
+ pH
CO CO pl
CO P
x α (7)
where xCO2,pl = content of CO2 in the plasma [ml/ml].
In the tissues, the gases are stored dissolved and, in the muscular tissues, also chemically reacted. The protein called myoglobin has a function similar to that of hemoglobin in the blood. It is used for O2
storage, forming the oxymyoglobin (O2Mb). CO also competes with
O2 for the bonds with the myoglobin, with affinity about 25 times
higher, forming the carboxymyoglobin (COMb).
The maximum myoglobin capacity to store the gases is determined as the hemoglobin capacity multiplied by the relation of their molecular masses, 68000 for Hb and 17600 for Mb (Guyton and Hall, 2006), divided by four (hemoglobin carries four molecules and myoglobin one). That relation was based on Bruce and Bruce (2003). The myoglobin concentration in the muscles is 0.0053 g/ml (Coburn and Mayers, 1971). The myoglobin saturation is also represented by a dissociation curve. The Hill equation was used to represent that curve, according to Schenkman et al. (1997).
The human body energy is generated by the oxidation of some compounds with bonds between carbon and hydrogen. These compounds are the carbohydrates, fats and some carbon-hydrogen chains. CO2 and water are generated as a product of that oxidation.
This process is known as metabolism. The relationship between the
amount of CO2 produced and the O2 consumed is the respiratory
quotient (RQ).
The human body produces CO in an endogenous way, mainly in the process of hemoglobin degradation (about 80%). The organ responsible for producing most CO is the liver. Coburn, Blakemore and Forster (1963) experimentally determined the value of CO endogenous production in rest as 0.007 ml/min.
The blood is distributed in the body by the cardiac output (QB).
Through the lung, only a fraction of the cardiac output exchange gases with the alveoli. That fraction, known by σ, is equal to 0.98 for a normal person (Guyton and Hall, 2006).
The total blood volume in the human body of adults is approximately 5000 ml (Guyton and Hall, 2006). That volume is divided in four parts. One represents the blood in the pulmonary capillary, with volume (Vcp) equal to 100 ml (Mountcastle, 1980).
The others values, based on Guyton and Hall (2006), are the arterial blood (Va), equal to 1000 ml, the venous blood (Vv), equal to 3550
ml, and the blood present in the tissues capillary (Vct), equal to 350
ml.
The volume of muscular tissues (Vtm) is approximately 30000
ml. The volume of the non-muscular tissues (Vtn) is approximately
7000 ml, determined by the volume of water (60% of body weight) less the volume of the muscular tissues and blood. The alveolar volume (VA) is approximately 2000 ml in the end of expiration
(Mountcastle, 1980).
The present model considers the variations of the physiologic parameters that more significantly affect the respiratory process, related to the O2 consumption (V&O2). These parameters are the
alveolar ventilation (V&A), cardiac output (QB), diffusion capacities
(DL), and respiratory quotient (RQ). Experimental data from several
authors were used to linearly interpolate an equation for each parameter. The equations define the parameter equal to
2 O
V b a+ & . The values of the coefficients a and b are presented in Tab. 2.
Table 2. Interpolated parameters (Parameter =a+bV&O2).
Parameter a b Unit Reference
A
V& -99.7 17.55 ml/min Guyton and Hall (2006)
QB 3738 7.6 ml/min Guyton and Hall (2006)
2
,O L
D 153 0.287 ml/(min.kPa) Turrino et al. (1963)
2
,CO L
D 456 1.25 ml/(min.kPa) Piiper et al. (1980)
CO L
D , 187 0.15 ml/(min.kPa) Turrino et al. (1963)
RQ 0.826 0.0000985 – Turrino et al. (1963)
Four physical activities were considered: resting, sitting, standing and walking. The values of
2 O
V& for each activity are 245,
346, 513 and 1020 ml/min, respectively (Mountcastle, 1980).
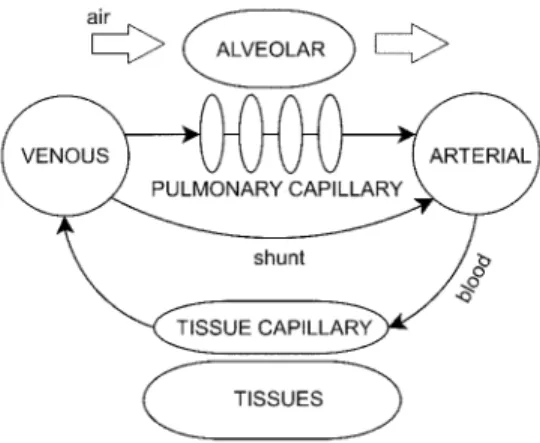
Model Presentation
Figure 2. Model representation.
For the model equation development, principles of mass conservation were used. The gases and liquids inside the compartments are considered uniform. The gas composition in each compartment is described by ordinary differential equations representing the time variation, one for each compartment and one for each gas. The sub-index g represents each one of the gases, being g equal to CO, O2 or CO2.
Alveolar Compartment
The first compartment, which connects the human body to the external air, is the alveolar compartment. It represents the gas found in the lung alveoli. The flow through that compartment is the alveolar ventilation. Inspired air gets in after being humidified in the dead space. Another important process in the alveolar compartment is the gas transfer by diffusion with the pulmonary capillary compartments through the respiratory membrane. The following equation represents the overall process, with the diffusion coefficient correction from STPD (Standard Temperature and Pressure Dry) to BTPS (Body Temperature and Pressure Saturated) (Altman and Dittmer, 1971):
) ( 101.325 273 310 ) ( = , , () 1 = , , , , i cp g A g n i g L A g in g A A g
A P P
n D P P V dt dP
V & − −
∑
− (8)where VA = volume of the alveolar compartment [ml]; Pg,A = partial
pressure of g in the alveolar compartment [kPa]; V&A = alveolar
ventilation [ml/min]; DL,g = diffusion coefficient of g through the
respiratory membrane [ml/(min.kPa)]; i = index of the pulmonary capillary compartment [1 to n]; n = number of pulmonary capillary compartments; Pg,cp(i) = partial pressure of g in the pulmonary
capillary compartment i [kPa].
Pulmonary Capillary Compartment
The pulmonary capillaries are represented by a series of compartments. Unshunted blood flows through them. Venous blood enters the first compartment. Then the blood flows to the next pulmonary capillary compartment exchanging gases with the alveolar compartment through the respiratory membrane. The diffusion coefficient is considered constant in all compartments.
The reason of using several compartments is the need of an adquate value of the local driving force since the gases change their concentration as they flow in the capillaries. Considering the computational effort and the need of a smooth curve, 10 compartments were considered enough. The following equation
represents the gas content variation of each pulmonary capillary compartment:
) (
) (
= , (1) , () , , , ()
) ( , i cp g A g g L i cp g i cp g B i cp g cp P P n D x x Q dt dx n V − + − −
σ (9)
where Vcp = volume of all pulmonary capillary compartments [ml];
xg,cp(i) = content of g in the pulmonary capillary compartment i
[ml/ml]; QB = cardiac output [ml/min]; σ = fraction of unshunted
blood.
Arterial Compartment
The unshunted blood that leaves the pulmonary capillaries mixes with the shunted blood and follows to the arterial compartment. It works as a system time delay. The following equation represents the arterial content variation:
] ) (1 [ = , () , , , a g v g n cp g B a g
a Q x x x
dt dx
V σ + −σ − (10)
where Va = volume of the arterial compartment [ml]; xg,a = content
of g in the arterial compartment [ml/ml]; xg,v = content of g in the
venous compartment [ml/ml].
Tissue and Tissue Capillary Compartments
The next compartment in which the blood flows is the tissue capillary compartment. There the blood exchanges gases with the tissue compartment, where metabolism takes place. The mechanism of tissue diffusion is complex. Because of that, it was simplified in the present model considering the gas partial pressures in the tissue capillary the same as the tissues.
The tissue compartment is divided in two volumes, one representing the non-muscular tissues and another representing the muscular tissues, where the gases CO and O2 are bonded to
myoglobin. In the tissues, the O2 is consumed ( 2
O
V& ) and the gases
CO and CO2 are produced with rates V&CO and
2
CO
V& , respectively.
The partial pressure variation of both compartments is represented by the following equation:
g ct g a g B t g t g tn g tn t g tm g tm t g ct g
ct Q x x V
dt dP dP dx V dP dx V dP dx
V − −&
⎟⎟ ⎟⎟ ⎟⎟ ⎠ ⎞ ⎜⎜ ⎜ ⎝ ⎛ + + , = ( , , ) , , , , , , (11)
where Vct = volume of the tissue capillary compartment [ml]; xg,ct =
content of g in the tissue capillary compartment [ml/ml]; Pg,t =
partial pressure of g in the tissue and tissue capillary compartment [kPa]; Vtm = volume of the muscular tissues [ml]; xg,tm = content of g
in the muscular tissues [ml/ml]; Vtn = volume of the non-muscular
tissue [ml]; xg,tn = content of g in the non-muscular tissues [ml/ml];
g
V& = metabolic consumption or production rate in the tissues [ml/min].
Venous Compartment
J. of the Braz. Soc. of Mech. Sci. & Eng. Copyright © 2008 by ABCM July-September 2008, Vol. XXX, No. 3 / 257 )
(
= , ,
,
v g ct g B v g
v Q x x
dt dx
V − (12)
where Vv = volume of the venous compartment [ml].
Numerical Solution
A computational program based on C++ language was developed in order to solve the equations in the steady state and transient conditions. The steady state solution is necessary to define the subject conditions in the beginning of the simulation. The conservation equations were solved using the successive approximation method for the steady state solution and the explicit Euler integration method for the transient solution.
Results
Validation
Stewart et al. (1970) conducted experiments exposing several subjects to CO concentrations of 50, 100, 200, 500 and 1000 ppm for periods from half hour to twenty-four hours. The COHb was obtained by the analysis of venous blood samples along the experiment. The post-exposition was also measured, breathing pure air. These data were used to validate the model. Figure 3a, Fig. 3b and Fig. 3c present the experimental data (•) and the numerical simulation (–) for constant CO concentrations of 50, 100 and 200 ppm respectively. Figure 3d presents the validation for a constant exposition of 500 ppm and an exposition with the CO concentration being incremented from 0 to 1000 ppm.
It was considered a typical subject, male, with 70 kg weight, 1.74 m height, and 30 years old at sea level with light levels of physical activity, depending on the exposition time. For the 50 and 100 ppm expositions the sitting activity was considered. For the 200, 500 and 1000 ppm exposition the activity was considered to be an average between sitting and standing. The initial condition was adjusted according to each experiment data.
The numerical results agree very well with the experimental data. For the post-exposition period, the agreement is also good.
Urban Atmosphere
The carbon monoxide concentration curves for critical days of the urban atmosphere of São Caetano do Sul (metropolitan area of São Paulo, SP, Brazil) were selected for simulation. On these days, in the year of 2003, the CO concentration presented great variations (Fig. 4). The time axis begins at 8:00 AM of July 19th and ends at 4:00 PM of July 23rd. The peaks of CO concentration occurred between 1:00 AM and 6:00 AM. The hourly concentration data were obtained from the local environmental protection agency (CETESB, 2004). These data were used as model input.
Physical Activity
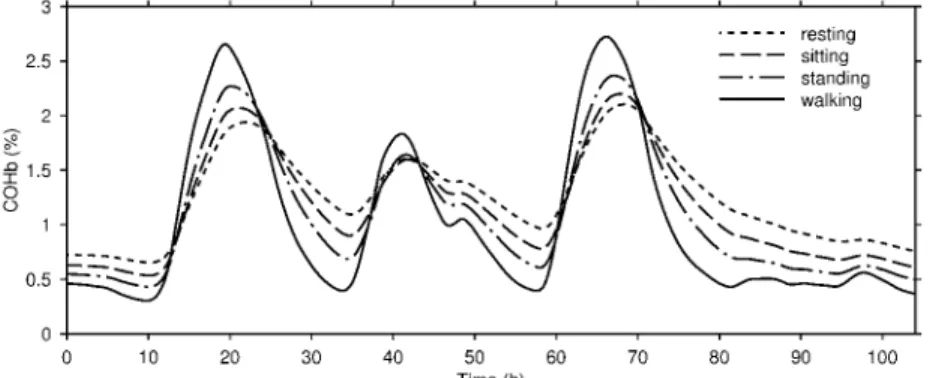
Figure 5 represents the COHb variation in the venous blood for four different levels of physical activity. It was considered a typical subject, male, with 70 kg weight, 1.74 m height, and 30 years old at sea level. As the physical activity level increases, the intensity of CO uptake and elimination also increase. The highest physical activity level simulated was an individual walking, presenting the highest and the lowest COHb levels. The more intense the physical activity, the more critical becomes the CO intoxication.
Air Quality Criteria
“Quality air criteria are concentrations of atmospheric pollutants that, once exceeded, can affect the health, safety, and wellness of the population, as well as cause damage to the flora and fauna, to the materials and to the ecosystem in general” (CONAMA, 1990). In the case of CO, it is defined based on the COHb limit in which humans do not suffer damages from poisoning. The Environmental Protection Agency (EPA, 2000) defined this limit as 2% of COHb in the blood, from several studies in men and animals. They are expressed as limits of average CO concentration that should not be exceeded more than once a year. The average concentration on an eight-hour exposition can not exceed 9 ppm, and on an one-hour exposition can not exceed 35 ppm (EPA, 2000; CONAMA, 1990). These definitions are used in several countries.
There are some studies about the validity of the CO quality air criteria using mathematical models. The analysis of Ott and Mage (1978) and Venkatram and Lough (1979) with empirical models suggested that the eight-hour criterion does not take into account peaks of variation. Ott and Mage (1978) proposed the use of a shorter average time as criteria and Venkatram and Lough (1979) suggested the use of a biological model. Collier and Goldsmith (1983) and Selvakumar, Sharan and Singh (1992) tested the criteria in high altitudes and concluded that volumetric standards are more appropriate than gravimetric standards.
Aiming at comparing the present model results with the eight-hour quality air criterion, the eight-eight-hour average of the input data (Fig. 4) and the COHb concentration from the walking subject (Fig. 5) are plotted together in Fig. 6. The two ordinate axes represent COHb level (left) and CO concentration (right). To plot this figure, two assumptions were made. The first is that the 9 ppm limit for the eight-hour average is equivalent to the 2% COHb limit concentration. The second assumption is that, in the absence of CO in the air (concentration of 0 ppm), the COHb level in the blood is equal to 0.5%, representing the CO produced by the human body. The simulation result is very close to the eight-hour average, mainly for high CO concentrations.
That result suggests that, for a typical subject, the use of the eight-hour average as CO quality air criterion is valid for light and moderate physical activity levels. On the other hand, it is noteworthy that the safety threshold of each subject may vary upon several characteristics not considered in the present model such as age, co-morbidities and genetic polymorphisms.
Conclusions
In the present work, a CO transport model for the human respiratory system was developed, considering the exchanges of CO, O2 and CO2. The human body was divided in compartments,
representing the places where these gases are present (alveolar, several pulmonary capillaries, arterial, venous, tissue capillary and tissues). The mathematical modeling generated a set of equations describing the gases transient concentration in each compartment, in function of physiological parameters. The model validation was done by comparing its results with experimental data. The agreement was good.
After validating the model, it was applied for some situations in urban atmospheres. The first result is about physical activity. Four conditions were simulated (resting, sitting, standing and walking). It was concluded that high physical activity levels present greater variations in the COHb level, being more susceptible to intoxication.
Figure 3. Comparison of COHb levels from the present model (–) and the experimental data (•) from Stewart et al. (1970) for CO concentrations of (a) 50 ppm, (b) 100 ppm, (c) 200 ppm, (d) 500 and 1000 ppm.
J. of the Braz. Soc. of Mech. Sci. & Eng. Copyright © 2008 by ABCM July-September 2008, Vol. XXX, No. 3 / 259 Figure 5. COHb for several physical activity levels.
Figure 6. Comparing the present model with the CO eight-hour average air quality criterion.
References
Altman, P.L. and Dittmer, D.S., 1971, “Respiration and circulation. Biological Handbooks”, Federation of American Societies for Experimental Biology, Bethesda, United States of America, 930 p.
Bruce, E.N. and Bruce, M.C., 2003, “A multicompartment model of carboxyhemoglobin and carboxymyoglobin responses to inhalation of carbon monoxide”, Journal of Applied Physiology, Vol.95, pp. 1235-1247.
CETESB – Company of Environmental Sanitation Technology, 2004, “Hourly data of carbon monoxide (CO) in the Metropolitan Region of São Paulo and Countryside – 2003” (In Portuguese), S.Paulo, Brazil, 155 p.
Coburn, R.F., Blakemore, W.S. and Forster, R.E., 1963, “Endogenous carbon monoxide production in man”, Journal of Clinical Investigation, Vol.42, pp. 1172-1178.
Coburn, R.F., Foster, R.E. and Kane, P.B., 1965, “Considerations of the physiological variables that determine the blood carboxyhemoglobin concentrations in man”, Journal of Clinical Investigation, Vol.44, pp. 1899-1910.
Coburn, R.F. and Mayers, L.B., 1971, “Myoglobin O tension determined from measurements of carboxymyoglobin in skeletal muscle”,
American Journal of Physiology, Vol.220, pp. 66-74.
Collier, C.R. and Goldsmith, J.R., 1983, “Interactions of carbon monoxide and hemoglobin at high altitude”, Atmospheric Environment, Vol.17, pp. 723-728.
CONAMA – National Environmental Council, 1990, “Resolution n.3 of July 28th 1990” (In Portuguese), Brazil.
Douglas, C.G., Haldane, J.S. and Haldane, J.B.S., 1912, “The laws of combination of Hæmoglobin with carbon monoxide and oxygen”. Journal of Physiology, Vol.44, pp. 275-304.
Douglas, A.R., Jones, N.L. and Reed, J.W., 1988, “Calculation of whole blood CO content”, Journal of Applied Physiology, Vol.65, pp. 473-477.
EPA – Environmental Protection Agency, 2000, “Air Quality Criteria for Carbon Monoxide”, EPA 600/P-99/001F, 2.ed, Washington, United States of America, 295 p.
Forbes, W.H., Sargent, F. and Roughton, F.J.W., 1945, “The rate of carbon monoxide uptake by normal men”, American Journal of Physiology, Vol.143, pp. 594-608.
Goldsmith, J.R., Terzaghi, J. and Hackney, J.D., 1963, “Evaluation of fluctuating carbon monoxide exposures”, Archives of Environmental Health, Vol.7, pp. 647-663.
Guyton, A.C. and Hall, J.E., 2006, “Textbook of medical physiology”, 11.ed, Ed. Saunders, Philadelphia, United States of America, 1116 p.
Kelman, G.R., 1966, “Digital computer subroutine for the conversion of oxygen tension into saturation”, Journal of Applied Physiology, Vol.21, pp. 1375-1376.
Lilienthal, J.L. and Pine, M.B., 1946, “The effect of oxygen pressure on the uptake of carbon monoxide by man at sea level and at altitude'',
American Journal of Physiology, Vol.145, pp. 346-350.
Marcus, A.H., 1980, “Mathematical models for carboxyhemoglobin”,
Atmospheric Environment, Vol.14, pp. 841-844.
Mountcastle, V.B., 1980, “Medical physiology”, 14.ed, Ed. C.V. Mosby Company, St. Louis, United States of America, 1999 p.
Pace, N., Consolazio, W.V., White, W.A. and Behnke, A.R., 1946, “Formulation of the principal factors affecting the rate of uptake of carbon monoxide by man”, American Journal of Physiology, Vol.147, pp. 352-359.
Peterson, J.E. and Stewart, R.D., 1970, “Absorption and elimination of carbon monoxide by inactive young men”, Archives of Environmental Health, Vol.21, pp. 165-171.
Piiper, J., Meyer, M., Marconi, C. and Scheid, P., 1980, “Alveolar-capillary equilibration of CO in human lungs studied by rebreathing”,
Respiration Physiology, Vol.42, pp. 29-41.
Schenkman, K.A., Marble, D.R., Burns, D.H. and Feigl, E.O., 1997, “Myoglobin oxygen dissociation by multiwavelenght spectroscopy”, Journal of Applied Physiology, Vol.82, pp. 86-92.
Selvakumar, S., Sharan, M. and Singh, M.P., 1992, “Mathematical model for the exchange of gases in the lungs with special reference to carbon monoxide”, Medical & Biological Engineering & Computing, Vol.30, pp. 525-532.
Sharan, M. and Selvakumar, S., 1999, “A mathematical model for the simultaneous transport of gases to compute blood carboxyhaemoglobin
build-up due to CO exposures: application to the end-expired breath technique”, Environmental Pollution, Vol.105, pp. 231-242.
Stewart, R.D., Peterson, J.E., Baretta, E.D., Bachand, R.T., Hosko, M.J. and Herrmann, A.A., 1970, “Experimental human exposure to carbon monoxide”, Archives of Environmental Health, Vol.21, pp. 154-164.
Stewart, R.D., Peterson, J.E., Fischer, T.N., Hosko, M.J., Dodd, H.C. and Herrmann, A.A., 1973, “Experimental human exposure to high concentrations of carbon monoxide”, Archives of Environmental Health, Vol.26, pp. 1-7.
Thomas, L.J., 1972, “Algorithms for selected blood acid-base and blood gas calculations”, Journal of Applied Physiology, Vol.33, pp. 154-158.
Turrino, G.M., Bergofsky, E.H., Goldring, R.M. and Fishman, A.P., 1963, “Effect of exercise on pulmonary capacity”, Journal of Applied Physiology, Vol.18, pp. 447-456.
Venkatram, A. and Lough, R., 1979, “Evaluation of CO quality criteria using a COHb model”, Atmospheric Environment, Vol.13, pp. 869-872.
![Table 1. Effects of COHb level in the blood of healthy subjects [adapted from WHO(1999)]](https://thumb-eu.123doks.com/thumbv2/123dok_br/18975476.455183/1.918.469.842.706.919/table-effects-cohb-level-blood-healthy-subjects-adapted.webp)