Research Paper
Modelling and simulation of cross flow grain dryers
O.A. Khatchatourian
a,*, H.A. Vielmo
b, L.A. Bortolaia
aaDepartment of Exact Sciences and Engineering, Regional University of the Northwest, Rio Grande do Sul, R. Sa˜o
Francisco, 501, 98700-000, Ijuı´, RS, Brazil
bDepartment of Mechanical Engineering, Federal University of Rio Grande do Sul, Rua Sarmento Leite, 425,
90050-170, Porto Alegre, RS, Brazil
a r t i c l e
i n f o
Article history:
Received 26 January 2013 Received in revised form 23 August 2013
Accepted 2 September 2013 Published online 12 October 2013
A mathematical model, algorithm, and computer program were developed to simulate the performance of cross flow grain dryers and cross flow dryers with energy saving. The mass and heat transfer processes were described by a system of four non-linear partial differ-ential equations. This system of equations was solved by the MacCormack method with time splitting. The Neumann method was used to determine convergence. The source-terms in these equations were computed by auxiliary semi-empirical equations obtained by experimental data from thin layer drying. Equipment developed to obtain these data permitted variation of the initial air humidity, temperature, and velocity. Fixed bed drying experiments were conducted to validate the model. Simulations using various control regimens were made to determine the impact on energy consumption and cross flow dryer performance due to recycling air exhausted from various stages of the dryer. An iterative process was used to determine the initial conditions at the entrance to each section of the dryer. The computer simulations were used to evaluate the non-uniformity of temperature and grain moisture content distributions in dryers, the duration of the drying process and the energy efficiency for each geometry and control regimen.
ª2013 IAgrE. Published by Elsevier Ltd. All rights reserved.
1.
Introduction
Due to the humid climate that occurs during the soya bean harvest, the moisture content of seed may be as high as 24e28% dry basis, (d.b.). Therefore practically all soya beans
must be thermally dried before storage. Considering the amount harvested, even minor improvements and accelera-tions in the drying process will provide significant economic benefit.
Mathematical modelling and computer simulation are widely used to design dryers and develop efficient grain drying control systems (Courtois, Lebert, Lasseran, & Bimbenet, 1991; Franc¸a, Fortes, & Haghighi, 1994; Han, Zuo, Zhu, Wu, & Liu,
2012; Liu & Bakker-Arkema, 2001). There are various mathe-matical models to describe the drying process. These models consider the heat and mass transfer between grain and air, the heat and moisture transfer inside the grain, deviations from the equilibrium state between the grain and drying air, and variations in the physical properties of air, water vapour, and grains due to variations in temperature and humidity (Barrozo, Felipe, Sartori, & Freire, 2006; Barrozo, Henrique, Sartori, & Freire, 1999; Brooker, Bakker-Arkema, & Hall, 1982; Luikov, 1966; Parry, 1985).
Generally these models represent a system of differential equations describing the energy and moisture transfer for an individual grain located in a layer, at the grain surface, and the
*Corresponding author.
E-mail address:[email protected](O.A. Khatchatourian).
Available online at
www.sciencedirect.com
j o u r n a l h o m e p a g e : w w w . e l s e v i e r . c o m / l o c a t e / i s s n / 1 5 3 7 5 1 1 0
1537-5110/$esee front matterª2013 IAgrE. Published by Elsevier Ltd. All rights reserved.
conservation of energy and mass at the boundary layer be-tween the grain and humid air (Brooker et al., 1982; Khatchatourian & Oliveira, 2006). The nonlinearity of these equations does not allow for an analytical solution. The nu-merical methods used (finite difference method, finite element method, etc.) represent the integration domain (the
drying chamber) as a set of subdomains in which any parameter, at any moment in time, is found by using simpli-fied interpolation equations (usually linear or square-law). Since the size of the spatial elements is small, and the time step is small, the change in the parameters within a single element is insignificant; therefore to calculate the local mass flow and heat flow densities a thin-layer drying model can be used (Jayas, Cenkowski, Pabis, & Muir, 1991; Parti, 1993). Thus, the quality of thin-layer drying models essentially defines the simulation results for bulk drying.
This paper is dedicated to modelling of cross flow grain dryers (Fig. 1) widely used for drying of soya beans in the Rio Grande do Sul State, Brazil.
Cross flow grain dryers have been studied by several au-thors, for example,Barrozo, Felipe, Sartori, and Freire (2006), Eltigani and Bakker-Arkema (1987), Giner, Mascheroni, and Nellist (1996), Han et al. (2012), Mayta, Massarani, and Pinto (1996), Liu and Arkema (2001), Moreira and Bakker-Arkema (1990), Platt, Rumsey, and Palazoglu (1991), Rumsey and Rovedo (2001), To´rrez, Gustafsson, Schreil, and Martı´nez (1998), Zhihuai and Chongwen (1999). Models used in earlier studies were presented in summary form inLaws and Parry (1983), and described in review byParry (1985). However, to select the optimal scheme and parameters of cross flow grain dryers further investigation is required. Except for general recommendations based on the experiences and preferences of some authors (for example, Kemp, 1999; Marinos-Kouris, Maroulis, & Kiranoudis, 1998; Rumsey & Rovedo, 2001, etc.), no systematic studies on the selection of the optimal number of drying steps, the initial temperature distribution for each stage, the ratio of heights between the stages, the analysis of non-uniformity of temperature and moisture concentration, the impact of recirculating exhaust air from the drying zones into the previous chamber, occur in the literature. In partic-ular, the calculation of the effect of recirculating exhaust air requires knowledge of the effect of increased initial air hu-midity on grain drying, and the authors have dedicated a lot of effort to study this effect (Khatchatourian, 2012).
Fig. 1eLayout of continuous flow grain dryer with three drying stages and cooling chamber.
Nomenclature
a grain surface area/volume ratio, m 1
A binary matrix
Ai lateral area of the air inlet, m2 Cpg specific heat of the grain, J kg 1K 1
Cpv specific heat of the water’s vapour, J kg 1K 1 Cpw specific heat of the water, J kg 1K 1
F column of the right sides
Hv latent heat of the water vaporization, J kg 1; k1,k2 proportionality coefficients,
L bed height, column width, m
Lx,Ly MacCormack’s operators
M grain moisture content, decimal, d.b.
n quantity of stages or constant
q velocity factor, dimensionless
t time, s
Ta air temperature,C Tg grain temperature,C
Ti initial air temperature to stagei
U column-vector of the unknown functions
Vx horizontal air velocity, m s 1 Vy grain velocity, m s 1
W air humidity, decimal
3 porosity, dimensionless
ra specific mass of the air, kg m 3 rg specific mass of the grain, kg m 3
Fh heat flux, W m 2
Fm mass flux, kg m 2s 1
Subscripts:
0 initial
1 first stage
2 second stage
a air
c cooling
e equilibrium
g grain
The principal objectives of the present work were to:
a) create a mathematical model of drying of grains;
b) develop software for simulation of continuous cross flow dryer with multiple stages;
c) carry out simulations to evaluate the efficiency of various dryer control schemes.
2.
Mathematical model
Figure 1represents one of the continuous flow grain dryers investigated. It has three drying stages and one cooling chamber. Ambient air passes through the cooling chamber, it is then heated as it passed through the warm grain and is mixed with the heated furnace air. This mixtureA passes through the grain in the third stage. Air leaving the third stage, mixes with the heated furnace air and the resulting mixtureB
enters in the second stage. Similarly, the mixtureCenters in the first stage, heats up and dries the grain entering from above and used air is then exhausted to the atmosphere.
In summary, the cross flow drying model for these condi-tions is:
8 > > > > > > > > <
> > > > > > > > :
vTa
vt þVx
vTa
vxþVy
vTa
vy ¼
að1 3Þ ra 3 $
FmCpvðTg TaÞþFh CpaþCpvW
vTg
vt ¼
afFh Fm½HvþðCpv CpwÞTgg rgðCpgþMCpwÞ
vW
vtþVx
vW
vxþVy
vW
vy¼
Fmað1 3Þ ra3
vM
vt ¼
Fma rg
(1)
whereMis the grain moisture content, d.b.;Wis the air hu-midity;ais grain surface area/volume ratio in m 1;Hvis latent
heat of the water vaporization in J kg 1;Cpgis the specific heat
of the grain in J kg 1K 1;Cpvis the specific heat of the water
vapour in J kg 1K 1;C
pwis the specific heat of the water in
J kg 1K 1;r
gis the specific mass of the grain in kg m 3;rais
specific mass of the air in kg m 3; 3 is porosity;V
xis the air
velocity in m s 1;Vyis the vertical velocity in m s 1;Tais the
air temperature inC;Tgis the grain temperature inC;F his
the heat flux in W m 2;F
mis the mass flux in kg m 2s 1.
Since the vertical component of the velocity is small rela-tive to the velocities in the horizontal directions, the structure of the grain mass in a cross flow dryer is similar to the structure in a fixed-bed dryer. Therefore, it is not correct to take into account the convective term caused by the grain mass movement for cross-flow drying model, as suggested in some works (for example, in Parry, 1985; Rumsey, 1986; Rumsey & Rovedo, 2001).
The system of equations is obtained by means of the Lagrangian specification of the flow field and has some dif-ferences from the system of equations proposed inBrooker et al. (1982). For example, the terms, related with the vapour heating fromTgtoTa, are included in the energy equation for
the gas, but not for grain. In the equation for the enthalpy change of grain there is enthalpy of water that leaves the grain and then evaporates into the gas phase. There are also some partial derivatives for the parameters of moist air which were neglected byBrooker et al. (1982).
The heat flux,Vh, was calculated in accordance using the
relationships, presented by Khatchatourian and Oliveira (2006). As their experimental study showed, the diffusion co-efficient for soya bean seed has a variable value in a radial direction. Therefore, in this work, to determine the mass flux
Vm, a two-compartment grain model for soya bean thin-layer
drying was chosen. The mathematical model was presented by a system of two ordinary differential equations (Khatchatourian, 2012):
8 <
: dM1
dt ¼ k1ðM1 M2Þ; dM2
dt ¼ k1ðM2 M1Þ q$k2
Mg0 Me
n 1
Mn 2
(2)
where M1and M2 are average relative moisture content of
grain in the first and the second grain compartments respec-tively,k1andk2are proportionality coefficients,tis time in s,n
is constant,qis a factor related with velocity influence. The coefficient,k1, is related with a diffusion coefficient in
the first compartment andk2unites the effects of diffusion in
the second compartment and convective transfer at the grain surface.
The second equation in the system Eq.(2)represents the influence of the initial grain moisture content (M0) and the air
humidity through equilibrium moisture content (Me) on the
drying rate. Applying the inverse problem method, the co-efficientsk1and k2were obtained for different initial grain moisture contents and temperatures at the same velocity
Vx ¼ 0.9 m s 1 (q ¼ 1). As experimental data show
(Khatchatourian, 2012) the coefficientsk1andk2depend on
temperature. The influence of initial grain moisture content onk1andk2can be neglected. To take into account the influ-ence of velocity on drying, the coefficientk2was multiplied by a factor:
q¼1:25 1:1e 1:52V0:048þ1:21M0
(3)
The factor is equal to 1 whenVx¼0.9 m s 1(basic velocity)
andM0¼0.16.
The initial and boundary conditions for grain mass in each stage depend on the parameters in the output of the previous stage located immediately above. Furthermore, the inlet air humidity (boundary condition for air humidity) depends on the amount of air recirculation. In other words, these condi-tions depend on the number of stages and the scheme of distribution and recirculation of air.
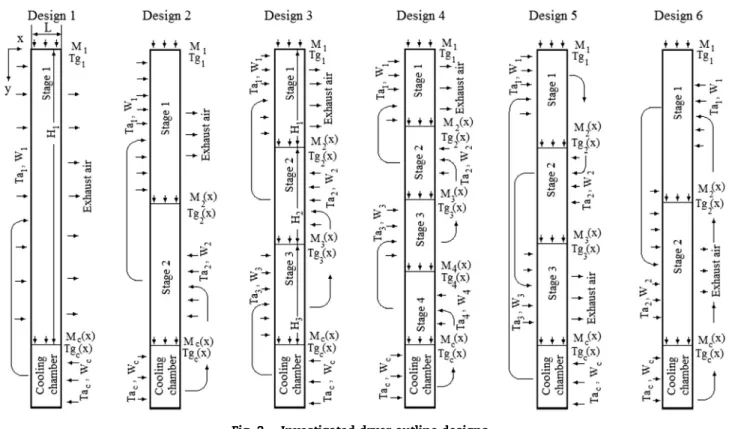
Figure 2 shows some schemes of dryers which were considered in this work.
For Scheme 3 (Fig. 2), which corresponds to the layout of a cross flow grain dryer with three drying stages (Fig. 1), the initial and boundary conditions for stageiwere described as follows:
The boundary conditions:
M1ðt;x;0Þ ¼M0;Tg1ðt;x;0Þ ¼Tg0;T1ðt;0;yÞ ¼Ta1;T2ðt;0;yÞ
¼Ta2;T3ðt;0;yÞ ¼Ta3:
The boundary conditions for variablesM2(t,x,H1),T2(t,x,H1), M3(t,x,H1þH2),Tg3(t,x,H1þH2),Mc(t,x,H1þH2þH3),Tgc(t,x,
The initial conditions:
Mið0;x;yÞ ¼M0;Tgið0;x;yÞ ¼Tg0;Wið0;x;yÞ ¼W0;Taið0;x;yÞ
¼Tg0ði¼1;2;3;cÞ;
where the indices a, g, c correspond to air, grain and the cooling chamber respectively.
3.
Solution of the partial differential
equations
The system (hyperbolic) of partial differential quasi-linear equations was rewritten in the matrix form:
vU
vtþA$
v
U
vx vU
vy
Vx Vy
¼Fðt;x;y;UÞ (4)
whereUis the column-vector of the unknown functions;Ais the binary matrix;F is the column of the right sides of the system (1):
U¼ 0
B B @
Ta Tg W M 1
C C A
; A¼
2
6 6 4
1 0 0 0 0 0 0 0 0 0 1 0 0 0 0 0 3
7 7 5
; F¼
0
B B @
F1 F2 F3 F4
1
C C A
: (5)
To solve the system, a two-dimensional MacCormack’s method with scheme “time-split” (MacCormack, 1971; MacCormack & Paullay, 1972) was used.
The iterative MacCormack’s method with the “time-split” transforms the two-dimensional problem in sequence of
one-dimensional problems. Considering the differential operator
Lx, related to the spatial variablex:
U
i;j¼LxðDtxÞUni;j (6)
The MacCormack’s method (MacCormack, 1969) corre-sponds to the sequence of operations:
Predictor:
U i;j¼U
n i;j
Dtx$Vx
Dx
h Un
iþ1;j Uni;j i
þDtxFn
i;j (7)
Corrector:
U i;j¼
1 2
Un i;jþUi;j
Dtx$Vx
Dx
U
i;j Ui 1;j
þ
DtxF i;j
2 (8)
The asterisk (*) is used to denote the parameters with in-termediate time steps. The equations for the variablesTgand Xgdon’t contain the terms with the velocities.
Lyoperator was defined similarly substitutingVxandtxby Vyandty. The MacCormack’s method with the “time-split” can
be presented as:
Unþ1 i;j ¼Lx
D
tx
2
Ly
Dty Lx
D
tx
2
Un
i;j (9)
AssumingVxandVyas constants, the operatorLxfor the half
time-step and the derivatives with respect tox, is composed of:
Predictor:
Unþ1=2
i;j ¼U
n i;j
DtxVx 2Dx
h Un
iþ1;j U n i;j i
þDtx
2F
n
i;j (10)
Corrector:
Ui;jnþ1=2¼1 2 "
Un i;jþU
nþ1=2 i;j
DtxVx 2Dx U
nþ1= 2
i;j U
nþ1= 2
i 1;j !#
þ
DtxFnþ1=2
i;j
2
(11)
The operatorLyfor full time step and the derivatives with
respect toyis formed: Predictor:
U i;j¼U
nþ1=2 i;j
DtyVy
Dy
h Unþ1=
2
i;jþ1 U nþ1=2 i;j
i
þDtyFnþ1=2
i;j (12)
Corrector:
U i;j¼
1 2
Unþ1=2 i;j þUi;j
DtyVy
Dy
U
i;j Ui;j 1
þDt
yFi;j (13)
And again the operatorLx:
Predictor:
Unþ1=2 i;j ¼Ui;j
DtxVx 2Dx
h U
iþ1;j Ui;j i
þDtx
2F
i;j (14)
Corrector:
Unþ1 i;j ¼
1 2
U i;jþU
nþ1=2 i;j
DtxVx 2Dx
Unþ1=2
i;j U
nþ1=2 i 1;j
þ
DtxFnþ1=2
i;j
2 (15)
The software was developed in Dev-Pascal 1.9.2 (distributed under the GNU General Public License,http://www.bloodshed. net/devpascal.html) and consists of tools for geometry con-struction and mesh generation. Three iterative processes were used for simulation: a) the first (internal) was used for each time step to compute the source terms (due to their non-linearity); b) the second (intermediate) was used to determine the boundary conditions between stages and air humidity in the side entrance to each stage (which depends on the composition of the air furnaceþfresh airþair recirculation); c) the third iterative process (external) was applied to calcu-late the drying time to achieve the required average moisture
content of grain in the dryer outlet (15% d.b.),i.e., to calculate the vertical velocity Vy. The stability analysis was realised
using the Neumann method; the time stepsDtx,Dtyand the length intervals Dx, Dy were chosen to satisfy the Coura-nteFriedrichseLewy condition (Courant, Friedrichs, & Lewy,
1967).
4.
Validation of the developed model
To validate the developed model, experiments on the drying dynamics of soya beans in a fixed bed were conducted and the comparisons were made between values obtained experi-mentally and by the simulations.Figure 3shows the experi-mental equipment used to study the drying dynamics in the fixed bed. The equipment consists of a ventilating fan, orifice plate, heat booster, steam generation and injection systems, a data acquisition system, and the drying chamber. The drying
Fig. 3eExperimental equipment.
0 20 40 60 80 100 120
20 30 40 50 60 70 80 90 100
x/L=0.187 x/L=0.438 x/L=0.687 x/L=0.934 Predicted
Grai
n temperat
ure,
o C
Time, min
tests were conducted for soya bean in the temperature range 70e110 C and velocity range 0.2e0.9 m s 1. The drying
chamber consisted of seven sections, each measuring 0.050.130.13 m with total height of 0.35 m. Each section has a height of 0.05 m; the chamber was insulated with glass wool. Each section was removable and had a perforated screen on the bottom. The experiments were conducted using four sections of the drying chamber, resulting a bed height of 0.2 m. Temperatures of air and grain were measured in all four sec-tions by Type-K thermocouples with precision0.75%. Using a digital analytical balance with 0.001 g readability, the dy-namics of grain mass loss in each section was determined, allowing the determination of the variation of moisture con-tent of grain. The air temperature was measured at the outlet of each section. The grain temperature was measured by placing a Type-Kthermocouple junction at the centre of an individual seed located 0.01 m from the outlet of each section. Soya beans for the experiments were stored with a moisture content of 22% (d.b.). Each experiment was repeated 3e4 times
with the same initial conditions.
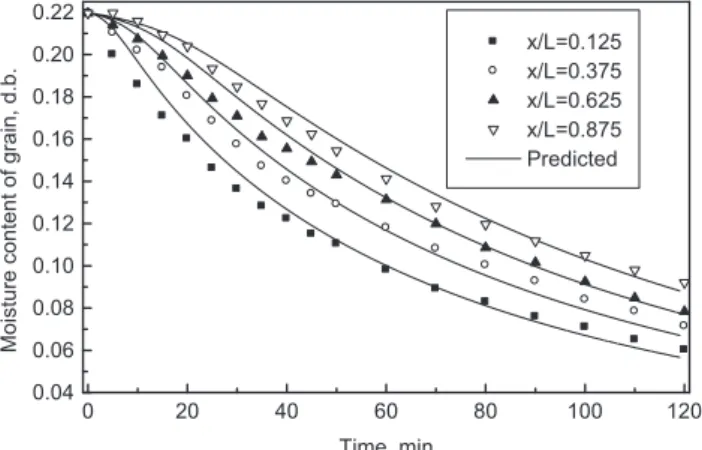
The comparison between the experimental data for soya beans (Ta¼100C;Vx¼0.5 m s 1) and simulation results for
the fixed bed are shown inFigs. 4e6.Figure 4shows the
dy-namics of variation of the grain temperature along the
measuring chamber. The layers that are closer to the input section, heated much faster than the layers at the exit of the chamber. Accordingly, the drying process (Fig. 5) was non-uniform with the layers near the air inlet (x/H¼0.25) drying faster. Layers at the exit of the chamber (x/H¼1.0) dried more slowly. The variation of the calculated and measured air temperature in the drying process is shown inFig. 6.
Comparative analysis of the calculated and experimental results shows that the developed model adequately described the processes involved in the drying process. There was a small tendency for a lag in time between the predicted and experimental data which can be neglected since calculations of drying in this case will guarantee that the required grain moisture is achieved at the selected drying time.
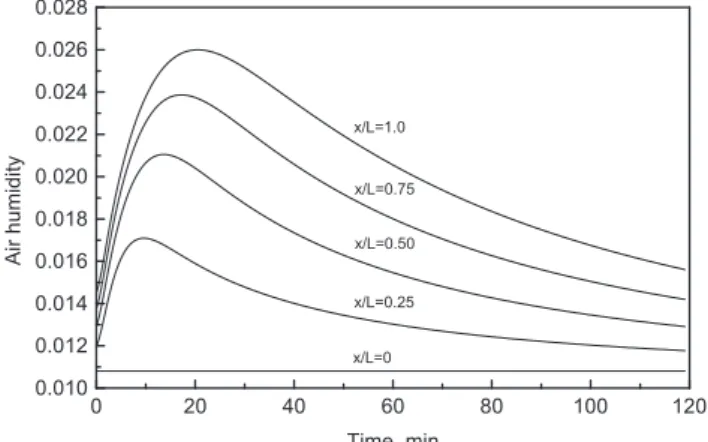
Figure 7shows a significant variation in humidity in the fixed bed. Air humidity reaches a maximum after 10e20 min
of drying, that undoubtedly affects the local process of drying and therefore the influence of air humidity should be considered in the calculations.
5.
Simulation of results
Using the developed model, various numerical simulations were made. Initially, the influence of airflow direction re-versals along the height of the dryer on the non-uniformity of grain temperature and moisture content distributions was studied. Subsequently the influence of air humidity increase caused by reuse of drying air on the drying dynamics and drying time was studied.
5.1. Influence of number of airflow direction reversals
Various dryers with the same overall column height (10.47 m) composed of the several equal drying stages were compared (Fig. 2 shows the first six schemes with drying stages numbered from 1 to 4). Each a dryer had a 2.13 m height cooling chamber. For each subsequent stage there was a consecutive reversal of the airflow direction. The initial tem-peratures for all stages were set to 100C.
The distribution of the grain moisture content in outlet cross-section of studied dryers (curves number corresponds to dryers order number inTable 1) is uniform and this non-uniformity depends strongly on the dryer outline (Fig. 8).
Figure 9shows the influence of stage number on distribu-tion non-uniformity of grain moisture content and grain temperature in outlet cross-section of dryer (at the cooling inlet). A non-uniformity was estimated by means of the maximum relative difference of grain temperature
dTmax ¼ (Tmax Tmin)/Tmean$100% and moisture content dMmax ¼ (Mmax Mmin)/Mmean$100% in considered section
(square points), or by mean-square deviation from the mean
in the horizontal direction
dT¼
ffiffiffiffiffiffiffiffiffiffiffiffiffiffiffiffiffiffiffiffiffiffiffiffiffiffiffiffiffiffiffiffiffiffiffiffiffiffiffiffiffi
Z1
0 ð
T TmeanÞ2dx s
=Tmean$100% and
dM¼
ffiffiffiffiffiffiffiffiffiffiffiffiffiffiffiffiffiffiffiffiffiffiffiffiffiffiffiffiffiffiffiffiffiffiffiffiffiffiffiffiffiffiffiffi
Z1
0
ðM MmeanÞ2dx
s
=Mmean$100% (triangular points). As
it was expected, the airflow direction reversal reduces the
0 20 40 60 80 100 120
0.04 0.06 0.08 0.10 0.12 0.14 0.16 0.18 0.20 0.22
x/L=0.125 x/L=0.375 x/L=0.625 x/L=0.875 Predicted
Mois
ture content of grain, d.b.
Time, min
Fig. 5eExperimental and predicted dynamics of soya beans drying in fixed bed.
0 20 40 60 80 100 120
30 40 50 60 70 80 90 100
x/L=0 x/L=0.25 x/L=0.50 x/L=0.75 x/L=1.0 Predicted
Air temperatur
e,
o C
Time, min
non-uniformity of all parameters in outlet cross-section of dryer.
There is a general tendency for the non-uniformity of temperature and grain moisture content distributions in outlet cross-section of dryer to decrease as the number of stages increases. These relationships have local minima (for even values of the number of stages), and the local maxima (for odd values).
This is a consequence of the fact that for an even number of stages there are the same inlet conditions of the drying air to both sides of the column.
The minimum of the moisture content non-uniformity, achieved with two stages, is a global, and the increase in the number of stages (>4) does not improve the uniformity of the field. As the calculations show (Fig. 10), the drying time is slightly increased with the number of stages (triangular points). Probably, an equalisation of temperature field results in the reduction of grain quantity subjected to higher tem-perature, when the drying process is most intensive. In return with increasing number of stages the possibility of heat regeneration (square points) increases significantly.
It can be concluded that among the considered dryers, the scheme with two stages is the most acceptable. With a rela-tively small increase in drying time, this scheme presents the output parameters field with the least non-uniformity, and the possibility for energy saving is high (up to 34%). To regenerate the heat, the air, heated by contact with hot grain in previous stages, was mixed, with furnace air at 300C. Air velocity in each stage was equal. Air humidity at the inlet to each stage depended on the fraction and humidity of the reuse air.
5.2. Influence of air humidity increase caused by reuse of drying air
Figure 11shows the effect of additional humidity caused by air reused, on the drying process in a dryer with four stages. This effect is significant for last layers of the upper stage (stage 1). When the grain moves down, this influence diminishes and becomes negligible near the exit section of the dryer.
Calculations show that the drying time for the dryer with four stages is increased by less than 1% in the case of air reuse by increasing the air humidity at the inlet to each stage. At the same time the heat recovery under these conditions can reach 45% (Fig. 10).
Subsequently, the influence of the initial temperature distribution in the air inlet of each stage was studied. To equalise the consumption of energy per unit of time for each studied scheme the sum of the products of initial temperature on the lateral area of stage was kept constant, i.e.:
Pn
i¼1TiAi¼constant, whereTiis the initial temperature of the
air to stagei,Aiis the lateral area of the air inlet,iis the stage
order number,nis the quantity of stages.
Table 1shows the initial temperatures of the air for the studied dryers, their non-uniformity characteristics, energy saving and relative drying time.
It is interesting to note that both the maximum relative difference between the parameters and the standard devia-tion from the mean can be used for comparison to non-uniformity of the dryer, because the correlation coefficient between them is greater than 0.995. Comparative analysis of the effectiveness of these dryers can be made usingFig. 12, which shows a total non-uniformity of the temperature and concentration fields. Lowering the temperature of the stages that are close to the cooling reduces the non-uniformity of the temperature field (dryers 4, 9 and 11). Increasing the length of continuous domains with high temperature reduces the non-uniformity of the moisture content field (dryers 2, 5, 6, 8, 10 and 11). Despite the fact that concentration non-uniformity is minimal for the dryer 2 (two stages with the same inlet tem-perature), the lowest total non-uniformity is achieved for the dryer 8 (three stages with temperatures 100e120e80 C,
respectively), the second lowest is for dryer 6, and the third for dryer 2.
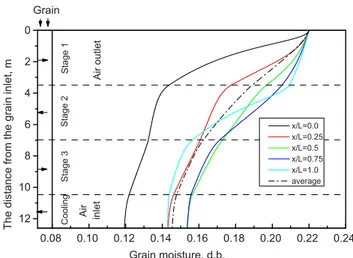
Simulation results of dryer 6 are shown inFigs. 13e16. The
values of the parameters were taken as follows:
H1¼H2¼H3¼3.49 m;L¼0.167 m; air velocityVx¼0.4 m s 1; M0 ¼ 0.22 (d.b.); Tg0 ¼ 20 C; Ta1 ¼ 120 C; Ta2 ¼ 100 C; Ta3¼80C;Tac¼25C.
It can be seen inFig. 13that the drying process in the initial (x/L¼0) and final (x/L¼1) sections occurs the most rapidly. In the middle section (x/L ¼0.5) drying curve lags behind the average. Air and grain temperatures in the different cross-sections (Figs. 14 and 15) differ significantly in only the first stage. For subsequent stages the temperature difference decreases.
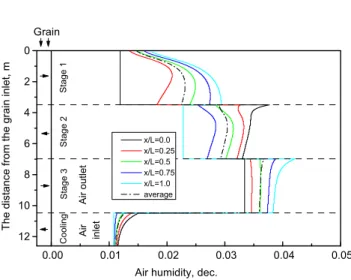
Air humidity at the outlet of the first stage varies signifi-cantly with height (Fig. 16). For subsequent stages this differ-ence is not very large. The highest moisture air for drying enters the first stage, because this air contains all the moisture received from the grain in second and third stages. As the air temperature at the inlet of the cooling chamber was chosen relatively low (Ta¼25C), the variations in grain moisture and
air humidity inside the cooling chamber were not great. This allows monitoring of the completeness of the drying process in any section of the cooling chamber.
Comparative analysis of the calculations made for Schemes 3 and 5 (fromFig. 2) withTa1¼120C;Ta2¼100C; Ta3¼80C;Tac¼25C, shows that Scheme 3 results in a large
reduction in energy (Fig. 18, solid points) despite the fact that
0 20 40 60 80 100 120
0.010 0.012 0.014 0.016 0.018 0.020 0.022 0.024 0.026 0.028
x/L=0.25 x/L=0.50 x/L=0.75 x/L=1.0
x/L=0
Air humidity
Time, min
the average percentage of recycled air is greater for Scheme 5 (Fig. 18, open points). This is due to the fact that the used air, exhausted from the third stage and having a higher average temperature than exhausted from the first stage, in Scheme 5 is exhausted to the atmosphere, but in Scheme 3 it is applied for reuse. In addition, there is a small increase of the drying time for Scheme 5 (between 2 and 3%). This increase is related to the influence of the initial air humidity at the inlet to each stage. A comparison betweenFigs. 16 and 17shows that air humidity at the entrance to the stages 2 and 1 (Scheme 3) is less than for the corresponding stages 2 and 3 of Scheme 5. Similar results were obtained when comparing Schemes 2 and 6 (fromFig. 2).
AsFig. 18shows, the energy savings increases when the temperature of the heated furnace air increases, since the fraction of reuse air in mixture rises.
6.
Conclusions
A mathematical model, algorithm and computer program for the simulation of cross flow driers with exhaust air recircu-lation, were developed. The iterative MacCormack’s method with “time-split”, which transformed the two-dimensional problem into a sequence of one-dimensional problems, was
successfully applied for the solution of a system of non-linear partial differential equations. The simulations for the studied dryer outlines showed good performance of the developed program.
Non-uniformity of the temperature and moisture concen-tration fields in outlet cross-section of cross flow dryers de-pends strongly on the grain dryer outline and can be significant.
Reversing the airflow direction equalises the distribution of parameters in the transverse dryer direction. At the same time, the optimal reversal number is one or two (i.e.two or three stages). The influence of the increase of the air humidity due to reuse of air on the dryer performance can be neglected. Upward motion of the reuse air from stage to stage, i.e. against the direction of motion of the grain mass, gives higher energy savings compared with downward motion.
For three-stage dryers, the use of the different initial air temperatures for different stages allows to obtain a more uniform distributions of temperature and moisture content, if to use the maximum temperature in the second stage and the minimum temperature in the third stage. For a two-stage dryer, the use of the same inlet air temperature in the both stages is preferred.
Validation of the software using experimental data for the full-scale dryers is required.
Table 1eSimulation details of studied dryers: number of stages, initial temperatures of the air, non-uniformity characteristics, energy saving and relative drying time.
Simulation number 1 2 3 4 5 6 7 8 9 10 11
Number of stages 1 2 2 2 3 3 3 3 3 3 3
Initial temperature,C 100 100 100
120 80
80 120
100 100 100
120 100 80
120 80 100
100 120 80
100 80 120
80 120 100
80 100 120
dTmax, % 38.3 33.3 17.7 49.3 34.3 19.8 38.9 16.3 52.4 31.7 49.2
dMmax, % 39.5 15.0 31.8 24.8 19.0 23.2 31.8 19.6 30.6 19.6 20.9
dT, % 11.3 10.1 5.2 15.3 11.0 6.5 12.4 5.3 16.7 10.1 15.7
dM, % 11.4 4.0 9.4 7.0 5.2 6.1 9.2 5.1 9.1 5.0 5.9
Energy saving, % 7.45 33.6 30.3 34.8 41.0 39.7 39.9 40.3 40.2 40.8 40.7 Relative drying time 1.00 1.05 1.07 1.02 1.09 1.09 1.10 1.08 1.08 1.07 1.06
0.0 0.1 0.2 0.3 0.4 0.5 0.6 0.7 0.8 0.9 1.0 0.11
0.12 0.13 0.14 0.15 0.16 0.17 0.18
10
4 5 11 7
8 6 9
3
2 1
Grain moisture content, d.b.
x/L, dimensionless
Fig. 8eGrain moisture content distribution in outlet cross-section of studied dryers (curves number corresponds to the simulations inTable 1).
1 2 3 4 5 6
5 10 15 20 25 30 35 40
Grain temperature : maximum difference Moisture content : maximum difference Grain temperature : standard deviation Moisture content : standard deviation
Non-uniformity, (%)
Stages (number)
3
1 2 4 5 6
0 10 20 30 40 50
Energy saving Drying time increase
Variation, (%)
Stages (number)
Fig. 10eInfluence of number of stages on energy saving and drying time.
0 2 4 6 8 10 12
0.12 0.14 0.16 0.18 0.20
0.22 , x/L=0.0
, x/L=0.25 , x/L=0.5 , x/L=0.75 , x/L=1.0
Grain moisture cont
ent, d.b.
Dryer depth, m
Fig. 11eInfluence of additional humidity caused by air reuse on drying in a four stage dryer (outline design 4 in Fig. 2); continuous line: without air reuse; dash dot line: with air reuse.
1 2 3 4 5 6 7 8 9 10 11
0 4 8 12 16 20 24 28
Mean square de
viation, (
%
)
Simulation number Temperature
Moisture content
Fig. 12eMean square deviations of grain temperature and moisture content in outlet cross-section of studied dryers (simulation details inTable 1).
12 10 8 6 4 2 0
0.08 0.10 0.12 0.14 0.16 0.18 0.20 0.22 0.24
Grain
Ai
r o
u
tlet
Air inlet
Coo
ling
Stag
e 3
St
age 2
Stag
e 1
x/L=0.0 x/L=0.25 x/L=0.5 x/L=0.75 x/L=1.0 average
Grain moisture, d.b.
The dis
tanc
e
from the grain
inlet,
m
Fig. 13eDistribution of moisture content of grain for the simulation 6 (Table 1) at a steady state.
12 10 8 6 4 2 0
0 20 40 60 80 100 120 Grain
Air outlet
Air inlet
Co
ol
in
g
St
ag
e 3
St
ag
e 2
Stag
e 1
x/L=0.0 x/L=0.25 x/L=0.5 x/L=0.75 x/L=1.0 average
Grain temperature, oC.
The distance from the grain inlet, m
Fig. 14eDistribution of grain temperature for the simulation 6 (Table 1) at a steady state.
12 10 8 6 4 2 0
0 20 40 60 80 100 120 Grain
Ai
r
in
le
t
Air out
let
Cooling
Stage 3
Stage 2
St
age
1
x/L=0.0 x/L=0.25 x/L=0.5 x/L=0.75 x/L=1.0 average
Air temperature, oC.
The
dist
ance
from
the grain inlet,
m
Acknowledgements
The first and second authors are grateful to CNPq for research grants (process N313706/2009-3 e N475237/2009-9).
r e f e r e n c e s
Barrozo, M. A. S., Felipe, C. A. S., Sartori, D. J. M., & Freire, J. T. (2006). Quality of soybean seeds undergoing moving bed drying: countercurrent and crosscurrent flows.Drying Technology, 24, 415e422.
Barrozo, M. A. S., Henrique, H. M., Sartori, D. J. M., & Freire, J. T. (1999). Drying of soybean seeds in a crossflow moving bed.The Canadian Journal of Chemical Engineering, 77, 1121e1126.
Brooker, D. B., Bakker-Arkema, F. W., & Hall, C. W. (1982).Drying cereal grains. Westport, CT: AVI Publishing Co.
Courant, R., Friedrichs, K., & Lewy, H. (1967). On the partial difference equations of mathematical physics.IBM Journal of Research and Development, 11, 215e234.
Courtois, F., Lebert, A., Lasseran, J. C., & Bimbenet, J. J. (1991). Simulation of industrial dryers: solving numerical and computer problems.Drying Technology, 9(4), 927e945. Eltigani, A. Y., & Bakker-Arkema, F. W. (1987). Automatic control
of commercial crossflow grain dryers.Drying Technology, 5(4), 561e575.
Franc¸a, A. S., Fortes, M., & Haghighi, K. (1994). Numerical simulation of intermittent and continuous deep-bed drying of biological materials.Drying Technology, 12(7), 1537e1560. Giner, S. A., Mascheroni, R. H., & Nellist, M. E. (1996). Cross-flow
drying of wheat. A simulation program with a diffusion-based deep-bed model and a kinetic expression for viability loss estimations.Drying Technology, 14(7, 8), 1625e1672.
Han, F., Zuo, C. C., Zhu, H., Wu, W. F., & Liu, C. S. (2012). The establish of digital simulation system on continuous cross-flow dryer.Advanced Materials Research, 430e432,
1759e1763.
Jayas, D. S., Cenkowski, S., Pabis, S., & Muir, W. E. (1991). Review of thin-layer drying and wetting equations.Drying Technology, 9(3), 551e588.
Kemp, I. C. (1999). Progress in dryer selection techniques.Drying Technology, 17(7&8), 1667e1680.
Khatchatourian, O. A. (2012). Experimental study and mathematical model for soya bean drying in thin layer.
Biosystems Engineering, 113(1), 54e64.
Khatchatourian, O. A., & Oliveira, F. A. de (2006). Mathematical modelling of airflow and thermal state in large aerated grain storage.Biosystems Engineering, 95(2), 159e169.
Laws, N., & Parry, J. L. (1983). Mathematical modeling of heat and mass transfer in agricultural grain drying.Proceedings of the Royal Society of London, A385, 169e187.
Liu, Q., & Bakker-Arkema, F. W. (2001). Automatic control of crossflow grain dryers, Part 1: development of a process model.Journal of Agricultural Engineering Research, 80(1), 81e86. Luikov, A. V. (1966).Heat and mass transfer capillary-porous bodies.
New York: Pergamon.
MacCormack, R. W. (1969).The effect of viscosity in hypervelocity impact cratering. AIAA Paper, 69e354, Cincinati, Ohie. MacCormack, R. W. (1971).Numerical solutions of the interaction of a
shock wave with a laminar boundary layer. InLecture notes in physics(Vol. 8 (pp. 151e163). Springer-Verlag.
MacCormack, R. W., & Paullay, A. J. (1972).Computational efficiency achieved by time splitting of finite difference operators. AIAA Paper, 72e154, San Diego, California.
12 10 8 6 4 2 0
0.00 0.01 0.02 0.03 0.04 0.05
Grain
Ai
r o
u
tl
et
Air inle
t
Co
olin
g
Stage
3
Stage
2
S
tag
e 1
x/L=0.0 x/L=0.25 x/L=0.5 x/L=0.75 x/L=1.0 average
Air humidity, dec.
The distance from the
grain inlet, m
Fig. 16eDistribution of air humidity for the simulation 6 (Table 1) at a steady state.
12 10 8 6 4 2 0
0.00 0.01 0.02 0.03 0.04 0.05
Grain
Ai
r o
u
tl
et
Air inle
t
Co
olin
g
Stage
3
Stage
2
S
tag
e 1
x/L=0.0 x/L=0.25 x/L=0.5 x/L=0.75 x/L=1.0 average
Air humidity, dec.
The distance from the
grain inlet, m
Fig. 17eDistribution of air humidity for the outline design 5 (Fig. 2) at a steady state.
200 250 300 350 400
0.3 0.4 0.5 0.6 0.7 0.8 0.9
Energy Reduction, %
Average percentage of recycled air
, Design 3 (Fig. 2)
, Design 5 (Fig. 2)
Parameters variation, %
Heated furnace air temperature, oC
Marinos-Kouris, D., Maroulis, Z. B., & Kiranoudis, C. T. (1998). Modeling, simulation and design of convective industrial dryers.Drying Technology, 16(6), 993e1026.
Mayta, S. M. A., Massarani, G., & Pinto, J. C. (1996). Modeling of grain drying in continuous cross-flow sliding bed dryers.
Canadian Journal of Chemical Engineering, 74, 797e805. Moreira, R. G., & Bakker-Arkema, F. W. (1990). A feedforward/
feedback adaptive controller for commercial cross-flow grain driers.Journal of Agricultural Engineering Research, 45, 107e116. Parry, J. L. (1985). Mathematical modelling and computer simulation
of heat and mass transfer in agricultural grain drying: a review.
Journal of Agricultural Engineering Research, 32(1), 1e29.
Parti, M. (1993). Selection of mathematical models for drying grain in thin-layers.Journal of Agricultural Engineering Research, 54, 339e352.
Platt, D., Rumsey, T. R., & Palazoglu, A. (1991). Dynamics and control of cross-flow grain dryers. I. Model development and testing.Drying Technology, 9(1), 27e60.
Rumsey, T. R. (1986).Transient simulation of a cross flow rice dryer. ASAE, Paper No. 86-6906, St. Joseph, MI.
Rumsey, T. R., & Rovedo, C. O. (2001). Two-dimensional
simulation model for dynamic cross-flow rice drying.Chemical Engineering and Processing, 40(4), 355e362.
To´rrez, N., Gustafsson, M., Schreil, A., & Martı´nez, J. (1998). Modeling and simulation of a crossflow moving bed grain dryers.Drying Technology, 16, 1999e2015.
Zhihuai, M., & Chongwen, C. (1999). Simulation and