Brazilian Microwave and Optoelectronics Society-SBMO received 14 Feb 2013; revised 21 Feb 2013; accepted 21 Nov 2013 Brazilian Society of Electromagnetism-SBMag © 2013 SBMO/SBMag ISSN 2179-1074
Abstract—In this paper, Specific Absorption Rates (SAR) inside the
human head and hand have been analyzed for a handheld mobile phone operated at GSM 900 band. Both the head and hand are modeled electrically using Digital Imaging and Communication in Medicine (DICOM) formatted CT Scan voxel data considering the electrical parameters of different internal anatomical structures. Three-dimensional Finite Difference in Time Domain (FDTD) method has been used to simulate SAR induced in the head and hand. Maximum peak 1-g and 10-g SARs of 1.33 W/kg and 0.388 W/kg are found at antenna resonance frequency of 930 MHz for 0.6 W applied input power which are below the limits set by ANSI/IEEE and FCC, respectively.
Index Terms—FDTD, near-field, peak 1-g and 10-g SARs, DICOM data, CT
scan, human head and hand models.
I. INTRODUCTION
The effect of non ionizing radiation on human health has become one of the common areas of
interest for both technical and clinical researchers as a result of rapid growth in the use of mobile
phones throughout the world. Mobile phone users are exposed to significant amount of
electromagnetic (EM) energy radiated from the transmitting antennas and directly or mutually
coupled headsets and it is seen that absorption of EM waves in human head and other body parts
causes adverse biological effects [1]-[5]. Absorption of radio frequency (RF) fields emitted from the
mobile phone may change the proliferation rate of cells, enzyme activity and affect the genes in the
DNA of cells and may form tumor in living tissues [6]. It has also been reported that the opening of
the blood brain barrier due to low level EM radiation emitted from a mobile phone causes to release
the dangerous chemicals into the brain, leak hemoglobin and building up of which can cause heart
diseases and kidney stones [7].
The dose rate at which RF electromagnetic energy imparted into the human head and other body
parts is measured in terms of SAR. It is defined as the rate at which a person absorbs EM energy per
unit mass [8]. SAR is used to quantify biological adverse effects and formulating safety guidelines or
SAR Analysis for Handheld Mobile Phone
Using DICOM Based Voxel Model
Md. Faruk Ali
Department of Electronics and Instrumentation Engineering, Nazrul Centenary Polytechnic, Rupnarayanpur, Burdwan – 713 335, India
E-mail: [email protected]
Sudhabindu Ray
Department of Electronics and Telecommunication Engineering, Jadavpur University, Jadavpur, Kolkata – 700 032, India
Brazilian Microwave and Optoelectronics Society-SBMO received 14 Feb 2013; revised 21 Feb 2013; accepted 21 Nov 2013 Brazilian Society of Electromagnetism-SBMag © 2013 SBMO/SBMag ISSN 2179-1074 standards on exposure to RF fields [9]-[10]. For safety evaluation, SAR is averaged over a tissue
volume which is still not harmonized among the different countries and states [11]. SAR averaged
over X-g of tissue can be denoted by X-g SAR. In this way, local peak SAR averaged over 1-g of
tissue is called peak 1-g SAR. In USA, the SAR limit is specified as 1.6 W/kg, averaged over one
gram of tissue in the shape of a cube [9]-[10]. But in Europe and Japan, the SAR limits are specified
as 2.0 W/kg, averaged over any ten gram of tissue [12].
Direct measurement of SAR is very difficult inside a living human head or body parts using the
experimental technique. In the experimental method, actual phone with the equivalent homogeneous
head or other body parts are used in the measurement, but these homogeneous models are not a
faithful representation of the complex heterogeneous human organs because actual electrical
properties of different tissues are not considered. Therefore, the numerical techniques are used to
calculate EM field components and SAR inside human head or body parts [13]. To calculate SAR,
full wave electromagnetic numerical techniques like FDTD, Finite Element Method (FEM) or
Moment Method (MoM) are utilized to solve Maxwell’s equations in a heterogeneous electrical
model of human body parts. FDTD method [14] is one of the widely used techniques to simulate the
EM field distributions in complex three dimensional structures [15]-[20]. SAR induced in human head
model due to EM waves emitted from a dipole antenna in the frequency range of 900 MHz to 2.45
GHz is calculated through the FDTD method, and temperature rise in the model has been obtained by
substituting the SAR values into Penn’s bioheat equation [21].
In this work, variation of peak 1-g and 10-g SARs with distance has been studied using
three-dimensional FDTD method for a realistic human head model including hand consisting of eleven
types of tissues exposed to EM waves radiated from a mobile phone model designed for GSM 900
band (890 MHz – 960 MHz). Simulated peak 1-g and 10-g SARs have been compared with the
corresponding measured values for two typical commercial mobile phones working at GSM 900 band.
For all simulations the mobile phone is placed touching the head model holding with the right hand.
For all simulations in-house FDTD code is developed using commercially available MATLAB [22]
software. Commercially available FDTD based EM simulation software CST Microwave Studio
(MWS) [23] is used to validate the performance of in-house FDTD code.
II. MODEL AND METHOD FOR ANALYSIS
Numerical voxel-based computational models of biological structures are used in calculations for
electromagnetic interaction between electronic equipments such as mobile phones and biological
structures in the computer environment. Initially mathematical models of adults and children were
used for this purpose [24]-[25]. These models were represented by equations for planes, spheres,
cones, ellipsoids, elliptical cylinders or cylinders and do not conform to the shape of real anatomical
organs. Therefore, the voxel-based high resolution anatomical computational models are constructed
Brazilian Microwave and Optoelectronics Society-SBMO received 14 Feb 2013; revised 21 Feb 2013; accepted 21 Nov 2013 Brazilian Society of Electromagnetism-SBMag © 2013 SBMO/SBMag ISSN 2179-1074
A. DICOM File Format
In this study, voxel-based computational models for the human head and hand have been
constructed from DICOM files for SAR calculation. DICOM format is used extensively in CT, MR
and ultrasound devices and combines images and metadata to create a rich description of a medical
imaging procedure. Each DICOM file header contains a Service-Object Pair (SOP) instance related to
Information Object Definition (IOD) [28] which is useful for voxelization of scanned organ. The
voxel-based tomographic computational model can be constructed by stacking up the medical images
embedded within the DICOM files [29].
1) Construction of Voxel models using CT scan DICOM files
The header of the DICOM file used for modeling the human head is shown in the Table I [29]-[30].
The examination was performed with a CT machine (Philips). The data is stored as a 512 × 512 × 460
two-byte pixel array with slice thickness of 1.5000 mm and 0.7000 mm spacing between slices.
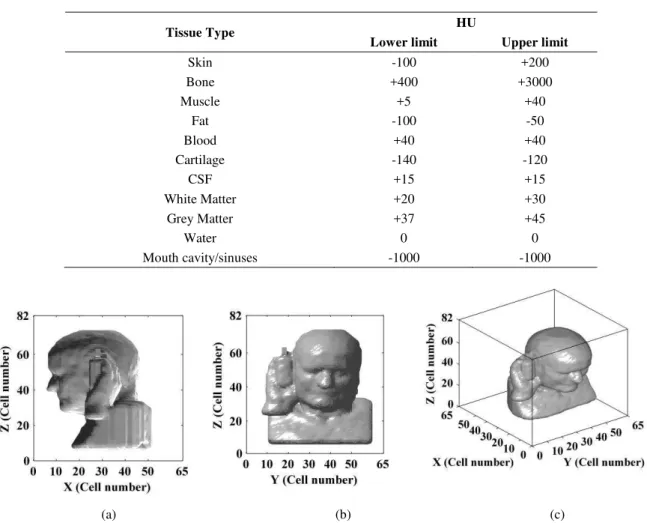
Original three-dimensional geometry of the human head model obtained from the DICOM files is
shown in the Fig. 1(a).
TABLE I.INFORMATION SAMPLES OBTAINED FROM HEADER OF DICOM FILE USED FOR HEAD MODEL
TABLE II.INFORMATION SAMPLES OBTAINED FROM HEADER OF DICOM FILE USED FOR HEAD MODEL
The header of the DICOM file, used for modeling the hand is shown in the Table II [29]-[30]. The
examination was performed with a CT machine (SIEMENS). The data is stored as a 512 × 512 × 134
two-byte pixel array with slice thickness of 2 mm and 0.7000 mm spacing between slices. Original
three-dimensional geometry of the hand model obtained from the DICOM files is shown in the Fig.
1(b).
Rows 512
Columns 512
Dimensions [512 512 460] Slice Thickness 1.5000 Spacing Between Slices 0.7000
Rescale Slope 1
Pixel Dimensions [0.4883 0.4883 0.7000] Rescale Intercept -1000
Rows 512
Columns 512
Dimensions [512 512 134] Slice Thickness 2 Spacing Between Slices 0.7000
Rescale Slope 1
Brazilian Microwave and Optoelectronics Society-SBMO received 14 Feb 2013; revised 21 Feb 2013; accepted 21 Nov 2013 Brazilian Society of Electromagnetism-SBMag © 2013 SBMO/SBMag ISSN 2179-1074
(a) (b) (c)
Fig. 1. Three-dimensional geometrical view of (a) human head, (b) hand and (c) mobile phone model.
2) Tissue Identification and Separation of Header from the DICOM files
Image pixel data is stored as the value of the pixel data element within the DICOM file in the form
of pixel cell. A pixel cell is the container for a pixel sample value and optionally additional bits. A
pixel cell exists for every individual pixel sample value in the pixel data. As the sample pixel cells are
encoded in byte streams so to construct voxel-based computational models the pixel cells are decoded
using in-house MATLAB program.
Pixels in an image obtained by CT scanning are displayed in terms of relative radiodensity.
Hounsefield scale proposed in 1972 by Godfrey Newbold Hounsefield is a quantitative measure of
radio-density [31]. The pixel corresponds to the mean radio attenuation by the tissue is represented on
a Hounsfield scale using a value from -1024 to +3071. Using a linear transformation, the pixel values
found in CT data can be converted in the Hounsefield Units (HU) [32]:
HU
pixel _ value slope
int ercept
(1)where, slopes and intercepts are obtained from the header.
Each different tissue has different of HU values and the pixels correspond to a particular tissue can
be identified and distinguished from pixels belonging to other tissues. HU used in the simulation
corresponding to the tissues are listed in the Table III [31]-[34]. Due to huge complexity of the human
head and hand, limitations of FDTD method and computational resources, many assumptions have
been made during the calculations of SAR. In this study, SAR has been calculated considering the
head and hand models are assumed to be consisted of only eleven types of tissues i.e., skin, bone,
Brazilian Microwave and Optoelectronics Society-SBMO received 14 Feb 2013; revised 21 Feb 2013; accepted 21 Nov 2013 Brazilian Society of Electromagnetism-SBMag © 2013 SBMO/SBMag ISSN 2179-1074
TABLE III. HU OF THE TISSUE USED FOR HEAD AND HAND MODELS
Tissue Type HU
Lower limit Upper limit
Skin -100 +200
Bone +400 +3000
Muscle +5 +40
Fat -100 -50
Blood +40 +40
Cartilage -140 -120
CSF +15 +15
White Matter +20 +30
Grey Matter +37 +45
Water 0 0
Mouth cavity/sinuses -1000 -1000
(a) (b) (c)
Fig. 2. (a) Sagittal plane, (b) coronal plane and (c) three-dimensional geometrical view of human head model along with hand and mobile phone.
3) Simulation Model
To simplify the numerical calculations raw data obtained from the DICOM files for both the head
and hand models has been processed using in-house MATLAB program. The metallic parts of the CT
machines as shown in Fig. 1(a) and (b) are discarded completely. Resolutions of the volume head and
hand are reduced by 10% and 20%, respectively. Excluding the left hand, the right hand is placed at
the side of the right ear of the head model holding the mobile phone.
Sagittal, coronal and three-dimensional geometry of the human head model along with the mobile phone holding with right hand used in the simulation are shown in Fig. 2 (a-c). Mass density (ρ), relative dielectric constant (εr) and conductivity (σ) of different tissues are obtained from the literature
[35]. Relative dielectric constant, conductivity, mass density and mass of one 4 mm × 4 mm × 5 mm
volume cell for different tissues are shown in Table IV. Frequency dependent εr and σ are determined
Brazilian Microwave and Optoelectronics Society-SBMO received 14 Feb 2013; revised 21 Feb 2013; accepted 21 Nov 2013 Brazilian Society of Electromagnetism-SBMag © 2013 SBMO/SBMag ISSN 2179-1074
TABLE IV. DIELECTRIC CONSTANT (εr), CONDUCTIVITY (σ) AND MASS DENSITY (ρ) OF THE HUMAN HEAD AND HAND TISSUES
Tissue Type Dielectric Constant (εr) [930 MHz]
Conductivity
σ (S/m) [930 MHz]
Mass density
ρ (kg/m3)
Mass of one cell (g)
Skin 48.0980 0.6657 1010 0.1263
Bone 13.2700 0.0869 1850 0.3313
Muscle 57.5960 0.7834 1040 0.1300
Fat 5.6000 0.0403 920 0.115
Blood 64.8200 1.3320 1060 0.1325
Cartilage 46.0430 0.5690 1100 0.1375
CSF 36.0650 0.4329 1040 0.1300
White Matter 42.8100 0.4290 1030 0.1287
Grey Matter 58.5500 0.7150 1050 0.1312
Water 78.00 1.59 1000 0.1250
Mouth cavity/sinuses 1.0000 0.0000 1.300 0.0002
B. Mobile Phone Model
The mobile phone used in the simulation consists of a monopole antenna made with aluminum
having length (L) of 4.0 cm and 5 mm × 5 mm cross sectional area placed on a metallic rectangular
box of dimension: 3.2 cm × 4.6 cm × 9.9 cm as shown in the Fig. 1(c). In this study, classical one-cell
gap model or delta gap model feeding used for thin-wire antenna has been applied in the design of the
mobile phone. H field components around the gap of the feeding point are given by [36]:
1/ 2 1/ 2
0
( , 1/ 2, 1/ 2) ( , 1/ 2, 1/ 2)
[{ ( , 1/ 2, 1) ( , 1/ 2, )} { ( , 1, 1/ 2) / }]
n n
x x
n n n n
y y z
H i j k H i j k
t
E i j k E i j k E i j k V
(2)
where, (i,j,k+1/2) is location of the gap and V is the input voltage as a function of time.
Frequency dependent reflection coefficient S11( f ) of the mobile phone is determined from the ratio
of the Discrete Fourier Transform (DFT) of incident and reflected waveforms [17]:
11 ref inc DFT E S f DFT E (3)where, Einc = incident electric field and Eref = reflected electric field.
S11 is computed in dB by:
11 20log10 11
S S (4)
C. FDTD Method
The simulation domain obtained using in-house MATLAB program containing head, hand and
mobile phone consists of 65×65×82 Yee cells with cell dimension of 4 mm × 4 mm × 5 mm is directly
exported in CST MWS to calculate the SAR of different resolutions induced inside the head and hand
models at 930 MHz. In CST MWS the computational domain is terminated with 4-layer
Generalized
Theory-based Perfectly Matched Layer (GTPML) with reflection factor of 0.0001.
D. Source Model
Brazilian Microwave and Optoelectronics Society-SBMO received 14 Feb 2013; revised 21 Feb 2013; accepted 21 Nov 2013 Brazilian Society of Electromagnetism-SBMag © 2013 SBMO/SBMag ISSN 2179-1074 antenna both in MATLAB and CST MWS. S11 has been obtained in MATLAB using equations (2-4)
and by placing the excitation at the gap of the monopole antenna and the box of the mobile phone
considering equivalent antenna input impedance of 50 Ω. But in CST MWS, S11 has been obtained
directly by using the Transient Solver and S-parameter type Discrete Edge Port input impedance of
50 Ω.
E. SAR Calculation
Commercially available software MATLAB and CST MWS have been used to calculate SAR
induced in the head and hand for a hand held mobile phone of applied input power 0.6 W [37]. During
calculation of SAR in MATLAB, a sinusoidal signal with amplitude V is applied as the excitation of
the mobile phone antenna. The value of V is obtained using the following equation:
4
a
V R P (5)
where, P = radiated power from the antenna (0.6 W), Ra = equivalent antenna input impedance (50 Ω), V = peak value of voltage.
In MATLAB when the simulation obtained steady-state condition then the local SAR at (i,j,k)th cell inside the head and hand is obtained from the following relation [20]:
2
2 2 2
ˆ
, , , ,
, ,
2 , ,
ˆ ˆ ˆ
, , , , , , , ,
2 , ,
x y z
i j k E i j k SAR i j k
i j k
i j k E i j k E i j k E i j k
i j k
(W/kg) (6)
where, Eˆx, Eˆyand Eˆz are the peak values of the electric-field components (V/m), σ = conductivity (S/m) and ρ = mass density of the head tissues (kg/m³).
In MATLAB, peak 1-g and 10-g SARs have been obtained considering irregular volume averages
[38]. In irregular volume averaging technique, peak 1-g SAR is obtained by finding the maximum
value of local SAR in an FDTD cell and then finding the neighbor cell with next higher local SAR,
and so on.The process is repeated until total mass of the FDTD cells becomes equal to the required
mass of 1-g. Similarly peak 10-g SAR is calculated.
In CST MWS, SAR is calculated as a post-processing step after the simulation setting the power
loss density monitor to calculate the SAR values and fields [23]. It is also recommended to use the
FPBA mesh type for SAR simulations. For the local SAR calculation, specify the mass in gram over
which the SAR should be averaged. Typical values are 1-g or 10-g. Applied input power of the mobile
phone antenna is rescaled using the SAR Special Settings Dialog Box option.
III. RESULTS
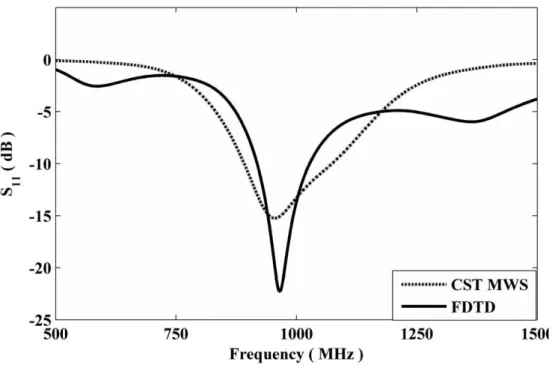
Return loss of the mobile phone is computed using the MATLAB program
and compared that
Brazilian Microwave and Optoelectronics Society-SBMO received 14 Feb 2013; revised 21 Feb 2013; accepted 21 Nov 2013 Brazilian Society of Electromagnetism-SBMag © 2013 SBMO/SBMag ISSN 2179-1074 computed using MATLAB and CST
MWS
are shown in Fig. 3. Nature of variation of S11 obtainedusing in-house FDTD based MATLAB program follows closely with that obtained using CST MWS.
For both the cases, at the fundamental mode, the antenna of the mobile phone antenna resonates at
930 MHz and the value of S11 remains below –10 dB within GSM 900 band. Value of S11 at the
fundamental resonance frequency obtained by the MATLAB program and CST MWS are –22 dB and
–15 dB, respectively.
Fig. 3. Variation of S11 vs. Frequency of the mobile phone placed in free space.
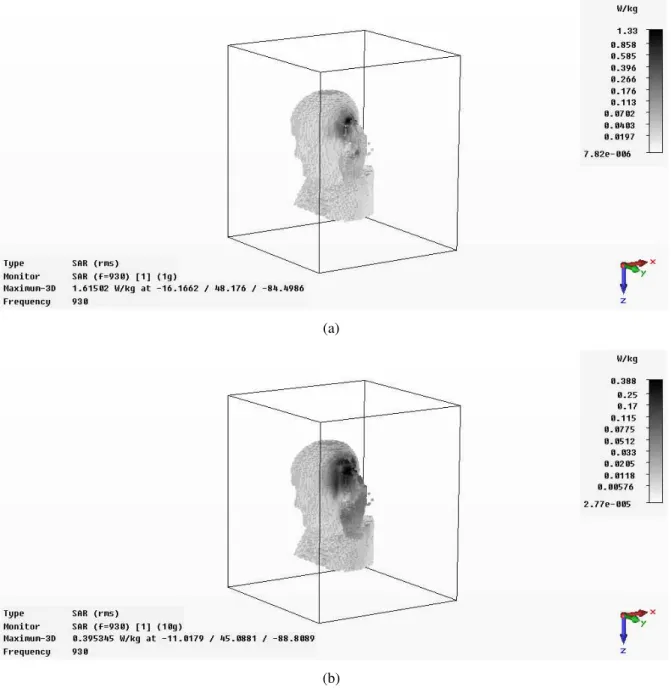
Finishing return loss calculation, head model along the handheld mobile phone is simulated for
SAR calculation at 930 MHz which is fundamental mode resonance frequency of the mobile antenna.
Three-dimensional 1-g and 10-g SAR distributions inside the human head model including hand
model at 930 MHz obtained by CST MWS are shown in the Fig. 4 (a-b). Higher value of 1-g and 10-g
SAR are found in the vicinity of the mobile phone antenna and their value decreases periodically with
continuous decrease in the average level for the increase of distance from the mobile phone antenna
and vice-versa.
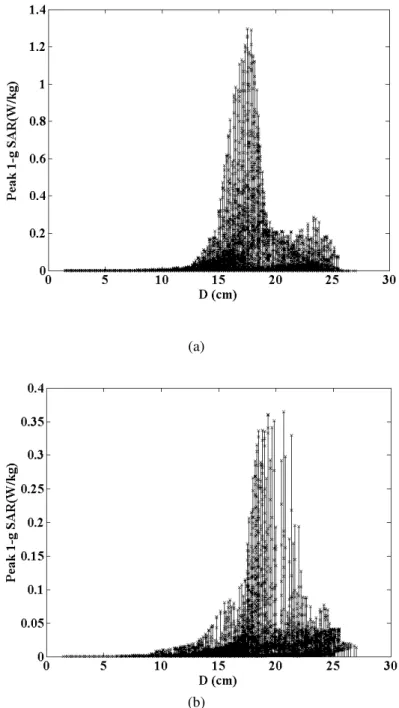
Variations of peak 1-g and 10-g SARs with distance D measured along Y-axis in the mid-coronal
plane at 930 MHz obtained using CST MWS are shown in Figs. 5 (a-b). The stem plots of peak gram
averaged SAR vs. D contain a number of hotspots. From the Figs. 5 (a-b), it is seen that the density of
the hotspots decreases with increase of SAR value and vice-versa. Only one hotspot is found
corresponding to each maximum peak 1-g and 10-g SAR with the value of 1.33 W/kg and 0.38 W/kg
Brazilian Microwave and Optoelectronics Society-SBMO received 14 Feb 2013; revised 21 Feb 2013; accepted 21 Nov 2013 Brazilian Society of Electromagnetism-SBMag © 2013 SBMO/SBMag ISSN 2179-1074
(a)
(b)
Fig. 4. Three-dimensional (a) 1-g and (b) 10-g SAR distributions inside the human head model using CST MWS.
Maximum value of peak 1-g and 10-g SARs for different type of tissues at 930 MHz obtained using
MATLAB are listed in the Table V. From the table, it is seen that maximum peak 1-g and 10-g SARs
obtained in skin are 1.3238 W/kg and 0.3882 W/kg respectively. The minimum peak 1-g and 10-g
SARs obtained in CSF are 0.0084 W/kg and 0.0014 W/kg respectively. Mouth or sinuses cavities are
Brazilian Microwave and Optoelectronics Society-SBMO received 14 Feb 2013; revised 21 Feb 2013; accepted 21 Nov 2013 Brazilian Society of Electromagnetism-SBMag © 2013 SBMO/SBMag ISSN 2179-1074
(a)
(b)
Fig. 5. Variations of Peak (a) 1-g and (b) 10-g SARs vs. D at 930 MHz.
TABLE V. PEAK ONE AND TEN GRAM SAR INDUCED IN THE HUMAN HEAD AND HAND TISSUES AT 930 MHZ
Tissue Type Peak 1-g SAR (W/kg) Peak 10-g SAR (W/kg)
Skin 1.3238 0.3882
Bone 0.0168 0.0028
Muscle 0.7803 0.1323
Fat 0.0176 0.0029
Blood 0.0465 0.0078
Cartilage 1.0512 0.1783
CSF 0.0084 0.0014
White Matter 0.0779 0.0132
Grey Matter 0.0503 0.0085
Water 0.0339 0.0057
Brazilian Microwave and Optoelectronics Society-SBMO received 14 Feb 2013; revised 21 Feb 2013; accepted 21 Nov 2013 Brazilian Society of Electromagnetism-SBMag © 2013 SBMO/SBMag ISSN 2179-1074 Measured values of peak 1-g and 10-g SAR at GSM 900 band for a typical commercial handheld
mobile phone have been obtained from the literature [39]. Comparison between the available
measured and simulated values of the gram averaged SARs are shown in the Table VI. From the table,
it is observed that the peak 1-g and 10-g SARs obtained by simulation are close to each other and
lower than the corresponding Measured values within the ANSI/IEEE and FCC safety limits. The
differences between simulated and measured data obtained are possibly due to the head and antenna
model differences.
TABLE VI. COMPARISION OF SIMULATED SAR WITH MEASURED SAR
SAR Simulated Measured
Peak 1-g SAR (W/kg) 1.3238 1.41
Peak 10-g SAR (W/kg) 0.3882 0.96
IV. CONCLUSION
In this work SAR distributions and peak SAR averaged over 1-g and 10-g mass of head and hand
tissue induced inside the DICOM data based human head and hand models consisting of eleven types
of tissues exposed to a mobile phone designed for GSM 900 band (890-960 MHZ) have been studied
using FDTD method without considering modulation type or duty cycle of mobile communication
systems. Calculation of SAR has been performed using commercially available software MATLAB
and CST MWS. At 930 MHz, variation of peak 1-g and 10-g SARs with distance shows that both
peak 1-g and 10-g SAR value attain to maxima near the position of the mobile phone antenna and
decreases gradually with increase of the distance from the mobile phone antenna. Results obtained by
the simulation show that maximum peak 1-g and 10-g SARs obtained in skin are 1.3238 W/kg and
0.3882 W/kg respectively whereas the minimum peak 1-g and 10-g SARs obtained in CSF are 0.0084
W/kg and 0.0014 W/kg respectively for 0.6 W antenna input power. Variations of peak 1-g and 10-g
SARs with distance D measured along Y-axis in the mid-coronal plane at 930 MHz obtained using
CST MWS are observed. The stem plots of peak gram averaged SAR vs. D contain a number of
hotspots and it is seen that the density of the hotspots decreases with increase of SAR value and
vice-versa.
Simulated peak 1-g and 10-g SARs for human head with hand held mobile is compared with
measured SARs available in the literature and it is observed that obtained simulated and measured
SAR values are close to each other and lower than the corresponding measured values within the
ANSI/IEEE and FCC safety limits.
REFERENCES
[1] James C. Lin, “Mental process in humans and exposure to cell-phone radiation,” IEEE Microwave Magazine, vol. 5, pp. 26-30, December-2004.
[2] James C. Lin, “Malignant brain tumors from cellular mobile telephone radiation,” IEEE Antenna and Propagation Magazine, vol. 49, No. 1, pp. 212-214, February-2007.
Brazilian Microwave and Optoelectronics Society-SBMO received 14 Feb 2013; revised 21 Feb 2013; accepted 21 Nov 2013 Brazilian Society of Electromagnetism-SBMag © 2013 SBMO/SBMag ISSN 2179-1074 [4] Harish, Sarah, “Now Mobiles Give You Kidney Damage,” Daily Mail, December 13, 1999. EPI1812.
[5] Electromagnetic Fields and Public Health, World Health Organization. https://apps.who.int/inf-fs/en/fact183.html. [6] T. Takebayashi, N. Varsier, and Y. Kikuchi, “Mobile phone use, exposure to radiofrequency electromagnetic field, and
brain tumour: a case control study. Br J Cancer: 98, pp. 652-659, 2008.
[7] Svenska Dagbladet, “Microwaves open up Blood Brain Barrier,” September 15, 1999. EPI1829.
[8] H. Shabani, Md. R. Islam, AHM Z. Alam and H. E. Abd EI-Raouf, “EM Radiation from Wi-LAN Base Station and Its’ Effects in Human Body,” 5th International Conference on Electrical and Computer Engineering 2008, Dhaka, Bangladesh, pp. 86-91.
[9] American National Standard – Safety Levels with Respect to Exposure to Radio Frequency Electromagnetic Fields, 3 kHz to 300 GHz, ANSI/ IEEE C95.1 - 1992.
[10]Federal Communication Commission (FCC), Home Page. http://www.fcc.gov.
[11]International Commission on non-Ionizing Radiation Protection, “ICNIRP statement-Health issues related to the use of hand –held radiotelephones and base transmitters,” Health Phys., vol. 70, no. 4, pp. 587-593, April-1996.
[12]J. Wang and O. Fujiwara, “Numerical and Experimental Evaluation of Dosimetry in the Human Head for Portable telephones,” IEICE Trans. Commun., vol. J84-B, No. 1, pp. 1-10, 2001.
[13]J. M. Osepchuk and R. C. Petersen, “Safety Standards for Exposure to RF Electromagnetic Fields,” IEEE, Microwave Magazine, vol. 2, pp. 55-69, June-2001.
[14]S. Schmidt, “Finite-difference time-domain methods for electromagnetic problems involving biological bodies," Doctoral thesis, 2005.
[15]D. G. Choi, C. S. Shin, N. K. Kim and H. S. Shin, “Design and SAR analysis of Broadband PIFA with Triple Band,” Progress in Electromagnetics Research symposium 2005, Hangzhur, China, pp.22 – 26, August-2005.
[16]Md. Faruk Ali and Sudhabindu Ray, “SAR Analysis on Human Head Exposed to Radiating Dipole Antenna for 500 MHz – 5 GHz Frequency Band Using FDTD method,” National Conference on Communications, IIT Bombay, India, pp.481-485, 2008.
[17]Md. Faruk Ali and Sudhabindu Ray, “SAR Analysis in a Spherical Inhomogeneous Human Head Model Exposed to Radiating Dipole Antenna for 500 MHz – 3 GHz Using FDTD method”, International Journal of Microwave and Optical Technology, Vol. 4, No. 1, pp.35-40, January - 2009.
[18]N. Homsup and W. Homsup, “FDTD Simulation of a Mobile Phone Operating Near a Metal Wall,” Journal of Computers, vol. 4, No. 2, February 2009.
[19]M.Okoniewski, E.Okoniewski and M.A.Stuchly, “A Study of the Handset Antenna and Human Body Interaction,” IEEE Trans. Microwave Theory Tech., vol. MTT – 44. No.10, pp.1855-1864, October-1996.
[20]O. P. Gandhi, Gianluca Lazzi and Cynthia M. Furse, “Electromagnetic Absorption in the Human Head and Neck for Mobile Telephones at 835 and 1900 MHz,” IEEE Trans. Microwave Theory Tech., vol. MTT – 44. No.10, pp.1884-1897, October-1996.
[21]A. Hirata, M. Morita and T. Shiozawa, “Temperature increase in the human head due to a dipole antenna at microwave frequencies,” IEEE Trans. Electromagnetic Compatibility, Vol. 45, pp. 109-116, February-2003.
[22]Matlab 7.8, The MathWorks, Inc. http://www.mathworks.com. [23]CST Microwave Studio Suite 2010, http://www.cst.com.
[24]H. L. Fisher, W. S. Snyder, Annual progress report for period ending July 31 1966, Health Physics Division, Oak Ridge National Laboratory, Oak Ridge TN, USA, 1966.
[25]J. M. L. Hwang, R. L. Shoup, J. W. Poston, Mathematical description of a one- and five-year-old child for use in dosimetry calculations, Oak Ridge National Laboratory, Oak Ridge TN, USA, 1976.
[26]W. L. Chen, J. W. Poston, G. G. Warner, An evaluation of the distribution of absorbed dose in child phantoms exposed to diagnostic medical X rays, Oak Ridge National Laboratory, Oak Ridge TN, USA, 1978.
[27]M. Cristy, Mathematical phantoms representing children of various ages for use in estimates of internal dose, Oak Ridge National Laboratory, Oak Ridge TN, USA, 1980.
[28]Rumen Rusev, “A Module for Visualisation and Analysis of Digital Images in DICOM File Format,” International Conference on Computer Systems and Technologies-CompSysTech’2003.
[29]The Matlab Central File Exchange, available at:
http://www.mathworks.com/matlabcentral/fileexchange/loadFile.do?objectId=4879&objectType=file.
[30]T. M. Nassef, M. Alkhodary, M. K. Marei, N. H. Solouma and Y. M. Kadah, “Extraction of human Mandible bones from multi-slice Tomographic data,” pp. 260-263, MECBME, February-2011.
[31]J. C. Higgins and J. M. Fitzgerald, “Evaluation of Incidental Renal and Adrenal Masses, American Family,” Vol. 63, No. 2, pp. 228-295, January-2001.
[32]U. Schneider E. Pedroni and A. Lomax, “The calibration of CT Hounsfield units for radiotherapy treatment planning,” Phys. Med. Biol. 1996; 41:111-124.
[33]D. C. Dias Medora and N. E. Prashant, "Morphometric Study of the Ventricular System of Brain by Computerized Tomography," Journal of the Anatomical Society of India, Vol. 56, No. 1 (2007-01 - 2007-06).
[34]F. Terrier, M.Grossholz and C. D. Becker, “Spiral CT of the Abdomen,” Medical Radiology, Springer, 1999.
[35]Dielectric Properties of the Human Body tissue in the Frequency Range of 10 Hz-100GHz. http://www.niremf.iroe.fi.cnr.it/tissprop.
[36]N. Stevens and T. Masao, “An Improved FDTD Model for the Feeding Gap of a Thin-Wire Antenna,” IEEE Microwave and Guided Wave Letters. vol.– 8. No.4, pp.152-154, April-1998.
Brazilian Microwave and Optoelectronics Society-SBMO received 14 Feb 2013; revised 21 Feb 2013; accepted 21 Nov 2013 Brazilian Society of Electromagnetism-SBMag © 2013 SBMO/SBMag ISSN 2179-1074 [38]S. Watanabe and L. Martens, “Comparison of Averaging Procedures for SAR Distributions at 900 and 1800 MHz,”
IEEE Trans. Microwave Theory Tech., vol. MTT – 48. No.11, pp.2180-2184, November-2000.