AMTD
8, 9713–9730, 2015A broad supersaturation scanning (BS2) CCN
counter
H. Su et al.
Title Page
Abstract Introduction
Conclusions References
Tables Figures
◭ ◮
◭ ◮
Back Close
Full Screen / Esc
Printer-friendly Version Interactive Discussion
Discussion
P
a
per
|
Discussion
P
a
per
|
Discussion
P
a
per
|
Discussion
P
a
per
|
Atmos. Meas. Tech. Discuss., 8, 9713–9730, 2015 www.atmos-meas-tech-discuss.net/8/9713/2015/ doi:10.5194/amtd-8-9713-2015
© Author(s) 2015. CC Attribution 3.0 License.
This discussion paper is/has been under review for the journal Atmospheric Measurement Techniques (AMT). Please refer to the corresponding final paper in AMT if available.
A broad supersaturation scanning (BS2)
approach for rapid measurement of
aerosol particle hygroscopicity and cloud
condensation nuclei activity
H. Su1, Y. Cheng1, N. Ma2, Z. Wang1, X. Wang1, M. Pöhlker1, B. Nillius1, A. Wiedensohler2, and U. Pöschl1
1
Multiphase Chemistry Department, Max Planck Institute for Chemistry, Mainz 55020, Germany
2
Leibniz-Institute for Tropospheric Research, Leipzig 04318, Germany
Received: 21 July 2015 – Accepted: 20 August 2015 – Published: 17 September 2015
Correspondence to: Y. Cheng (yafang.cheng@mpic.de)
Published by Copernicus Publications on behalf of the European Geosciences Union.
AMTD
8, 9713–9730, 2015A broad supersaturation scanning (BS2) CCN
counter
H. Su et al.
Title Page
Abstract Introduction
Conclusions References
Tables Figures
◭ ◮
◭ ◮
Back Close
Full Screen / Esc
Printer-friendly Version Interactive Discussion
Discussion
P
a
per
|
Discussion
P
a
per
|
Discussion
P
a
per
|
Discussion
P
a
per
|
Abstract
The activation and hygroscopicity of cloud condensation nuclei (CCN) are key to un-derstand aerosol–cloud interactions and their climate impact. It can be measured by scanning the particle size and supersaturation in CCN measurements. The scanning of supersaturation is often time-consuming and limits the temporal resolution and
per-5
formance of CCN measurements. Here we present a new approach, termed broad supersaturation scanning (BS2) method, in which a range of supersaturation is simul-taneously scanned reducing the time interval between different supersaturation scans. The practical applicability of the BS2 approach is demonstrated with nano-CCN mea-surements of laboratory-generated aerosol particles. Model simulations show that the
10
BS2 approach is also applicable for measuring CCN activation of ambient mixed parti-cles. Due to its fast response and technical simplicity, the BS2 approach may be well suited for long-term measurements. Since hygroscopicity is closely related to the frac-tion of organics/inorganics in aerosol particles, a BS2-CCN counter can also serve as a complementary sensor for fast detection/estimation of aerosol chemical
composi-15
tions.
1 Introduction
Aerosol particles serving as cloud condensation nuclei (CCN) influence the cloud for-mation process and play an important role in regulating the radiative budge of the earth system (Pruppacher and Klett, 1997). The abundance of CCN is one of the key
pre-20
requisites for better understanding and assessment of aerosol–cloud interactions and its climate effect. To predict CCN concentrations, knowledge about the aerosol size distribution and CCN activities (hygroscopicity) is required.
The CCN activities can be determined by the size-resolved CCN measurements in which both dry particle diameter (Dd) and supersaturation (S) are scanned. Based on
AMTD
8, 9713–9730, 2015A broad supersaturation scanning (BS2) CCN
counter
H. Su et al.
Title Page
Abstract Introduction
Conclusions References
Tables Figures
◭ ◮
◭ ◮
Back Close
Full Screen / Esc
Printer-friendly Version Interactive Discussion
Discussion
P
a
per
|
Discussion
P
a
per
|
Discussion
P
a
per
|
Discussion
P
a
per
|
such measurements, the CCN activity parameter (e.g.,κ) can be determined by the corresponding Köhler equation (Köhler, 1936; Petters and Kreidenweis, 2007).
Fast scan ofS is important for measurements of ambient CCN with high temporal variability. The DMT (Droplet Measurement Technologies) CCN counter (CCNC) is one of the most commonly used CCNC nowadays (Roberts and Nenes, 2005). The change
5
of S in this type of CCNC can be achieved by changing the thermal-gradient in the activation tube. This approach requires a waiting time of a few minutes to stabilize the newly designatedSwhich largely reduces the time-resolution ofSscan. Due to the low time-resolution, CCN activities are normally measured at only a fewS to account for the temporal variability of ambient aerosol particles (Gunthe et al., 2011; Rose et al.,
10
2011). To increase the time-resolution of S scan, the Scanning Flow CCN Analysis (SFCA) was developed in whichS was continuously adjusted by changing the flow rate in the activation tube (Moore and Nenes, 2009). SFCA makes possible the rapid and continuous measurement ofS spectra, with a time resolution of∼10–60 s. Fast scan
of S has also been achieved for other designs of CCNC in the work of Fukuta and
15
Saxena (1979) and Hudson (1989).
This study presents a new approach, termed broad supersaturation scanning (BS2) methods, which measures the activation of CCN simultaneously over a continuous range ofS and reduces the time required forS scan to infinitely small. This enables the fast determination ofκ, which is useful for both CCN modeling/prediction and
es-20
timation of aerosol chemical compositions (Wang et al., 2015). Besides advances in the time-resolution, BS2-CCNC may be built with simple modifications of existing DMT-CCNC. In addition, both temperature gradient and flow rate are kept constant during the measurements, minimizing the potential problem of aerosol volatilization and technical complexity (Moore and Nenes, 2009).
25
AMTD
8, 9713–9730, 2015A broad supersaturation scanning (BS2) CCN
counter
H. Su et al.
Title Page
Abstract Introduction
Conclusions References
Tables Figures
◭ ◮
◭ ◮
Back Close
Full Screen / Esc
Printer-friendly Version Interactive Discussion
Discussion
P
a
per
|
Discussion
P
a
per
|
Discussion
P
a
per
|
Discussion
P
a
per
|
2 Methodology
2.1 Concept of BS2 approach
For easy understanding, we introduce the BS2 method in comparison with previous designs and applications of DMT-CCNC. Figure 1a shows a typical distribution of su-persaturation in the activation tube of DMT-CCNC, denoted asStube.Stubeis a function
5
ofr, the radial distance to the centerline of the activation unit. The highest Stube
ap-pears in the centerline and drops to 0 near the wall. Note thatStube in the activation
tube also has an axial dependence (Roberts and Nenes, 2005), here we simply use
Stubeto represent the maximumS in the axial direction at a givenr.
Figure 1a and b shows regular applications of DMT-CCNC, in which aerosol
parti-10
cles are focused on the centerline by a narrow aerosol inlet and laminar sheath flow. Such application ensures that aerosol particles are exposed to a single Stube at the
centerline (Fig. 1b). Then depending on the values ofStube andSaerosol (the critical
ac-tivation supersaturation of aerosol particles), the acac-tivation fractionFactcan be either 0
(Saerosol> Stube) or 1 (Saerosol< Stube).
15
Figure 1c shows the dependence ofFactonSaerosolin a singleSscan (i.e., with given
Stube). It is clear that theFactvalue (0 or 1) measured in a singleSscan is not sufficient
to determineSaerosol(because it corresponds to infinite values ofSaerosol). To determine
the exactSaerosol, multipleS scans (i.e., scanning differentStube) are required untilFact
changes from 0 to 1. The interval ofStubescans determines the uncertainty ofSaerosol.
20
When the adjustment ofStubeis slow, only a fewStubecan be scanned leading to a large
Stubeinterval and uncertainties in the derivedSaerosol. That is why we need a fastSscan
approach such as BS2 or SFCA.
In the BS2 approach, we make use of the wholeS distribution inside the activation chamber. Instead of being focused at the centerline, the measured aerosol particles are
25
AMTD
8, 9713–9730, 2015A broad supersaturation scanning (BS2) CCN
counter
H. Su et al.
Title Page
Abstract Introduction
Conclusions References
Tables Figures
◭ ◮
◭ ◮
Back Close
Full Screen / Esc
Printer-friendly Version Interactive Discussion
Discussion
P
a
per
|
Discussion
P
a
per
|
Discussion
P
a
per
|
Discussion
P
a
per
|
with the sameSaerosol, the total activation fraction,Fact, can be calculated by integrating
the activation fraction functiong(x) over the cross section of the aerosol flow, i.e., from the center (r =0) to the edge of the aerosol flow,
Fact=
2πRr
0g(Saerosol−Stube)rdr
2πRr
0rdr
, in whichg(x)=
(
1 ifx≤0
0 ifx >0 (1)
Figure 2c shows the dependence ofFact onSaerosol for a BS2 measurement based on
5
theStubedistribution in Fig. 2b. Such monotonic dependence suggests thatSaerosolcan
be directly determined onceFactis measured. For a givenStubeprofile, we have a fixed
Fact–Saerosol relation (Fig. 2c), which can be determined with calibration aerosols
(Sec-tion. 2.2). The upper limit of measurableSaerosol by BS2 equals the maximumStube on
the centerline, while ideally the lower limit can be zero depending on the width of the
10
aerosol flow in relevance to the activation tube (Fig. 2a). For size-resolved measure-ments, we can calculate the corresponding hygroscopicity parameter κ of aerosols particles fromSaerosol and the particle diameterDdby (Petters and Kreidenweis, 2007; Su et al., 2010)
κ≈ 4A
3
27(ln(Saerosol/100 %+1))2D 3 d
withA=4σsolMw
RT ρw
(2)
15
in whichσsol is the surface tension of water,Mw is the molar mass of water,R is the
gas constant,T is the temperature in Kelvin, andρwis the density of liquid water.
2.2 Calibration
For the BS2 calibration, the goal is to determine the monotonicFact–Saerosol relation as
shown in Fig. 2c. This can be achieved by performing size-resolved measurements of
20
pure calibration aerosols with known hygroscopic properties, e.g., ammonium sulfate aerosol particles. EachDd corresponds to a specificSaerosol (Eq. 3), and by recording
AMTD
8, 9713–9730, 2015A broad supersaturation scanning (BS2) CCN
counter
H. Su et al.
Title Page
Abstract Introduction
Conclusions References
Tables Figures
◭ ◮
◭ ◮
Back Close
Full Screen / Esc
Printer-friendly Version Interactive Discussion
Discussion
P
a
per
|
Discussion
P
a
per
|
Discussion
P
a
per
|
Discussion
P
a
per
|
the correspondingFact, we get the calibration curve ofFact–Saerosolrelation.
Saerosol≈100 %·
exp
v u u t
4A3
27κDd3
−1
(3)
2.3 Application
The first step for the BS2 measurement is to select properSmax, the maximumStube
in the centerline of the activation unit.Smax should be higher than the highestSaerosol
5
of investigated aerosol particles. Given the range of particle size andκ,Smax can be
estimated from Eq. (3). An example is given in Fig. S1 in the Supplement to illustrate the relationship betweenS,κ and Dd. The adjustment ofSmax can be done by changing
the temperature gradient of the tube (Roberts and Nenes, 2005; Rose et al., 2008; Wang et al., 2015).
10
Once a proper temperature gradient is selected, we can perform size-resolved CCN measurements with BS2 analysis and record the BS2 activation spectra, i.e. the activa-tion fracactiva-tionFact as a function of the dry particle diameterDd. Based on the calibration curve (i.e.,Fact–Saerosol relation), we can calculate the size-resolvedSaerosol as well as
κ(by Eq. 2). Figure 3 shows the size-resolvedFact–κrelation for aStubeprofile as given
15
in Fig. 2b.
3 Results and discussion
3.1 Imperfect internally mixed aerosol with a singleκmode
For aerosol particles of the same composition (pure compounds or perfectly internally mixed compounds), itsSaerosolandκvalues can be readily determined as described in
20
AMTD
8, 9713–9730, 2015A broad supersaturation scanning (BS2) CCN
counter
H. Su et al.
Title Page
Abstract Introduction
Conclusions References
Tables Figures
◭ ◮
◭ ◮
Back Close
Full Screen / Esc
Printer-friendly Version Interactive Discussion
Discussion
P
a
per
|
Discussion
P
a
per
|
Discussion
P
a
per
|
Discussion
P
a
per
|
2007; Su et al., 2010; Gunthe et al., 2011). In this section and Sect 3.2, we will discuss the application of BS2 approach in ambient measurements.
Most CCN and HTDMA (hygroscopicity tandem differential mobility analyser) mea-surements show that ambient aerosol particles often have a near single lognormally distributedκmode especially at the clean and background sites (Su et al., 2010). Here
5
we assume that the investigated aerosol particles have a lognormalκdistribution with a geometric meanκof 0.3. Since the broadening ofκ distribution is a major difference between pure and ambient aerosol particles, we take a series of broadening factor, i.e. the geometric standard deviationsσκ of theκ distribution for further discussion of the BS2 application.
10
As shown in Fig. 4, for aerosols with a singleκvalue (σκ =1), we can get the same
κvalue of 0.3. For aerosols with a broadκdistribution, the retrievedκdepends onFact.
WhenFact>0.2, the retrievedκ is very close to their geometric mean value with a
rel-ative difference of <5 %. When Fact<0.2, the retrieved κ can be largely biased from
the geometric mean. The reason for this is as follows. Since Fact shows a monotonic
15
dependence onκ, aκdistribution will in fact result in aFact distribution. Then the
influ-ence of high and lowFact will largely cancel out leading to a κ close to the geometric
mean value. WhenFact is close to zero, the influence becomes asymmetric (because
Fact of the less hygroscopic aerosols cannot be smaller than zero). Then the effect of
more hygroscopic aerosols dominates the signal resulting in a much higher retrieved
20
κ. In such a case, we may increase theSmaxto ensureFact>0.2.
3.2 Externally mixed aerosols with twoκmodes
At clean and background sites, most CCN and HTDMA measurements show a singleκ
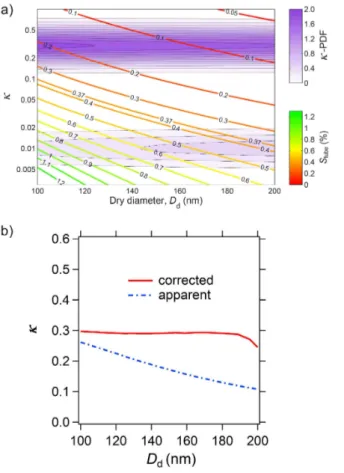
mode. During biomass burning events, another less hygroscopic mode often appears at size range ofDd>100 nm (Rose et al., 2011). In Fig. 5a, we assume that aerosols
25
have two lognormally distributedκ modes with mode κ of 0.3 and 0.01 (Rose et al., 2011). The number fractions of the two modes (denoted as aκ0.3 and aκ0.01) are
AMTD
8, 9713–9730, 2015A broad supersaturation scanning (BS2) CCN
counter
H. Su et al.
Title Page
Abstract Introduction
Conclusions References
Tables Figures
◭ ◮
◭ ◮
Back Close
Full Screen / Esc
Printer-friendly Version Interactive Discussion
Discussion
P
a
per
|
Discussion
P
a
per
|
Discussion
P
a
per
|
Discussion
P
a
per
|
dependent at 100–200 nm size range (Rose et al., 2011),
aκ0.01 =0.3×log10(Dd/30) and aκ0.01 =1−aκ0.3 (4)
in which the unit ofDdis nanometer.
Figure 5b shows the modeled result for measurements with a BS2 approach (labeled as “apparent”). The retrieved κ varies from 0.11 to 0.26, which lies between the κ
5
values of the two modes (i.e., 0.01 and 0.3). This is because the measured activation fractionFactis an average of individual modes weighted by their number fraction
Fact=aκ0.3×Fact,κ0.3+aκ0.01×Fact,κ0.01=(1−aκ0.01)×Fact,κ0.3+aκ0.01×Fact,κ0.01 (5)
The retrieved κ (∼0.11 to 0.26) follows the change of the geometric mean values (∼0.11 to 0.18) and represent certain kinds of weighted average of the twoκ modes.
10
This result suggests that the BS2-CCNC alone cannot be used to resolve multi-mode structure ofκ distribution.
To resolve the dual κ-mode or multiple κ-mode, we need to decouple the mixed information in Eq. (5) and extract the signal of each mode (i.e.,Fact,κ0.3 orFact,κ0.01) by combining BS2-CCNC with other complimentary techniques. The idea here is (1) to use
15
a DMT-CCNC to determineaκ0.01; and (2) to choose aSmaxof BS2-CCNC low enough
so thatFact,κ0.01=0. In such a way, we can solve Fact,κ0.3 from Eq. (5) and determine
κ of the more hygroscopic mode. In the 100 to 200 nm size range, for example, the two hygroscopic modes aforementioned can be separated by settingS of DMT-CCNC around 0.37 % (Fig. 5a) and set Smax and Stube profile of BS-CCNC the same as in
20
Fig. 2b.
Figure 5b shows that we are able to resolve the mean κ of the more hygroscopic mode (labeled as “corrected”) with such combination of measurements.κ of the less hygroscopic mode can be resolved with a similar approach, in which we run in parallel a DMT-CCNC withS of 0.37 % and a BS-CCNC with higherSmax(∼1.5 %) andSmin∼
25
0.37 %. The adjustment of Smin can be done by changing the width of the aerosol
AMTD
8, 9713–9730, 2015A broad supersaturation scanning (BS2) CCN
counter
H. Su et al.
Title Page
Abstract Introduction
Conclusions References
Tables Figures
◭ ◮
◭ ◮
Back Close
Full Screen / Esc
Printer-friendly Version Interactive Discussion
Discussion
P
a
per
|
Discussion
P
a
per
|
Discussion
P
a
per
|
Discussion
P
a
per
|
Figure 5b also shows a relatively large deviation of retrievedκwhenDdapproaches
200 nm. This is due to the imperfect separation of the two hygroscopic modes by DMT-CCNC. As shown in Fig. 5a, the activationS drops asDdincreases. ForDd∼200 nm,
a S of 0.37 % becomes so high that even aerosol particles in the less hygroscopic mode will be activated. This leads to an overestimate of activation fraction of the more
5
hygroscopic mode and an underestimation of the correspondingκ.
The size-dependence ofS suggests that a singleS from DMT-CCNC will serve the separation purpose for a limited size range. To maintain the separation function, we need to adjustS according to the value ofDd. Figure S2 shows size dependentS for
κof 0.05. In practice, such scanning can be achieved by using a Scanning Flow CCN
10
Analysis (SFCA) for DMT-CCNC.
3.3 Evaluation of BS2 approach
Figure 6 shows the experimental setup for evaluating the BS2 analysis. The setup is similar to normal size-resolved CCN measurements except that a nano-CCN counter (Wang et al., 2015) is used instead of a DMT-CCN counter. The nano-CCN counter was
15
developed for measuring aerosol activation at the size range of 2 to 10 nm. In this size range, aerosol particles are of high diffusivity and go beyond the initial flow constraint. Thus aerosol particles are widely distributed in the activation unit of a nano-CCNC and BS2 analysis can be directly applied without modification of the system.
Figure 6 shows theFact–Saerosol relation andFact–κ relation determined from a
size-20
resolved nano-CCNC measurement. The solid line represents the calibration curve (us-ing tungsten oxides particles as calibration aerosol, Wang et al., 2015). It confirms the monotonic dependence ofFacton Saerosol. Then by measuringFact of mono-dispersed
aerosols, we can determineSaerosol as well as κ (Eq. 2). As shown in Fig. 6, a larger
Factcorresponds to a smallerSaerosoland a higherκ(more hygroscopic). Note thatκ at
25
this size range is different from previous CCN measurements due to the concentration and size dependence ofκand relevant thermodynamic parameters (Wang et al., 2015; Cheng et al., 2015).
AMTD
8, 9713–9730, 2015A broad supersaturation scanning (BS2) CCN
counter
H. Su et al.
Title Page
Abstract Introduction
Conclusions References
Tables Figures
◭ ◮
◭ ◮
Back Close
Full Screen / Esc
Printer-friendly Version Interactive Discussion
Discussion
P
a
per
|
Discussion
P
a
per
|
Discussion
P
a
per
|
Discussion
P
a
per
|
4 Conclusions
As a new concept for the design of CCN counters, the broad supersaturation scanning (BS2) approach reduces the time required for scanning supersaturation and can pro-duce κ of high temporal and size resolution. The principle of BS2 analysis has been demonstrated by laboratory experiments with a nano-CCNC. Model simulations show
5
that the BS2 analysis is applicable for mixed particles with a singleκmode. It can also be applied to aerosol particles with multipleκ modes when complementary measure-ments are performed in parallel.
The BS2 approach requires relatively simple modification of existing thermal-gradient CCN counters (such as DMT-CCNC). The data process procedure of BS2 analysis is
10
even easier than the present size-resolved CCN measurements. In addition, both tem-perature gradient and flow rate are kept constant during the measurements, minimizing the technical complexity and system stability. The fast response and stability of BS2 analysis are especially well suited for long-term measurements. Becauseκ is closely related to the fraction of organics/inorganics in aerosol particles, BS2 can also serve
15
as a complementary sensor for fast detection/estimation of aerosol chemical composi-tions.
The Supplement related to this article is available online at doi:10.5194/amtd-8-9713-2015-supplement.
Acknowledgements. This study was supported by the Max Planck Society (MPG), National
20
Science Foundation of China (NSFC, grant no. 41330635), the Minerva Programme and EU FP7 project BACCHUS (project number 603445).
The article processing charges for this open-access publication were covered by the Max Planck Society.
AMTD
8, 9713–9730, 2015A broad supersaturation scanning (BS2) CCN
counter
H. Su et al.
Title Page
Abstract Introduction
Conclusions References
Tables Figures
◭ ◮
◭ ◮
Back Close
Full Screen / Esc
Printer-friendly Version Interactive Discussion
Discussion
P
a
per
|
Discussion
P
a
per
|
Discussion
P
a
per
|
Discussion
P
a
per
|
References
Cheng, Y., Su, H., Koop, T., Mikhailov, E., and Pöschl, U.: Size dependence of phase transitions in aerosol nanoparticles, Nat. Commun., 6, 5923, doi:10.1038/ncomms6923, 2015.
Fukuta, N. and Saxena, V. K.: A horizontal thermal gradient cloud
condensa-tion nucleus spectrometer, J. Appl. Meteorol., 18, 1352–1362,
doi:10.1175/1520-5
0450(1979)018<1352:ahtgcc>2.0.co;2, 1979.
Gunthe, S. S., Rose, D., Su, H., Garland, R. M., Achtert, P., Nowak, A., Wiedensohler, A., Kuwata, M., Takegawa, N., Kondo, Y., Hu, M., Shao, M., Zhu, T., Andreae, M. O., and Pöschl, U.: Cloud condensation nuclei (CCN) from fresh and aged air pollution in the megac-ity region of Beijing, Atmos. Chem. Phys., 11, 11023–11039,
doi:10.5194/acp-11-11023-10
2011, 2011.
Hudson, J. G.: An instantaneous CCN spectrometer, J. Atmos. Ocean. Tech., 6, 1055–1065, doi:10.1175/1520-0426(1989)006<1055:aics>2.0.co;2, 1989.
Köhler, H.: The nucleus in the growth of hygroscopic droplets, Trans. Faraday Soc., 32, 1152– 1161, 1936.
15
Lance, S.: Quantifying compositional impacts of ambient aerosol on cloud droplet formation, PhD thesis, Georgia Institute of Technology, Atlanta, GA, USA, 2007.
Moore, R. H. and Nenes, A.: Scanning flow CCN analysis – a method for fast measurements of CCN spectra, Aerosol Sci. Tech., 43, 1192–1207, doi:10.1080/02786820903289780, 2009. Petters, M. D. and Kreidenweis, S. M.: A single parameter representation of hygroscopic
20
growth and cloud condensation nucleus activity, Atmos. Chem. Phys., 7, 1961–1971, doi:10.5194/acp-7-1961-2007, 2007.
Pruppacher, H. R. and Klett, J. D.: Microphysics of Clouds and Precipitation, Kluwer Academic Publishers, Dordrecht, the Netherlands, 1997.
Roberts, G. C. and Nenes, A.: A continuous-flow streamwise thermal-gradient CCN chamber
25
for atmospheric measurements, Aerosol Sci. Tech., 39, 206–221, 2005.
Rose, D., Gunthe, S. S., Mikhailov, E., Frank, G. P., Dusek, U., Andreae, M. O., and Pöschl, U.: Calibration and measurement uncertainties of a continuous-flow cloud condensation nuclei counter (DMT-CCNC): CCN activation of ammonium sulfate and sodium chloride aerosol particles in theory and experiment, Atmos. Chem. Phys., 8, 1153–1179,
doi:10.5194/acp-8-30
1153-2008, 2008.
AMTD
8, 9713–9730, 2015A broad supersaturation scanning (BS2) CCN
counter
H. Su et al.
Title Page
Abstract Introduction
Conclusions References
Tables Figures
◭ ◮
◭ ◮
Back Close
Full Screen / Esc
Printer-friendly Version Interactive Discussion
Discussion
P
a
per
|
Discussion
P
a
per
|
Discussion
P
a
per
|
Discussion
P
a
per
|
Rose, D., Gunthe, S. S., Su, H., Garland, R. M., Yang, H., Berghof, M., Cheng, Y. F., Wehner, B., Achtert, P., Nowak, A., Wiedensohler, A., Takegawa, N., Kondo, Y., Hu, M., Zhang, Y., An-dreae, M. O., and Pöschl, U.: Cloud condensation nuclei in polluted air and biomass burn-ing smoke near the mega-city Guangzhou, China – Part 2: Size-resolved aerosol chemical composition, diurnal cycles, and externally mixed weakly CCN-active soot particles, Atmos.
5
Chem. Phys., 11, 2817–2836, doi:10.5194/acp-11-2817-2011, 2011.
Su, H., Rose, D., Cheng, Y. F., Gunthe, S. S., Massling, A., Stock, M., Wiedensohler, A., An-dreae, M. O., and Pöschl, U.: Hygroscopicity distribution concept for measurement data anal-ysis and modeling of aerosol particle mixing state with regard to hygroscopic growth and CCN activation, Atmos. Chem. Phys., 10, 7489–7503, doi:10.5194/acp-10-7489-2010, 2010.
10
AMTD
8, 9713–9730, 2015A broad supersaturation scanning (BS2) CCN
counter
H. Su et al.
Title Page
Abstract Introduction
Conclusions References
Tables Figures
◭ ◮
◭ ◮
Back Close
Full Screen / Esc
Printer-friendly Version Interactive Discussion
Discussion
P
a
per
|
Discussion
P
a
per
|
Discussion
P
a
per
|
Discussion
P
a
per
|
Figure 1.Schematics of typical CCN measurements.(a)Contour of supersaturation in the CCN activation unit and configuration of aerosol and sheath flow;(b)distribution of supersaturation in the activation unit (Stube).ris the radial distance to the centerline. The shaded areas repre-sent the sheath flow part and the non-shaded areas reprerepre-sent the aerosol flow part. TheStube
profile is adopted from http://nenes.eas.gatech.edu/Experiments/CFSTGC.html.(c)Plotting of the activation supersaturation of aerosol particlesSaerosolagainst the activation fractionFact.
AMTD
8, 9713–9730, 2015A broad supersaturation scanning (BS2) CCN
counter
H. Su et al.
Title Page
Abstract Introduction
Conclusions References
Tables Figures
◭ ◮
◭ ◮
Back Close
Full Screen / Esc
Printer-friendly Version Interactive Discussion
Discussion
P
a
per
|
Discussion
P
a
per
|
Discussion
P
a
per
|
Discussion
P
a
per
|
Figure 2.Schematics of BS2-CCN measurements.(a)Contour of supersaturation in the CCN activation unit and configuration of aerosol and sheath flow;(b)distribution of supersaturation in the activation unit (Stube).ris the radial distance to the centerline. The shaded areas repre-sent the sheath flow part and the non-shaded areas reprerepre-sent the aerosol flow part. TheStube
AMTD
8, 9713–9730, 2015A broad supersaturation scanning (BS2) CCN
counter
H. Su et al.
Title Page
Abstract Introduction
Conclusions References
Tables Figures
◭ ◮
◭ ◮
Back Close
Full Screen / Esc
Printer-friendly Version Interactive Discussion
Discussion
P
a
per
|
Discussion
P
a
per
|
Discussion
P
a
per
|
Discussion
P
a
per
|
Figure 3.The activation fractionFactmeasured by a BS2-CCNC as a function of particle dry
diameterDdandκ.Stube profile of the BS2-CCNC is taken the same as in Fig. 2b.
AMTD
8, 9713–9730, 2015A broad supersaturation scanning (BS2) CCN
counter
H. Su et al.
Title Page
Abstract Introduction
Conclusions References
Tables Figures
◭ ◮
◭ ◮
Back Close
Full Screen / Esc
Printer-friendly Version Interactive Discussion
Discussion
P
a
per
|
Discussion
P
a
per
|
Discussion
P
a
per
|
Discussion
P
a
per
|
Figure 4.Influence of aerosol hygroscopicity (κ) distribution on the retrieval ofκby BS2-CCNC.
AMTD
8, 9713–9730, 2015A broad supersaturation scanning (BS2) CCN
counter
H. Su et al.
Title Page
Abstract Introduction
Conclusions References
Tables Figures
◭ ◮
◭ ◮
Back Close
Full Screen / Esc
Printer-friendly Version Interactive Discussion
Discussion
P
a
per
|
Discussion
P
a
per
|
Discussion
P
a
per
|
Discussion
P
a
per
|
Figure 5. (a)Supersaturation required to activate the less hygroscopic mode by a DMT-CCNC. The shaded isolines describe the probability density function of a two-mode κ distribution. The colored isolines represent the supersaturation required to activate particles for certain dry diameterDdandκ.(b)κretrieved for the more hygroscopic mode by BS2-CCNC with (labeled as “corrected”) and without (labeled as “apparent”) complementary measurements of a DMT-CCNC.
AMTD
8, 9713–9730, 2015A broad supersaturation scanning (BS2) CCN
counter
H. Su et al.
Title Page
Abstract Introduction
Conclusions References
Tables Figures
◭ ◮
◭ ◮
Back Close
Full Screen / Esc
Printer-friendly Version Interactive Discussion
Discussion
P
a
per
|
Discussion
P
a
per
|
Discussion
P
a
per
|
Discussion
P
a
per
|
Figure 6. (a)Schematic of the setup for nano-CCNC measurements;(b)dependence of ac-tivation fractionFact on the aerosol activation supersaturationSaerosol and(c)hygroscopicityκ