Analysis of the posterior cingulate
cortex with [
18
F]FDG-PET and Naa/mI
in mild cognitive impairment
and Alzheimer’s disease
Correlations and differences between the two methods
Artur M.N. Coutinho1, Fábio H.G. Porto3, Poliana F. Zampieri1,
Maria C. Otaduy2, Tíbor R. Perroco3, Maira O. Oliveira3, Rafael F. Nunes1,
Toulouse Leusin Pinheiro2, Cassio M.C. Bottino3, Claudia C. Leite2, Carlos A. Buchpiguel1
ABSTRACT. Reduction of regional brain glucose metabolism (rBGM) measured by [18F]FDG-PET in the posterior cingulate cortex (PCC) has been associated with a higher conversion rate from mild cognitive impairment (MCI) to Alzheimer’s disease (AD). Magnetic Resonance Spectroscopy (MRS) is a potential biomarker that has disclosed Naa/mI reductions within the PCC in both MCI and AD. Studies investigating the relationships between the two modalities are scarce.
Objective: To evaluate differences and possible correlations between the findings of rBGM and NAA/mI in the PCC of individuals with AD, MCI and of cognitively normal volunteers. Methods: Patients diagnosed with AD (N=32) or MCI (N=27) and cognitively normal older adults (CG, N=28), were submitted to [18F]FDG-PET and MRS to analyze the PCC. The two methods were compared and possible correlations between the modalities were investigated. Results: The AD group exhibited rBGM reduction in the PCC when compared to the CG but not in the MCI group. MRS revealed lower NAA/mI values in the AD group compared to the CG but not in the MCI group. A positive correlation between rBGM and NAA/mI in the PCC was found. NAA/mI reduction in the PCC differentiated AD patients from control subjects with an area under the ROC curve of 0.70, while [18F]FDG-PET yielded a value of 0.93. Conclusion: rBGM and Naa/mI in the PCC were positively correlated in patients with MCI and AD. [18F]FDG-PET had greater accuracy than MRS for discriminating AD patients from controls.
Key words: positron-emission tomography, spectrum analysis, magnetic resonance imaging, mild cognitive impairment, Alzheimer’s disease.
ANÁLISE DO GIRO DO CÍNGULO POSTERIOR COM [18F]FDG-PET E RELAÇÃO NAA/MI NO COMPROMETIMENTO LEVE E NA
DOENÇA DE ALZHEIMER: CORRELAÇÕES E DIFERENÇAS ENTRE OS MÉTODOS
RESUMO. Redução do metabolismo cerebral regional glicolítico (MRG) medido pela PET-18FDG no giro do cíngulo posterior (GCP) está relacionada a maior conversão para doença de Alzheimer (DA) em sujeitos com comprometimento cognitivo leve (CCL). Espectroscopia por ressonância magnética (MRS), um biomarcador promissor, demonstra redução de Naa/mI no GCP na DA. Raros estudos avaliam relações entre Naa/mI e MRG. Objetivo: Avaliar diferenças e possíveis correlações entre MRG com PET-18FDG e Naa/mI por MRS no GCP de sujeitos com DA, CCL e voluntários normais. Métodos: Sujeitos com DA (N=32), CCL amnéstico (N=27) e voluntários idosos normais (GC, N=28), foram submetidos a PET-18FDG e análise de Naa/mI no GCP. A performance de ambos os métodos foi então comparada e verificou-se a existência de correlações entre os achados da PET e da MRS. Resultados: Observou-se hipometabolismo glicolítico nos pacientes com DA no GCP em relação ao GC, porém não no CCL. A MRS demonstrou valores menores de Naa/mI no CP do grupo
This study was conducted at the Centro de Medicina Nuclear, Instituto e Departamento de Radiologia, Hospital das Clínicas da Faculdade de Medicina da Univer-sidade de São Paulo (HC/FMUSP) and at the Centro de Referência em Distúrbios Cognitivos, HC/FMUSP.
1Centro de Medicina Nuclear, Instituto e Departamento de Radiologia, HC/FMUSP, LIM 43. 2Serviço de Ressonância Magnética, Instituto e Departamento de
Radiologia, HC/FMUSP, LIM 44. 3Centro de Referência em Distúrbios Cognitivos (CEREDIC) do HC/FMUSP.
Arthur M.N. Coutinho. Department of Radiology/Nuclear Medicine Center/LIM43 / HC/FMUSP – Trav. Ovídio Pires de Campos S/N – Prédio do Centro de Medicina Nuclear, 2º andar – LIM43 – 05403-010 São Paulo SP – Brazil. E-mail: [email protected]
Disclosure: The authors report no conflits of interest.
Received September 03, 2015. Accepted in final form November 03, 2015.
DA em relação ao GC, porém também sem diferenças entre CCL e GC. A área sob a curva ROC demonstrou valor de 0,70 para MRS e 0,93 para o MRG no GCP para diferenciar DA do GC. Houve correlação positiva entre o MRG e o Naa/ mI no GCP. Conclusão: Os valores de metabolismo de glicose à PET e de Naa/mI à MRS no giro do cíngulo posterior apresentaram correlação positiva estatisticamente significante na presente amostra. Houve ainda superioridade da PET-18FDG para diferenciar DA do GC.
Palavras-chave: tomografia por emissão de pósitrons, análise espectral, imagem por ressonância magnética, comprometimento cognitivo leve, doença de Alzheimer.
INTRODUCTION
A
lzheimer’s disease (AD) has become a public health problem with the rise in life expectancy, since there is currently no treatment that modiies its progression.1-3 Correct diagnosis in the early stages of the disease is crucial to better understand its pathophysiology and to develop treatments to slow its progression. Mild cogni-tive impairment (MCI), especially the amnestic subtype, is a symptomatic transitional state from normal aging to early dementia. MCI is characterized by subjective memory complaints and objective decline in cognitive performance, with normal or near-normal functional activities of daily living.4,5Positron emission tomography using [18 F]luorode-oxyglucose ([18F]FDG-PET) is a well-established tool for monitoring regional brain glucose metabolism (rBGM). A progressive reduction of rBGM in speciic areas occurs years before the onset of clinical symptoms in patients with veriied AD and during the MCI phase, particularly in the temporoparietal cortex and posterior cingulate cortex (PCC) association.6-10 Of all the areas, the PCC seems to be the most sensitive marker for predicting which patients with MCI will progress to AD.7,10,11
Magnetic Resonance Spectroscopy (MRS) uses a standard MRI scanner and acquires a spectrum that expresses metabolite concentrations in the brain. It is a potentially useful noninvasive neuroimaging technique for detecting brain biochemical changes associated with neurodegenerative diseases.12 MRS has potential utility as a biomarker in MCI and early dementia, helping with early (and diferential) diagnosis and tracking disease progression surveillance.13-15
Some metabolites commonly studied with MRS and present at high concentrations in the brain are: N-Acetyl Aspartate (NAA), choline (Cho), creatine (Cr), myo-inosi-tol (mI), glutamate and glutamine (Glx).16 Each metabo-lite is sensitive to diferent processes in the brain. MRS studies have shown decreased NAA/mI and increased mI/Cr ratios in the brain of subjects with MCI, including in the PCC, which may correspond to neuronal injury.13,14 NAA is mainly found in neurons, and thus NAA reduc-tion relects neuronal loss or dysfuncreduc-tion; mI is a marker
of glial cells, thus its concentration depends on the quan-tity of gliosis.16-18 One of the drawbacks of the method, however, is the need for manually drawn regions of inter-est (ROI) in diferent areas of the brain, since values of Naa/mI may vary among diferent brain regions, i.e. the PCC and the hippocampus. Values measured can also vary according to operator experience.16
Although hypometabolism in the PCC measured by [18F]FDG-PET is a classical biomarker of disease pro-gression to AD in MCI and some MRS results disclose early neuronal injury in this area, studies correlating the indings of the two modalities are scarce. Given these methods theoretically relect correlated biologic pro-cesses, this study sought to investigate whether the two measures are closely related in elderly patients with AD or amnestic MCI and control subjects without cognitive complaints.
hus, the objectives of this study were to assess pos-sible diferences in indings on [18F]FDG-PET and in NAA/mI ratio (a measure of neuronal injury) assessed by MRS in the PCC among patients with AD or MCI and cognitively normal volunteers, and also to determine possible correlations between the two methods in the PCC of these individuals.
METHODS
group (AD), mild cognitive impairment group (MCI) or control group (CG).
Patients from the AD group were diagnosed according to the DSM-IV and the NINCDS-ADRDA criteria.19 he revised Petersen criteria were used to diagnose individu-als with MCI.4,5 Only patients with amnestic MCI were included. Severity of the cognitive complaints was mea-sured by the Clinical Dementia Rating (CDR) scale.20 Only individuals with a score of 1.0 on the Clinical Dementia Rating were included in the AD group (deined as early AD). All subjects from the MCI and Control groups had CDR=0.5 (MCI) and CDR=0 (CG), respectively.
All subjects were submitted to the Mini-Mental State Examination,21 the Brief Cognitive Screening Battery (BCSB),22 the Dementia Rating Scale23,24 and to a compre-hensive neuropsychological evaluation, which included the following tests: Visual Reproduction subtest of the Wechsler Memory Scale – Revised (WMS-R),25 Rey Com-plex Figure - delayed recall,26 Logical Memory subtest of the Wechsler Memory Scale – Revised (WMS-R),25 Selec-tive Reminding Test,27 Block Design subtest – Wechsler Adult Intelligence Scale (WAIS),28 Rey Complex Figure copy,26 attention/executive functions (Trail Making Test A and B),26 and phonemic verbal luency (F.A.S.),26 and language (semantic verbal luency – supermarket).23,24 he application, scoring and interpretation of the results obtained for all tests were performed according to their respective reference guides. All brain-imaging procedures were performed within 2 weeks of the clinical examina-tions and neuropsychological testing.
Exclusion criteria included: [1] volunteers with clini-cally relevant psychiatric symptoms meeting DSM-IV cri-teria; [2] any uncompensated clinical comorbidity, such as cardiac failure or anemia; [3] history or presence of signs of other neurologic diseases, such as Parkinson’s disease, epilepsy, inlammatory disease or stroke, with the exception of migraine; [4] presence of any drug abuse (especially alcoholism); [5] patients with diabetes mel-litus without adequate glycemic control in the last two weeks; [6] demented subjects with CDR >1.0; [7] pres-ence of neoplastic or signiicant vascular lesions on the MRI, according to the judgment of an assistant neuro-radiologist and of the authors (AMNC); [8] contrain-dication of the MRI exam. Antidepressant use was not strictly exclusionary; individuals using antidepressants were allowed to participate if on a stable dose for at least three months and without symptoms of an active psy-chiatric disease at the time of screening.
his research project was approved by the ethics committee of the Hospital das Clínicas da Faculdade de Medicina da Universidade de São Paulo, and complied
with the provisions of the Declaration of Helsinki. All subjects signed a consent form.
Magnetic resonance imaging acquisition. All patients
underwent a standard brain MRI scan to exclude the presence of signiicant lesions and for co-registration with [18F]FDG-PET images.
Brain MRI exams were performed on a 3.0T magnetic resonance scanner (Intera Achieva, PHILIPS Healthcare, Best, he Netherlands) with an 8-channel head coil and the imaging protocol included the following sequences: 3D-T1 Fast Field Echo (3D-T1 FFE), axial T2-weighted fast spin echo (FSE), axial luid-attenuated inversion recovery (FLAIR), coronal T2- weighted fast spin echo (FSE) with fat saturation (SPIR), and difusion. Finally, a single-voxel 1H-MRS was obtained from the PCC using the PRESS sequence with 128 averages, TR of 1500 ms and TE of 35 ms. Voxel size was 2×2×2 cm3 and placed in the PCC (Figure 1). NAA and mI concentrations were quantiied relative to an internal water reference using LCModel.29
Positron emission tomography imaging acquisition. Patients with blood glucose levels lower than 180 mg/mL and at least 4 hours of fasting received an intravenous injection of 370 MBq of [18F]FDG in a peripheral vein, and rested with eyes open and ears unplugged for 60 minutes in a calm, silent and slightly darkened room. Images were acquired using a Siemens Biograph PET-CT scanner (CTI/ Siemens, Knoxville, TN, USA).
PET data was analyzed on a voxel-by-voxel basis using the SPM8 software program (Wellcome Department of Cognitive Neurology, Functional Imaging Laboratory, London, UK) in conjunction with MATLAB R2009a (he Mathworks Inc., U.S.A.). Each PET study was co-registered with the individuals’ respective MRI images (volumetric T1) and spatially normalized in SPM8 into a standard stereotactic space, based on the SPM8/Mon-treal Neurologic Institute (MNI) space. Global uptake diferences between brain scans were adjusted using the “proportional scaling” SPM option. he relevant peak voxels were identiied in terms of coordinates accord-ing to Talairach and Tournoux with the aid of the Talai-rach Client software, and after conversion from the SPM/MNI space. Complete details of the [18F]FDG-PET acquisition and imaging processing have been described previously.30,31
difer-ences across the groups (AD, MCI and CG) using the SPM software. Post-hoc analyses with unpaired T-tests were used to examine diferences between each pair of groups. SPM8 maps were generated with a visualization threshold of p<0.001 and the threshold for signiicance at the voxel level was set at p=0.001 (Z score=3.09) with a minimum extension of 10 voxels in the corresponding cluster. he initial exploratory analyses with SPM maps generated a t statistic for each voxel, thus constituting statistical parametric maps.
In order to obtain values of the radioactive counts related to the rBGM in the PCC as measured with [18F] FDG-PET, a direct analysis of this region was per-formed with SPM, adopting the small volume correc-tion approach (SVC). After identifying the cluster with rBGM reduction in the PCC in the AD group, a volumet-ric region of interest (ROI) of this cluster was generated (Figure 1). In order to increase the speciicity of this anal-ysis, the statistical cutof was set at p<0.05, corrected for multiple comparisons with the familywise error method
Figure 1. Illustration of the regions of inter-est on MRS and [18F]FDG-PET. [A1] ROI in posterior cingulate drawn in the FLAIR se-quence of MRI (red square); [A2] different peaks calculated on MRS; [B] (lower row): ROI in PCC of [18F]FDG-PET images, drawn with the SPM8 MarsBar toolbox.
A1
A2
B
A
B
C
(pFWE), with a minimum extension of 20 voxels in the corresponding cluster. Subsequently, numeric values rep-resenting [18F]FDG uptake measures in that cluster for each individual in all groups (after the whole normaliza-tion process) were extracted with the toolbox MarsBar for SPM (http://marsbar.sourceforge.net/) under the option “explore design/iles and factors”.32
Demographic data and the values of the MRS NAA/ mI ratio in the PCC were compared across groups by an ANOVA analysis with the aid of SPSS software version 17.0 (SPSS Inc., Chicago IL).
After obtaining the average radioactive counts in the PCC and the NAA/mI ratio of all subjects, numeric data were assessed with the SPSS software to identify possible correlations among the data. Sensitivity and speciicity curves for each method were also generated in order to compare the diagnostic performance of the two approaches.
RESULTS
Eighty-seven (87) individuals were included and clas-siied into one of the three groups: AD (n=32), MCI (n=27) and CG (n=28). Demographic data for the sample is shown in Table 1. Subjects included in the CG were younger (p<0.001) than those from the AD group, had more years of education than both patient groups (p=0.001 for MCI and p<0.001 for AD) and also higher Mini-Mental State Examination (MMSE) scores than both the MCI (p=0.031) and AD (p<0.001) groups. Performance on the MMSE was also higher in the MCI group than in the AD group (p<0.001).
he AD group exhibited rBGM reduction in large areas of the PCC and temporoparietal cortex compared to the CG, but also in less evident areas of the frontal cortex. his metabolism reduction existed in similar areas among the MCI patients, albeit with lesser
exten-sion. he majority of these areas persisted after correc-tions for multiple comparisons using the FWE method (pFWE<0.001). he MCI individuals showed rBGM reduction in the temporal association cortex in relation to CG (p<0.001)(not surviving correction for multiple comparisons) that was more restricted to the temporal lobes compared to the hypometabolism seen in the AD group. he SVC analysis of the PCC depicted no difer-ences between the MCI group and the CG after correc-tion for multiple comparisons (pFWE<0.05). he areas of metabolic reduction are illustrated in Figure 2 (complete statistical results of the SPM8 analysis are beyond the scope of the present work and are not provided).
MRS analysis showed lower NAA/mI values in the AD group compared to the CG (p=0.024). A tendency for lower NAA/mI peak in the PCC was found in the MCI group compared to the CG (p=0.06). his data is also shown in Table 2 and illustrated in Figure 3.
A positive correlation between rBGM and NAA/mI peak in the PCC was found (r= 0.317; p= 0.012) (Table 2 and Figure 3). Lower NAA/mI in the PCC voxel difer-entiated AD patients from control subjects, with an area under the receiver operating characteristic curve of 0.70 (CI=0.57-0.84, p =0.006), while the ROI analysis of the PET data yielded a value of 0.93 (CI=0.88-0.99, p<0.001) (Figure 3).
DISCUSSION
Hypometabolism in the PCC showed good correlation with clinical measures of cognitive impairment such as the CDR sum of boxes.33 his reduction is classi-cally related to conversion from MCI to AD and is also considered a standard biomarker for diferentiating AD from non-demented subjects.7,10,34,35 he areas of rBGM reduction seen in the temporoparietal cortex of AD and MCI groups in comparison to the CG were also
previ-Table 1. Demographic data for the sample.
CG=28 (CDR=0)
Mean (SD) MCI=27 (CDR=0.5)Mean (SD) AD=32 (CDR=1.0)Mean (SD) Multiple comparisonP (two-tailed)
Age (Y)* 69.7 (6.6) 72.7 (6.8) 76.3 (6.7) 0.001
CG × AD
Gender (F/M)** 6 / 22 12 / 15 10 / 22 p>0.05
Education (Y)* 12.8 (5.1) 8.0 (4.9) 7.1 (4.1) <0.001 CG × AD (<0.001) & CG × MCI (p =0.001)
MMSE* 29.0 (1.0) 27.2 (2.1) 22.9 (3.4) <0.001
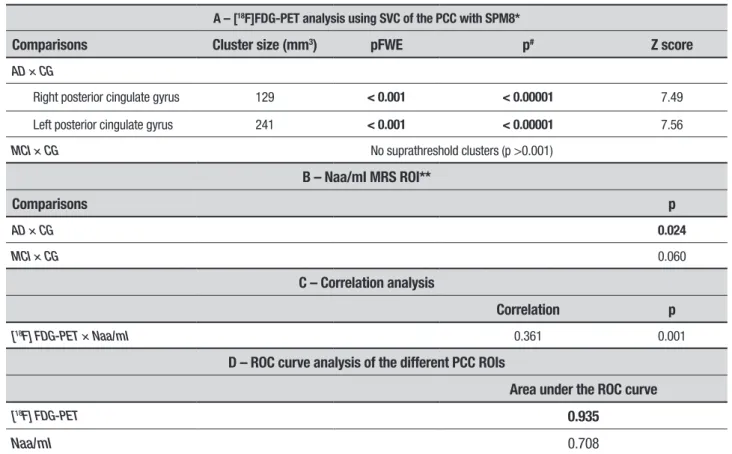
Table 2. Summary of key findings of the study.
A – [18F]FDG-PET analysis using SVC of the PCC with SPM8*
Comparisons Cluster size (mm3) pFWE p# Z score
AD × CG
Right posterior cingulate gyrus 129 < 0.001 < 0.00001 7.49
Left posterior cingulate gyrus 241 < 0.001 < 0.00001 7.56
MCI × CG No suprathreshold clusters (p >0.001)
B – Naa/mI MRS ROI**
Comparisons p
AD × CG 0.024
MCI × CG 0.060
C – Correlation analysis
Correlation p
[18F] FDG-PET × Naa/mI 0.361 0.001
D – ROC curve analysis of the different PCC ROIs
Area under the ROC curve
[18F] FDG-PET 0.935
Naa/mI 0.708
*Results at the peak voxel level (ANOVA and post-hoc unpaired t-test); **ANOVA and post-hoc unpaired t-test with SPSS; #p value uncorrected for multiple comparisons; pFWE: p value corrected
for multiple comparisons with the familywise error method; MCI: Amnestic MCI; CG: Control group; SPM: statistical parametric mapping; SVC: small volume correction method, directed to the PCC.
A
B
Figure 3. [A] Scatter plot of the correlation curve between values of rBGM (y axis) and Naa/mI (x axis) in the PCC; [B] ROC curves of the directed analysis of the PCC with MRS and Naa/mI peak and with the [18F]FDG-PET ROI analysis.
ously described as typical areas of neurodegeneration in these conditions.6,8,9 he results of the present study conirmed these indings by showing rBGM reduction in the temporoparietal cortex of both AD and MCI groups, albeit with lesser extension and intensity in the latter, as expected. However, the rBGM reduction in the PCC was not statistically signiicant in the MCI group, thereby failing to corroborate the results of other authors.
he MRS Naa/mI analysis revealed similar results
while the lower number of subjects included in the present study should also be taken into account.13
On the PCC evaluation, the ROC curve analysis of [18F]FDG was superior than the Naa/mI ratio for dis-criminating AD subjects from cognitively normal older adults. hese results indicate that, although a promising tool for evaluating subjects with cognitive decline, analy-sis of Naa/mI peak by MRS still lacks the sensitivity of rBGM evaluation with [18F]FDG-PET.
With regard to the MCI group, both methods failed to detect signiicant diferences between the MCI group and the CG in the PCC. [18F]FDG-PET, however, disclosed dif-ferences between the MCI and CG groups in other areas. A comprehensive analysis of the whole brain with MRS was not performed since it is technically diicult, repre-senting a limitation of the method.
Which areas irst present hypometabolism or atrophy in AD and normal aging remains unclear and a matter of ongoing debate.36 While some authors have found hypo-metabolism in the PCC before other changes in MCI, others have found that blood low and rBGM reductions in the precuneus and temporoparietal cortex can occur without evident PCC hypometabolism.31,37
Some authors also argue that rBGM reduction in MCI could be the indirect result of atrophy and partial volume efect (PVE), especially in the medial temporal lobes,38 since atrophy in large areas of the temporal lobes occurs in early AD.39 Given our data was not corrected for PVE, this hypothesis could not be tested here and may be con-sidered a limitation of the present study.
Hinrichs et al (2011),40 using a machine-learning multi-modal approach, proposed that the combination of diferent biomarkers is superior to each individually for predicting conversion to AD in MCI. However, [18F] FDG-PET tended to be better than other techniques as a single modality although the authors did not include MRS in their analysis. he present study adds informa-tion to the cited study, supporting the noinforma-tion that [18F] FDG as a single modality is superior to others for detect-ing neurodegeneration in patients with early AD, espe-cially in the PCC.
Brain glucose metabolism is a surrogate marker of synaptic activity.41 Accordingly, metabolism should cor-relate with measures of neuronal activity and density, such as Naa/mI ratio measured with MRS. his hypoth-esis was conirmed in the present analysis of the PCC cortex and is the most remarkable inding of the study.
he PCC is a hub of the brain’s default mode network and one of the most active parts of the brain in the rest state.42-44 According to some theories, this renders the region particularly vulnerable to neuronal injuries and
to the deposition of amyloid in the AD neurodegenera-tion process.36,42 Our indings of a positive correlation between rBGM and Naa/mI in the PCC of subjects exhibiting diferent stages of cognitive function are in line with this hypothesis. his indicates that the hypome-tabolism seen in AD and MCI in the PCC is proportion-ally accompanied by a reduction in neuronal density as measured by MRS, which likely indicates neuronal injury.
he present study has some limitations. First, patients from the AD group were older than subjects from the CG a factor that may have had some inluence on the results. However, age is a major risk factor for AD and age diferences are therefore expected.1,2 Also, the present degree of rBGM reduction in the PCC and temporoparietal association cortex is not expected in normal aging.36 hus, it is unlikely that the higher age of the subjects included in the AD group inluenced the results of the imaging analysis.
Second, the CG had more years of education than the other groups. Bearing in mind the cognitive reserve hypothesis, education is probably a protective factor for the development of AD and may inluence the results of neuropsychological and neuroimaging tests.36,45 How-ever, according to this theory, subjects with more years of education would have preserved cognitive performance even if presenting some degree of neurodegeneration.46-48 Hence, the subjects in the CG should have lower levels of rBGM in certain areas, with cognitive functioning close to or within the normal range. his was not seen in the present cohort, where the MCI and AD groups presented with signiicant areas of hypometabolism. herefore, it cannot be excluded that this factor could have contrib-uted to the lack of diferences in the PCC between the CG and the MCI group seen in both methods. Some of the patients with a mild degree of neurodegeneration and higher educational levels could be classiied as normal on the clinical tests, yet harbor some degree of degeneration in the PCC. However, this is one the drawbacks of the clinical diagnosis based on neuropsychological testing. his possibility can only be tested by comparing these values in a cohort of MCI and cognitively normal elderly subjects paired by age and years of education or after prospective evaluation of the patients.
Authors contibution. Coutinho AMN, Leite CC and MCO conceived the study, participated in its design and coordination, and drafted the manuscript. FHGC, PFZ and RFN performed statistical analysis, assisted with imaging process using SP8 and with drafting of the manuscript. CMCB and CAB participated in the study design and coordination. TLP performed the spec-troscopy analysis. All authors revised the inal
manu-script critically for important intellectual content and approved the inal version.
Acknowledgments. his study was funded by grants
from the Fundação de Amparo à Pesquisa do Estado de São Paulo (FAPESP) numbers 2011/18245-4 and 2009/17398-1 in Brazil.
REFERENCES
1. World Health Organization and Alzheimer’s Disease International.
Dementia: a public health priority. [Internet]. [cited 2015 jul 3]; Avail-able from: <http://www.who.int/mental_health/publications/dementia_ report_2012/en/>.
2. Harper S. Economic and social implications of aging societies. Science 2014;346:587-591.
3. Clopton D, Jason DT. Advances in dementia imaging. Semin Roentgenol
2014;49:53-63.
4. Petersen R, Smith G, Waring S, Ivnik R, Tangalos E, Kokmen E. Mild
Cognitive Impairment: Clinical Characterization and Outcome. Arch Neurol 1999;56:303-8.
5. Petersen RC. Mild Cognitive Impairment. NEJM 2011;364:2234.
6. Cerami C, Della Rosa PA, Magnani G, et al. Brain metabolic maps in Mild Cognitive Impairment predict heterogeneity of progression to dementia. NeuroImage Clin 2015;7:187-194.
7. Minoshima S, Giordani B, Berent S, Frey K, Foster N, Kuhl D.
Meta-bolic reduction in the posterior cingulate cortex in very early Alzheimer’s disease. Ann Neurol 1997;42:85-94.
8. Jagust W, Gitcho A, Sun F, Kuczynski B, Mungas D, Haan M. Brain
imaging evidence of preclinical Alzheimer’s disease in normal aging. Ann Neurol 2006;59:673-681.
9. Salmon E, Lekeu F, Garraux G, et al. Metabolic correlates of clinical heterogeneity in questionable Alzheimer’s disease. Neurobiol Aging 2008;29:1823-1829.
10. Drzezga A, Lautenschlager N, Siebner H, et al. Cerebral metabolic changes accompanying conversion of mild cognitive impairment into Alzheimer’s disease: a PET follow-up study. Eur J Nucl Med Molr Imaging 2003;30:1104-1113.
11. Silverman D. Brain 18F-FDG PET in the diagnosis of neurodegenerative
dementias: comparison with perfusion SPECT and with clinical evalua-tions lacking nuclear imaging. J Nucl Med 2004;45:594-607. 12. Kantarci K. Proton MRS in mild cognitive impairment. J Magn Reson
Imaging 2013;37:770-777.
13. Tumati S, Martens S, Aleman A. Magnetic resonance spectroscopy in mild cognitive impairment: systematic review and meta-analysis. Neurosci Biobehav Rev 2013;37:2571-2586.
14. Targosz-Gajniak MG, Siuda JS, Wicher MM, et al. Magnetic resonance spectroscopy as a predictor of conversion of mild cognitive impairment to dementia. J Neurol Sci 2013;335:58-63.
15. Zhang B, Ferman TJ, Boeve BF, et al. MRS in mild cognitive impair-ment: early differentiation of dementia with Lewy bodies and Alzheimer’s disease. Neuroimaging 2015;25:269-274.
16. Walecki J, Barcikowska M, Cwikła JB, Gabryelewicz T. N-acetylaspar-tate, choline, myoinositol, glutamine and glutamate (glx) concentration changes in proton MRspectroscopy (1H MRS) in patients with mild cognitive impairment (MCI). Med Sci Monit 2011;17:MT105-111. 17. Zhu X, Cao L, Hu X, et al. Brain metabolism assessed via proton
magnetic resonance spectroscopy in patients with amnestic or vascular mild cognitive impairment. Clin Neurol Neurosurg 2015;130:80-85. 18. Glodzik L, Sollberger M, Gass A, et al. Global N-acetylaspartate in
normal subjects, mild cognitive impairment and Alzheimer’s disease patients. J Alzheimers Dis 2015;43:939-947.
19. McKhann G, Drachman D, Folstein M, Katzman R, Price D, Stadlan EM. Clinical diagnosis of Alzheimer’s disease: report of the NINCDS-ADRDAWork Group under the auspices of Department of Health and Human Services Task Force on Alzheimer’s Disease. Neurology 1984;34: 939-944.
20. Morris JC. The Clinical Dementia Rating (CDR) – current version and scoring rules. Neurology 1993;43: 2412-2414.
21. Folstein MF, Folstein SE, McHugh PR. “Mini-mental state”. A practical method for grading the cognitive state of patients for the clinician. J Psychiatr Res 1975;12:189-98.
22. Nitrini R, Caramelli P, Herrera EJr, et al. Performance of illiterate and literate nondemented elderly subjects in two tests of long-term memory. J Int Neuropsychol Soc 2004;10:634-638.
23. Mattis S. Dementia Rating Scale. Professional manual. Florida: Psycho-logical Assessment Resources;1988.
24. Porto CS, Fichman HC, Caramelli P, Bahia VS, Nitrini R. Brazilian version of the Mattis Dementia Rating Scale: Diagnosis of mild dementia in Alzheimer`s Disease. Arq Neuropsiquiatr 2003;61:339-345.
25. Wechsler D. Wechsler Memory Scale. Manual The Psychological Corpo-ration Harcourt Brace Jovanovich; 1987.
26. Spreen O, Strauss E. A Compendium of Neuropsychological Tests. Administration, Norms, and Commentary. Second Edition. Oxford University Press; 1998.
27. Buschke, H. Selective reminding for analysis of memory and learning. J Verbal Learning Verbal Behav 1973;12:543-550.
28. Nascimento, E. WAIS-III: Escala de Inteligência Wechsler para Adultos: Manual David Wechsler;Adaptação e padronização de uma amostra brasileira. 1st ed. São Paulo: Casa do Psicólogo; 2004.
29. Provencher SW. Estimation of metabolite concentrations from localized in vivo proton NMR spectra. Magn Reson Med 1993;30:672-679. 30. Porto FHG, Coutinho AMN, Pinto ALS, et al. Effects of Aerobic Training
on Cognition and Brain Glucose Metabolism in Subjects with Mild Cogni-tive Impairment. J Alzheimers Dis 2015;46:747-760.
31. Coutinho AMN, Porto FHG, Duran FLS, et al. Brain metabolism and cerebrospinal fluid biomarkers profile of non-amnestic mild cognitive impairment in comparison to amnestic mild cognitive impairment and normal older subjects. Alzheimers Res Ther 2015;7:58.
32. Brett M, Anton J, Valabregue R, Poline J. Region of interest analysis using an SPM toolbox. NeuroImage 2002;16: abstract 497.
33. Perneczky R, Hartmann J, Grimmer T, Drzezga A, Kurz A. Cerebral metabolic correlates of the clinical dementia rating scale in mild cogni-tive impairment. J Geriatr Psychiatry Neurol 2007;20:84-88.
34. Herholz K, Westwood S, Haense C, Dunn G. Evaluation of a calibrated (18)F-FDG PET score as a biomarker for progression in Alzheimer disease and mild cognitive impairment. J Nucl Med 2011;52:1218-1226. 35. Herholz K. Use of FDG PET as an imaging biomarker in clinical trials of
Alzheimer’s disease. Biomark Med 2012;6:431-439.
36. Fjell AM, McEvoy L, Holland D, Dale AM, Walhovd KM. Alzheimer’s Disease Neuroimaging Initiative. What is normal in normal aging? Effects of aging, amyloid and Alzheimer’s disease on the cerebral cortex and the hippocampus. Prog Neurobiol 2014;117:20-40.
37. Johnson K, Moran EK, Becker JA, Blacker D, Fischman AJ, Albert MS. Single photon emission computed tomography perfusion differences in mild cognitive impairment. J Neurol Neurosurg Psychiatry 2007;78: 240-247.
AD in a multi-modality framework: an analysis of MCI progression in the ADNI population. NeuroImage 2011;55:574-589.
41. Jack CR Jr, Knopman DS, Jagust WJ, et al. Tracking pathophysiological processes in Alzheimer’s disease: An updated hypothetical model of dynamic biomarkers. Lancet Neurol 2013;12:207-216.
42. Buckner R, Snyder AZ, Shannon BJ, et al. Molecular, structural, and functional characterization of Alzheimer’s disease: evidence for a relation-ship between default activity, amyloid, and memory. J Neurosci 2005; 25:7709-7717.
43. Buckner R, Andrews-Hanna J, Schacter D. The brain’s default network: anatomy, function, and relevance to disease. Ann N Y Acad Sci 2008; 1124:1-38.
44. Buckner R. The serendipitous discovery of the brain’s default network. Neuroimage 2012;62:1137-1145.
45. Larson EB, Yaffe K, Langa KM. New Insights into the Dementia Epidemic. N Engl J Med 2013;369:2275-2277.
46. Garibotto V, Borroni B, Kalbe E, et al. Education and occupation as proxies for reserve in aMCI converters and AD FDG-PET evidence. Neurology 2008;71:1342-1349.
47. Tucker AM, Stern Y. Cognitive reserve in aging. Curr Alzheimer Res 2011;8:354-360.
![Figure 2. Illustrative anatomic location of peak voxels of rBGM reductions as mea-sured by [ 18 F]FDG-PET](https://thumb-eu.123doks.com/thumbv2/123dok_br/15188786.527111/4.892.66.551.102.462/figure-illustrative-anatomic-location-peak-voxels-reductions-sured.webp)