INFLUENCE OF TEMPERATURE ABUSES ON THE QUALITY OF
FROZEN BROAD BEANS
R.C. MARTINS, B. DESPRE,
A.F. MOLINARI AND C.L.M. SILVA•
Escola Superior de Biotecnologia, Universidade CatOlica Portuguesa
Rua Dr. Antonio Bernardino de Almeida, 4200 Porto, Portugal
ABSTRACT
The main objective of this study was to evaluate the impact of temperature abuses on the quality
of frozen broad beans.
Test samples suffered the application of three types of abuses, simulating the pack in the
outermost corner of a pallet when placed at room temperature, defrosting in a display cabinet and
home transport. Control samples were kept at -18±2°C. Several quality parameters were analysed
along storage.
No significant difference in acidity, pH, moisture and sugars was detected, and no regeneration of
peroxidase was observed. However, a significant difference was found for colour coordinates.
Sensory evaluation lead to the conclusion that there is a significant difference in terms of colour,
flavour intensity and firmness, but there was no preference for any of the samples.
Frozen broad beans are sensitive to temperature abuses, therefore special care must be taken to
keep a constant storage temperature.
1. INTRODUCTION
Temperature abuses are a major hazard that limits the quality of frozen foods. Frozen foods can
suffer a temperature abuse from the moment it leaves the plant until it reaches the consumer's meal. •
In EU and many other countries, from a legislative point of view, the storage temperature of -18°C is
recommended. This regulation is in most cases difficult to obtain, not only because of temperature
fluctuations in display cabinets and storage rooms, but also due to the lack of «good manufacturing
practice» throughout the whole distribution chain.
From all Time - Temperature - Tolerance (TTT) investigations, it seems that the lower the
storage temperature, the higher the storage life of the product. For example, no measurable changes
in quality occurs for periods of five years or more when food products are held at -29°C or lower
(Guadini, 1969). These kind of studies revealed that frozen vegetables are stable enough to maintain
high quality from one harvest to another when held at -18°C. However, when exposed to fluctuating
cycles, the fruit and vegetables quality attributes with high deterioration rates change at a rate
equivalent to a steady state well above the mean temperature of the cycle. Thus, quality changes in
frozen foods are additive and commutative (Guadini, 1969). Also, Kramer (1979) showed that
sensory quality is influenced by the magnitude of temperature fluctuations.
Frozen foods stored at -18°C are not completely frozen, nor are inert. Frozen storage leads to
deterioration at a significant rate that exceeds the damage caused by other phases of the freezing
process (such as pre-freezing treatments, freezing and thawing). These changes occur by chemical or
physical means. Fluctuating temperatures can be more detrimental to product quality than a
comparable steady-temperature condition and recommended maximum storage times are often
exceeded.
Chemical changes in frozen foods can affect colour, flavour, texture and nutritive value, mainly
due to oxidation. Other major causes of frozen foods degradation are the migration of water,
recrystalization and liquid/glass transformation phenomena.
The recrystalization process, where crystals decrease in number but increase in size, has an
increased rate with high storage temperatures and plays an important role in the deterioration of
texture in delicate plant tissues. Texture of delicate plant tissues is also damaged due to freeze
20th International Congress of Refrigeration,
Sydney, 1999
336
concentration of solutes in the unfrozen phase which causes an increase in the ionic strength, and a
significant alteration of pH, usually downwards that damage cell membranes.
Migration of water can also occur from regions of high moisture content to other areas of low
water content. Freezer burn can also occur, due to the sublimation of water, with the accumulation
of ice in the void spaces of the package. This phenomenon is increased when there are fluctuations of
storage temperature and the relative humidity of the chamber drops with the increase of the
temperature, leading to the sublimation of water from the product. When temperature drops down
water crystallises in the void spaces, making a sensory deterioration not only due to desiccation or
freezer bums, but also because of the consumer's evaluation of in-ice when opening the package.
The objective of this work was to evaluate the impact of fluctuations in storage temperature on
quality parameters of frozen broad beans, such as: acidity, pH, moisture, sugars (totals and reduced),
regeneration of peroxidase, colour coordinates and sensory evaluation.
2. MATERIALS & METHODS
2.1 Samples
Broad beans
(Vicia lava, L.),
variety Histal (Fitol Semillas, Spain), were obtained from a
Portuguese local industry (Friopesca) immediately after freezing. It was previously sorted, pealed,
washed and blanched (2 minutes at 100°C). After being frozen it was transported from the company
to the laboratory inside thermal-insulated boxes and stored for one night, at -22±2°C, before
packing.
Approximately 900g of frozen broad beans were put into polyethylene bags (37cmx25cm).
Thermocouples were previously introduced at the centre of some broad beans. Packaged broad
beans were randomly placed into two insulated boxes, one for the control and the other for the
abused sample. Broad beans were stored in a home freezer Ariston (Merloni Electrodomósticos S. A.
, Portugal) at -22±2°C
2.2 Storage Conditions
Control samples were kept during all the time of the experiment in the insulated box with the lid
on. The abused samples were submitted to three kinds of temperature fluctuations (A, B and C)
according to a pre-defined schedule. The first type of abuse (A) was carried out to simulate the pack
in the outermost corner of a pallet when placed at room temperature. The abused samples were
placed besides each other at room temperature for 60 minutes, and then returned to the insulated box
with the lid on. For the second type of abuse (B), that simulates the defrosting in a display cabinet,
the abused samples were placed in a refrigerator at 7±1°C for 60 minutes and turned to the insulated
box with the lid off during 18-23h. For the third temperature abuse (C), the abused samples were
placed besides each other at room temperature for 2 hours and then returned to the insulated box
with the lid off for three days to simulate the transport to the consumer's home. Finally, the
temperature abuse (A) was carried out once at 25 and 27 days of frozen storage and twice (6 hours
interval) after 39 days. Temperature abuse B was carried out 46, 47, 48 and 49 days and temperature
abuse C after 50 days of frozen storage.
2.3 Analytical Determinations
Temperature in broad beans was monitored every 15 minutes during the temperature abuses, and
then every hour during 2 days using a data logger (Series 1000 Squirrel Data Logger, Grant
Instruments Ltd, Cambridge).
Control and abused samples, were also periodically submitted to physico-chemical (after thawing
at room temperature) and sensory analysis (after 32, 46, 55 and 86 days of frozen storage).
2.3.1 Moisture Content Moisture content was determined according to Eheart and Odland
(1973), by drying overnight approximately 5g (one broad bean) at 70°C in a drying oven (WTB
Winder, Germany). The temperature of the oven was controlled along time by a mercury
thermometer.
2.3.2 al The pH measurement was done using an adaptation of Eheart and Gott (1965)
method; 50 g of broad beans and 100m1 of distilled water were mixed, ground for 3 minutes with a
mixer (Moulinex, France) and pH determination was monitored after 2 minutes with a glass
electrode pH meter (micropH 2001, Crison Instruments S. A. , Spain).
2.3.3 Titratable Acidity Titratable acidity was measured according to the AOAC Official
Methods of Analysis (1995). This analysis is based on the titration of a prepared broad beans
solution with 0.1 N NaOH using phenolphthalein. The prepared solution was obtained by mixing 25g
of broad beans with 50 ml of desionised water, grinding the mixture and completing the volume until
250m1. Then this mixture, was boiled, cooled and finally filtered. The filtrate is used as broad beans
extract solution.
2.3.4 Total and Reduced Sugars Content Total and reduced sugars content were determined by
the Portuguese norm NP-1420 (1987), based on the defecation of the broad beans extract solution
by Carrez reagents and on the determination of total and reduced sugars content with and without
inversion respectively using the Luff-Schoorl method. The broad beans extract was prepared
grinding 25g of broad beans and 125m1 of desionised water. The volume was then completed until
250 ml.
2.3.5 Colour Measurement Colour measurement was done using a tristimulus colorimeter
(Chroma Meter CR-300, MINOLTA, Japan) calibrated with a white standard tile. Each broad bean
was placed on the platform of the colorimeter. Colour measurements were made to broad beans with
and without shell, because some consumers are used to consume broad beans without shell.
The values of L*, a*; b* (CIE colour system) were determined. The L* value (0 to 100)
represents the degree of lightness, a* value (-60 to 60) the ratio green/red and b*(-60 to 60) the ratio
of blue/yellow. The total colour difference, AE*, was determined between control and abused
samples:
AE* =11(AL*)
2+ (Aa*)
2+ (Ab*)
2(1)
Where :
AL* = L*, -
L*abAa* = a*, - a*ab
Ab* = b*0 - b*ab
c: control sample
ab: abused sample
2.3.6 Peroxidase Assay
Peroxidase activity was determined by a spectrophotometer assay
adapted from Barth
et a!.(1993) and Hemeda and Klien (1990) methods. The extract was obtained
by mixing 20g of broad beans with 50 ml of distilled water, ground with a mixer for 2 minutes, and
filtering throughout three layers of cheese-cloth. The filtrate was used as enzyme extract solution for
the assay. The assay was carried out at 25°C with a spectrophotometer (Shimadzu UV 1601, Japan)
at 470 nm. The substrate mixture contained 10m1 of 1% of guaiacol ( SIGMA, G-5502), 10 ml of
0.3% hydrogen peroxide (Riedel de Haen, 31642) and 100 ml of 0.05 M sodium phosphate buffer
pH 6.5. The reaction cuvette contained 2.9 ml of substrate mixture and 0.1 ml of broad beans
extract. The readings were made in a 0.2 minutes interval for 2 minutes. One unit of peroxidade
activity was defined as a change of 0.001 in absorbency per minute in the linear region of the curve.
336
Two replications were made for each analysis, and the standard deviation of all methods was
determined by eight repetitions of each analysis with the same sample.
2.4 Sensory Evaluation
For sensory assessment, 250g of frozen broad beans were cooked in 1 litre of boiling water with
4.2g of salt. The pan was covered and the broad beans were cooked for 7 minutes. Three of each
broad beans (abused and control) were presented to a trained sensory panel composed of 8 to 10
judges (depending on the day of analysis). The following questions were made to the sensory panel:
first if they notice a difference between samples, then to evaluate each sample for colour intensity,
firmness, flavour intensity, off-flavour and overall acceptability, using a 7 point grading scale (from
0- minimum to 7- maximum) and finally indicating which one they preferred.
2.5 Statistical Analysis
The ANOVA two factors without replication (ct=0.05) was performed to determine the
significant differences between control and abused samples for acidity, pH, moisture, sugars (totals
and reduced), regeneration of peroxidase and colour coordinates analysis. The same test was used to
determine the significant differences in sensory evaluation between control and abused samples for
the 7 point grading scale. Difference and preference tests were analysed by an F-Test (variance for
two samples).
3 RESULTS & DISCUSSION
The maximum temperatures reached by the abused sample are reported in Table I, for the three
kinds of abuses. The sample and environmental temperatures were registered.
Peroxidase activity was not found during frozen storage time, indicating a good blanching process
and that peroxidase did not regenerate.
Table 1: Maximal temperatures reached by abused broad beans samples
and mean environmental temperatures.
Temperature
Storage time
Sample
Environmental
abuse
(days)
temperature (°C)
temperature (°C)
A
25
-2.5
22.5
A
27
-2.5
22.5
A
39
-2.0
23.0
A
39
-0.0
25.0
B
46
-7.0
7.0
B
47
-6.5
7.5
B
48
-7.0
7.0
B
49
-7.0
7.5
C
50
-1.0
25.0
Moisture content, pH, and titratable acidity of frozen broad beans are presented in Table 2. No
differences in moisture content, pH and in titratable acidity were found during the 86 days of frozen
storage.
Table 2: Values of moisture (%), pl I and titratable acidity (g titratable acids per 100g, of broad
beans) for broad beans along frozen storage.
Storage tune
(days)
Moisture
(%)
PIT- Titratable acidity (}/1008) Control Abused Control Abused Control Abused 32 76.110.9 76.015.3 6.7310.04 6.7310.04 2.1510.0 1. 8±0.2 46 74.911.4 75.112.5 6.6810.00 6.7310.06 1.8710.0 2.210.1 55 74.911.1 73.612.6 6.73±0.00 6.7610.01 2.0010.0 1.810.2 86 70.315.7 76.8±2.2 6.7610.00 6.7710.01 1.7310.1 1.610.0
standard deviation = 2 with n = 8
standard deviation = 0.02 with n = 8
(3) standard deviation = 0.1 with n = 8
Total and reduced sugars analysis showed no significant difference between abused and control
samples. Also no differences were registed along the storage time (Table 3).
The undetected changes in sugars may be due to the reduced action of enzymes at low
refrigeration temperatures and also because of the good inactivation given by the blanching process.
It can be assumed that the maturation of the broad beans does not occur nor reduction of sugars due
to the lowering of pH with the concentration of solutes.
Table 3: Total and reduce sugars content (g of sugar per 100g of broad beans),
for control and abused samples.
Storage time (days) Total sugars (g/lOOg) Reduced sugars (gIlOOg) Control Abused Control Abused 32 1.4510.07 1.5510.07 0.0910.04 0.0610.01 46 1.8010.14 1.2010.28 0.2910.04 0.1110.07 55 0.7110.15 1.3610.15 0.1320.04 0.1310.04 86 1.9410.15 2.2010.08 0.1610.08 0.1610.15
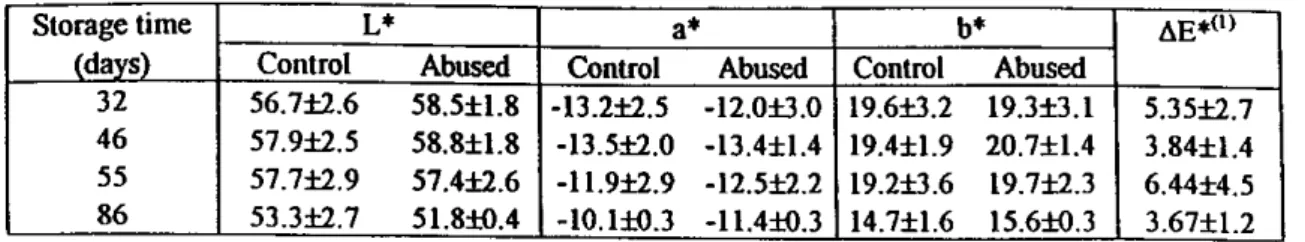
The mean colour coordinate L*, for broad beans with shell, decreased with storage time for both
control and abused samples. There was no evidence of difference along storage time between the
control and abused samples. Also, the mean coordinate b*, decreased along the storage time, but no
difference was detected between the control and abused samples. The coordinate a* increased with
storage time, and there are no significant differences between the control and abused samples until
the 86
1hday of frozen storage. The total colour difference indicates that there are significant colour
differences between control and abused broad beans with shell (see Table 3).
The colour results for broad beans without shell (Table 4) gave interesting results. The L* value
decreased very rapidly from the 56 to 86 days of the experiment and no differences between the
control and abused samples were registered. The a* value, for the control sample increased with
storage time, however the loss on the abused sample was very significant with the first temperature
abuse, indicating a great sensitivity to temperature fluctuations. The mean coordinate b* did not
change with storage time, however there is some evidence of difference at the 86th day (p=0.071)
for both control and abused samples. The total colour difference value (AE*) indicates that although
there are significant colour differences between control and abused samples, these decreases with
storage time. It can be concluded that even without the fluctuations in temperature the colour
degradation is quiet sensitive at -18°C.
Table 4: Colour measurements, L*, a*, b* and AE* mean values of
control and abused samples, for broad beans with shell.
Storage time (days)
1,* at b* AE*(')
Control Abused Control Abused Control Abused
32 56 7±2 6 58.5±1.8 -13.2±2.5 -12.0±3.0 19.6±3.2 19.3±3.1 5.35±2.7 57.9±2.5
46 58.8±1.8 -13.5±2.0 -13.4±1.4 19.4±1.9 20.7±1.4 3.84±1.4 55 57.7±2.9 57.4±2.6 -11.9±2.9 -12.5±2.2 19.2±3.6 19.7±2.3 6.44±4.5 86 53.3±2.7 51 810 4 -10.1±0.3 -11.4±0.3 14.7±1.6 15.61-0.3 3.67±1.2
(1) AE* > 3 difference very distinct; 1.5<AE*< 3 difference distinct ; AE*<1.5 small
difference.(Drlange, 1994); standard deviation = 4.0 with n = 8
Table 5: Colour measurements, L*, a*, b* and AE* mean values of
control and abused samples, for broad beans without shell.
Storage time(days)
L* at b* AE*(I)
Control Abused Control Abused Control Abused
32 38.5±18.4 37.7±17.3 -16.3±2.2 -14.4±2.2 22.5±3.8 21.8±3.2 18.5±15.0 46 50.9t3.0 50.7±2.7 -17.1±2.5 -15.3±1.6 23.9±3.7 22.3±2.6 6.8±2.9 55 50.4±3.3 48.6±1.7 -14.5±2.4 -14.4±1.9 21.0±3.5 21.0±3.2 5.9±3.1 86 15.1±1.3 13.0±0.4 -12.9±1.0 -13.2±0.6 15.4±0.7 16.4±0.3 2.8±1.6
(1) AE* -> 3 d'fference very distinct; 1.5<AE*< 3 difference distinct; AE*<1.5 small
difference.(Drlange, 1994); standard deviation = 4.0 with n = 8
The sensory evaluation results are presented in Tables 6 and 7. Sensory evaluation lead to the
conclusion that there are no differences between the control and abused samples along frozen
storage time in off-flavour and overall acceptability. However, differences were registed in colour
intensity after 86 days (p<0.05), which is confirmed by the analytical measurements of colour. The
control has more colour intensity than the abused sample. Also, there are significant differences in
flavour intensity and firmness between the control and abused sample. Control samples have more
firmness and flavour intensity. Control samples have more firmness and flavour intensity. This fact
can be due to the mechanical damage of membranes by recrystalization or membrane damage of
other source of cell damage (such as pH and ionic strength changes).
The recrystalization seemed to do not occur in great extent in the control sample, because no
differences were encountered for firmness along storage time.
The taste panel found general differences (Table 7) between samples along storage time. But,
concerning the preference test, panellists gave only preference for the control sample on the 86th days
of storage time evaluation.
•
336 Storagetime
Colour intensity Firmness Flavour intensity Off-Flavour Overall Acceptability (days) Control Abuse Control Abuse Control Abuse Control Abuse Control Abuse
32 4.2±1.7 4.3±1.0 2.411.4 2.711.6 4.211.7 4.311.0 0.430.9 0.811.2 4.911.3 4.311.6
46 3.411.4 3.711.3 3.111.3 3.611.8 3.411.4 3.711.3 0.810.9 0.911.1 4.411.8 4.212.1
55 1811.1 3.711.6 3.611.3 3.611.8 3.811.6 3.711.1 0.8±1.3 0.510.8 4.811.5 4.211.9 86 4.411.3 3.1±0.8 3.011.1 2.011.4 4.411.3 3.1±0.8 1.111.6 1.010.7 4.611.7 3.711.3
Table 7: Sensory evaluation for difference and preference tests
between control and abused frozen broad beans.
Storage time(days)
Difference test Preference test
Yes No Control Abused
32 8 2 7 3
46 8 2 7 3
55 7 1 4 4
86 9 0 7 2
4. CONCLUSIONS
This case study lead to the conclusion that broad beans quality is quiet susceptible to temperature
abuses. Even after cooking, the consumer can recognise the loss of quality in colour and texture
caused by temperature abuses occurred along the distribution chain.
5. ACKNOWLEDGEMENTS
The authors, R.C. Martins, B. Despró, and A.F. Molinari, gratefully acknowledge FCT for their
personal scholarships and Friopesca for their interest and help in the research.
This research work is part of a collaborative study coordinated by Dr. Leif Boegh-Soerensen from
the Danish Food Control Laboratory.
6. NOMENCLATURE
Subscripts
L*
degree of lightness
(0 to 100)
c
control sample
a*
ratio of green/red
(-60 to +60)
ab
abused sample
b*
ratio blue/yellow
(-60 to +60)
7. REFERENCES
AOAC, 1995, Official methods of Analysis, Supplement March 1996, Official Method no.
942.15.
Barth, M.M., Kerbel, E.L., Perry, A.K., Schmidt, S.J., 1993, Modified atmosphere packaging
affects ascorbic acid, enzyme activity and market quality of Broccoli, Journal of Food Science,
vol. 58, no. 1: p.140-143.
Drlange, 1994, Color review, Drlange application report n° 8.0e, U.S.A.
Eheart, M.S., Gott, C., 1965, Chlorophyll, ascorbic acid and pH changes in green vegetables
cooked by stir-fry, microwave, and conventional methods and a comparison of chlorophyll
methods, Food Technology, vol. 5: p.185-189.
Eheart, M.S., Odland, D., 1973, Quality of frozen green vegetables blanched in four
concentrations of ammonium bicarbonate. Journal of Food Science, vol. 38: p. 954-958.
Guadini, D. G., 1969, Quality and Stability in Frozen Foods, Pergamon Press, Oxford and New
20th International Congress of Refrigeration, 112/1IF, Sydney, 1999 7336