Feasibility of focal transcranial DC polarization with simultaneous EEG recording:
Preliminary assessment in healthy subjects and human epilepsy
Paula Faria
a,b,⁎
, Felipe Fregni
c, Fernando Sebastião
b,d, Ana I. Dias
e, Alberto Leal
f aCentre for Rapid and Sustainable Product Development of Polytechnic Institute of Leiria, Portugal bSchool of Technology and Management, Polytechnic Institute of Leiria, Portugal
c
Laboratory of Neuromodulation, Spaulding Rehabilitation Hospital & Massachusetts General Hospital, Harvard Medical School, Boston, MA, USA d
CM-UTAD, Centre for Mathematics of University of Trás-os-Montes e Alto Douro, Vila Real, Portugal e
Department of Pediatric Neurology, Hospital Dona Estefânia, Lisbon, Portugal f
Department of Neurophysiology, Centro Hospitalar Psiquiátrico de Lisboa, Lisbon, Portugal
a b s t r a c t
a r t i c l e i n f o
Article history: Received 5 May 2012 Revised 21 June 2012 Accepted 26 June 2012 Available online xxxx Keywords: EEG tDCS Polarization Epilepsy Transcranial SafetyWe aimed to investigate the feasibility of an experimental system for simultaneous transcranial DC stimula-tion (tDCS) and EEG recording in human epilepsy. We report tolerability of this system in a cross-over con-trolled trial with 15 healthy subjects and preliminary effects of its use, testing repeated tDCS sessions, in two patients with drug-refractory Continuous Spike-Wave Discharges During Slow Sleep (CSWS). Our system combining continuous recording of the EEG with tDCS allows detailed evaluation of the interictal activity dur-ing the entire process. Stimulation with 1 mA was well‐tolerated in both healthy volunteers and patients with refractory epilepsy. The large reduction in interictal epileptiform EEG discharges in the two subjects with epilepsy supports further investigation of tDCS using this combined method of stimulation and monitor-ing in epilepsy. Continuous monitormonitor-ing of epileptic activity throughout tDCS improves safety and allows de-tailed evaluation of epileptic activity changes induced by tDCS in patients.
© 2012 Elsevier Inc. All rights reserved.
1. Introduction
The demonstration that electrical DC polarization of the brain is able to change the neuronal discharges and evoked potentials in the cortex wasfirst made invasively in small animals[1,2]. Whether an increase or a suppression of neuronal activity was obtained depended on the polarity of the electrodes. The fact that the cathode produces suppression and the anode produces facilitation has been repeatedly demonstrated[3]. The observation that persistent anodal stimulation could produce paroxysmal activity, which could be suppressed by cathodal stimulation[4], suggested that cortical polarization might be a method with therapeutic applications in human epilepsy. The demonstration that the effects on cortical excitability outlast the stimulation period [5] further enhanced the expectations on the potential usefulness of the method. One of the first applications in human subjects following these previous experimental studies was in thefield of mental illness[6,7]. Although there were positive studies in some of the initial trials[8], results at this time are mixed (reviewed in[9]).
The recent use of neurophysiological methods to optimize the effects of tDCS in human subjects increased the clinical efficacy of this method[10–14]and has generated a renewed interest in the methodology of polarizing the brain to induce functional changes. In fact, the ability of tDCS to modulate the relation between cortical excitation and inhibition can be of potential usefulness in human epilepsy, a clinical condition where this relation is pathologically unbalanced. Recent demonstrations of the ability of weak direct cur-rents to modulate epileptiform activity in animal models of epilepsy were done, both in vitro[15]and in vivo[16]. Despite the encouraging results of the method, several practical issues remain unanswered, and until recently only four studies[17–20]have directly applied tDCS to patients with epilepsy. Indeed, the significant reduction in EEG epi-leptiform discharges in this study, after only one stimulation session (20 min, 1 mA), led us to test for enhanced methods to deliver tDCS in patients with epilepsy.
Given that the clinical use of tDCS in patients with epilepsy requires a detailed evaluation of its safety and tolerability profile, we present a sys-tem that may overcome some of the identified problems associated with the application of tDCS in human epilepsy using combined EEG–tDCS application. With this system it is possible to 1) continuously record the epileptogenic activity during the tDCS session; 2) reliably quantify the interictal events; and 3) optimize the stimulation electrodes con-figuration for different locations of the epileptogenic foci. In this study,
⁎ Corresponding author at: Campus 2, Morro do Lena, Alto do Vieiro, 2411‐901 Leiria, Apartado 4163, Portugal. Fax: +351 244820310.
E-mail address:[email protected](P. Faria).
1525-5050/$– see front matter © 2012 Elsevier Inc. All rights reserved.
http://dx.doi.org/10.1016/j.yebeh.2012.06.027
Contents lists available atSciVerse ScienceDirect
Epilepsy & Behavior
our goals were to (i) present a detailed explanation of this system; (ii) report its use and tolerability infifteen healthy subjects; and (iii) preliminarily test its use in two subjects with epileptic encephalopathies and Continuous Spike-Wave Discharges During Slow Sleep (CSWS), as a proof-of‐concept of this combined tDCS–EEG system.
2. Methods
2.1. Participants and patients’ descriptions
A group of 15 healthy volunteers (ages 20 to 32 years) was sub-mitted to the initial tests, with simultaneous recording of the EEG and tDCS. The goals of this experiment were as follows: (i) to test the tolerability of the stimulation over the central areas with currents of up to 1 mA and (2) to test the ability to recover a clean EEG recorded from electrodes near the stimulation points. We also tested our system in two patients with epileptic encephalopathy.
2.1.1. Patient 1
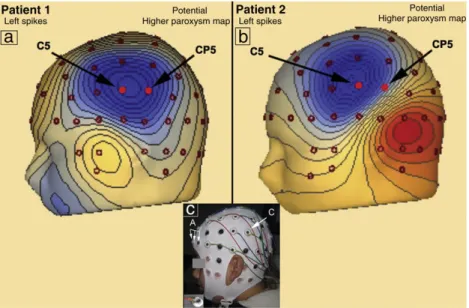
Patient 1 was an 11‐year-old male with CSWS and severe behav-ioral problems. A detailed clinical study of the patient that included long-term EEG monitoring demonstrated a persistent paroxysmal interictal activity in the central regions of both hemispheres during wakefulness that significantly increased, becoming almost continu-ous during sleep. A detailed characterization of the type and spatial distribution of the paroxysms on the scalp was obtained using high-resolution EEG with 82 electrodes. This study revealed the maxima of epileptiform EEG discharges in the regions of C5and C4
of the 10–10 international system (Figs. 1a and2a). A detailed anal-ysis of the temporal evolution of electric potential topography throughout the epileptiform EEG discharges resulted in identi fica-tion of two independent foci, one in each hemisphere (Fig. 2a). The MRI failed to demonstrate any structural lesion. The epilepsy of this patient proved refractory to pharmacologic therapy, and he was pre-viously found not to be a candidate for epilepsy surgery.
2.1.2. Patient 2
Patient 2 was a 7‐year-old male with Landau–Kleffner syndrome (LKS). This syndrome typically appears in previously healthy individuals that progressively lose receptive and expressive language, which
coincides with the appearance of paroxysmal activity in the EEG over the cortical language regions[21]. A detailed neurophysiological study of the patient showed moderate paroxysmal activity in the central regions of both hemispheres during wakefulness that increased sig-nificantly during sleep, evolving to CSWS. The high‐resolution EEG localized two types of epileptiform EEG discharges with distinct topography and maxima in the regions of electrodes C5and C6of the
10–10 international system (Figs. 1b and2b). The analysis of the tem-poral evolution of electric potential topography throughout the epilep-tiform EEG discharges identified an early focus in the left hemisphere (Fig. 2b) with secondary bilateral synchronization to the right hemi-sphere epileptiform EEG discharges. The MRI of patient 2 failed to demonstrate any structural lesion. The epilepsy of this patient also proved refractory to pharmacologic therapy, and he previously been found not to be a candidate for epilepsy surgery.
2.1.3. Ethical considerations
Written informed consent was obtained from the patients’ legal guardians and from all volunteers. This study was approved by the local ethics committee (Centro Hospitalar Psiquiátrico de Lisboa, Lisbon, Portugal).
2.2. EEG recording and processing
The EEG was recorded with AgCl sintered ring electrodes, 1.18 cm in diameter, snapped into adaptors placed at the 10–10 system posi-tions in a cap (Easycap, Herrsching-Breitbrunn, Germany), as shown inFig. 1c.
The scalp under each electrode was prepared with an abrasive compound (Skin Pure, Nihon Kohden Inc., Japan), and afterwards, a conductive gel (Electrocap Inc., Eaton, USA) was applied in each electrode. Stable impedances below 5 kΩ were consistently obtained. The signal was recorded with a 32-channel AC electroencephalograph (SynAmps, Neuroscan, Charlotte, USA), using a sampling rate of 500 Hz and high‐ and low-pass filters set to 0.5 and 70 Hz, respectively. The reference and ground electrodes were placed in the mastoid area contralateral to the stimulated hemisphere, and 24 EEG electrodes were used for recording (F8, F4, Fz, F3, F7, FC4, FC3, T4, C6, C4, C2, C1, C3,
C5, T3, CP4, CP3, T6, P4, Pz, P3, T5, O2, O1).
Fig. 1. Map of the electric potential of patients 1 (a) and 2 (b) on the highest value of the paroxysm at C5(left epileptiform EEG discharges). (c) A patient’s preparation for EEG re-cording and tDCS. A cap with electrodes at the 10–10 system positions was used, with the three anodes (A) at FP1, FPz, and FP2and the cathode (C) placed at CP5. A ring electrode placed on its adaptor is shown in the inset.
During tDCS, our constant current source (i.e., the DC stimulator, Phoresor 850, Iomed Inc., Salt Lake City, USA) constantly adjusted the potential difference between the two stimulation electrodes in
order to keep the intensity of the injected current constant. The visual analysis of the EEG revealed a high-frequency artifact in the elec-trodes in the neighborhood of the cathode. These artifacts were due
Fig. 2. Characterization of the temporal evolution of electric potential topography of patient 1 (a) and patient 2 (b) between the beginning and the end of the paroxysms. (a) Allows the identification of a stable topography in both hemispheres and shows that there is no evidence of any contralateral propagation. (b) Allows the identification of a stable topography in the left paroxysms but a topography with a contralateral initial component in the right paroxysms. This observation demonstrates the existence of a bilateral synchronization through the left hemisphere. The asterisks on thefigure identify the electric potential topography which corresponds to the closest point to the maximum value of the paroxysm.
to a very small AC component with a 12 Hz multiple period charac-teristic of the Phoresor 850 functioning. Online removal of the artifact induced by the tDCS was performed using the Acquire 4.3.3 software package developed by Neuroscan (Neuroscan, Charlotte, NC, USA) to remove gradient artifacts in the MRI environment with appropriate adjustment of the relevant parameters. The online removal of the ar-tifact significantly improved the readability of the EEG, but several high‐amplitude transients remained that could interfere with the cor-rect quantification of the epileptic activity in epilepsy patients. There-fore, offline artifact removal was performed using the Independent Component Analysis (ICA) with the Informax algorithm of EEGLAB
[22]. The coefficients of ICs with temporal dynamics closely matching those of the DC artifact, evaluated on simultaneous visual inspection, were set to zero and thefiltered signal was reconstructed. The offline removal based on ICA proved to be much more powerful in extracting the induced artifact, effectively recovering a clean EEG, even in the electrodes close to the cathode (Fig. 3).
2.3. Transcranial DC stimulation
DC current was applied through sintered AgCl electrodes such as the ones used for EEG recording (Fig. 1c). The scalp preparation and the application of conductive gel were performed as for the EEG electrodes, with impedances kept below 5 kΩ. Current was delivered by a Phoresor 850 current source, which provides currents up to 4 mA, with the possibility of ramping the intensity up and down in steps of 0.1 mA. In the present study, the current intensity used never exceeded 1 mA.
In both experiments (the one with the 15 healthy volunteers and the other with the patients with epilepsy), the three adjacent electrodes were shorted together and used as anodes (arrow A in
Fig. 1c) and a unique electrode as cathode (arrow C inFig. 1c), in order to decrease the intensity of anodal stimulation. In the healthy subjects experiment, they were placed close to the usual location for the stimulation of central areas– FP1, FPz, and FP2(i.e., above
con-tralateral eyebrow)– and for the same reason and also because no epileptogenic activity was apparent in the region of the anodes, they were positioned at the same place in the two subjects with epi-lepsy[11,23]. In the study of volunteers, the cathode was placed at a location (CP6) optimized for the stimulation of central areas in the left hemisphere, and in patients at CP5, as indicated by arrow C in
Fig. 1c. In the study of patient 1, we chose to stimulate the left hemi-sphere because he had two independent foci, one in each hemihemi-sphere. The right hemisphere was used as a control for this patient (Fig. 2a). In the study of patient 2, we chose to stimulate the left hemisphere
because it was the origin of both types of epileptiform EEG discharges (Fig. 2b). In both studies (the one with volunteers and the one with the patients with epilepsy), the goal was to induce local inhibi-tion with cathodal stimulainhibi-tion (anodal was considered the reference electrode and thus placed in a silent area). Current was ramped in steps of 0.1 mA, with a duration of 10 s each, until the target current of 1 mA.
The parameters of tDCS were defined as follows:
Experiment with healthy subjects: The experimental protocol involved three afternoon sessions per subject, each one of 15 min. In each session, EEG was continuously recorded through a resting period of 5 min, followed by the application of a constant current of 0.5 mA, 1 mA, or sham during 5 min, and afinal EEG resting peri-od of 5 min. Subjects were unaware of the current intensity applied. The order of stimulation was randomized and counterbalanced across subjects. In the sham session, the current was ramped up to 0.5 mA and down to 0 at the beginning of the session. A recovery period of 15 min was imposed between sessions. After each session, the volunteer classified the tolerability of the tDCS protocol in a scale of 1 to 5, where 1 was“I didn't feel anything” and 5 was “Intolerable”.
Experimental protocol for patients with epilepsy: Patients were submitted, once weekly, to three afternoon sessions of 30 min each. The protocol began immediately after the patient reached Stage 2 sleep, evaluated online by the clinical neurophysiologist (A.L.). In thefirst timepoint (timepoint 1 — baseline), the EEG was recorded during 10 min, after that, a current of 1 mA was injected during 10 min (timepoint 2— during tDCS), and afterwards, the EEG was recorded during the last 10 min (timepoint 3— post-tDCS). Because the goal was to conduct an initial assessment of this system in human epilepsy, we only tested active tDCS sessions so as to provide initial proof-of-principle data.
2.4. Data analysis
The effects of tDCS in the paroxysmal activity of the two patients with epilepsy studied at C5and C4(patient 1) and C5and C6(patient
2) were analyzed through the quantification of the number of epilepti-form EEG discharges per minute during the 10 min before (timepoint 1), during (timepoint 2), and after (timepoint 3) the tDCS session, in the three sessions performed. A single electrode was used to quantify a particular epileptiform EEG discharge type, and the selection was based on an amplitude criterion in which the highest amplitude electrode for each epileptiform EEG discharge type was used for
Fig. 3. EEG from a volunteer before (a) and during (b) tDCS at 1 mA. A large artifact during tDCS completely prevents evaluation of EEG features (horizontal scale 500 ms, vertical scale 200μV). (c) Offline removal of the artifact allows a clear reading of the EEG throughout the stimulation period.
quantification purposes. Note that this quantification process was only done when the patient was sleeping, which was confirmed by the neurophysiologist (A.L.) through the reading of the physiological wave patterns in the EEG. Statistical analysis was performed with the SPSS Statistics 17.0 (Chicago, Illinois, USA). Besides descriptive statis-tics, we used nonparametric tests; namely, the Mann–Whitney, the Kruskal–Wallis, and the Wilcoxon tests since the sample size for each patient is less than or equal to 30, and also because data normality is not verified in each timepoint. All the results were analyzed for a statis-tical significance level of 5%.
3. Results 3.1. Tolerability
The results from the 15 healthy volunteers revealed that tDCS, when current up to 1 mA is used, is a technique with high levels of tolerability, with only 2 of them reporting a mild discomfort when the maximal current of 1 mA was used. With 1 mA tDCS, participants reported DC application as“I didn't feel anything” (13%), “I felt some-thing” (40%), and “Tolerable” (33%) and none of them categorized it as“intolerable”. When a current of 0.5 mA was used, only one partici-pant reported this stimulation as“uncomfortable” and none considered this session“intolerable”. The sham tDCS session confirmed what was expectable, i.e., 93% of the participants did not feel anything; though some still reported a sensation.
3.2. Quantification of tDCS response on the epileptiform EEG activity Both patients tolerated the procedure well and reported that they felt something trying to wake them up, when the current was initially ramped up to 1 mA. Nevertheless, most of the times (5 out of 6 sessions) after a couple of minutes, they fell asleep. No adverse effects and no complex partial seizures or secondarily generalized seizures oc-curred before, during, or after the stimulation. The EEG obtained after offline artifact removal allowed the quantification, by an expert clinical neurologist (A.L.), of the tDCS response on the paroxysmal activity of the three sessions performed by the two patients. In this quantification process, an average reference montage in electrodes C5and C4, for patient
1, and C5and C6, for patient 2, was continually used during each session.
For simplicity, we will use the notation CxSyto indicate that the quanti
fi-cation was made at electrode Cxin session y, for x(electrode)={4,5,6}
and y(session)={1,2,3}, depending on each patient.
3.2.1. Quantification of the number of epileptiform EEG discharges for patient 1
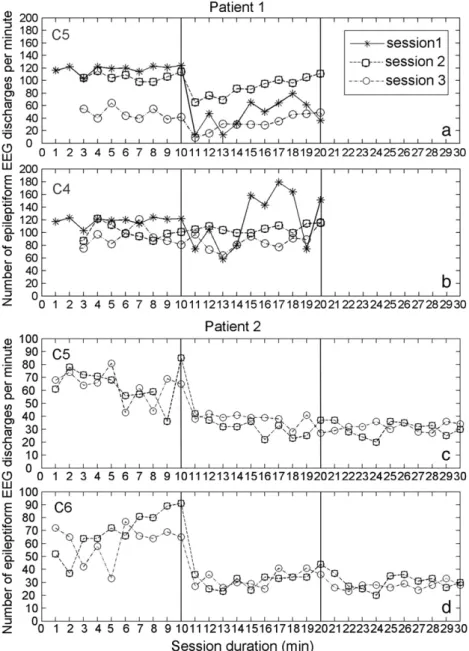
The number of epileptiform EEG discharges per minute at electrodes C5and C4was counted only when patient 1 was asleep. In timepoints 1
and 2 (baseline and during tDCS), for the three sessions, it was recorded for 10 min; except for sessions 2 and 3 (of timepoint 2), in which only 8 min was recorded. It was not possible to analyze the number of epileptiform EEG discharges in timepoint 3 (post-tDCS) for the three sessions, because the patient was awake, and did not return to sleep, making the quantification process impossible (Figs. 4a–b). Note also that this patient only had continuous paroxysmal activity during sleep (the visualization of the EEG physiologic sleep patterns was used to recognize the occurrence of sleep).
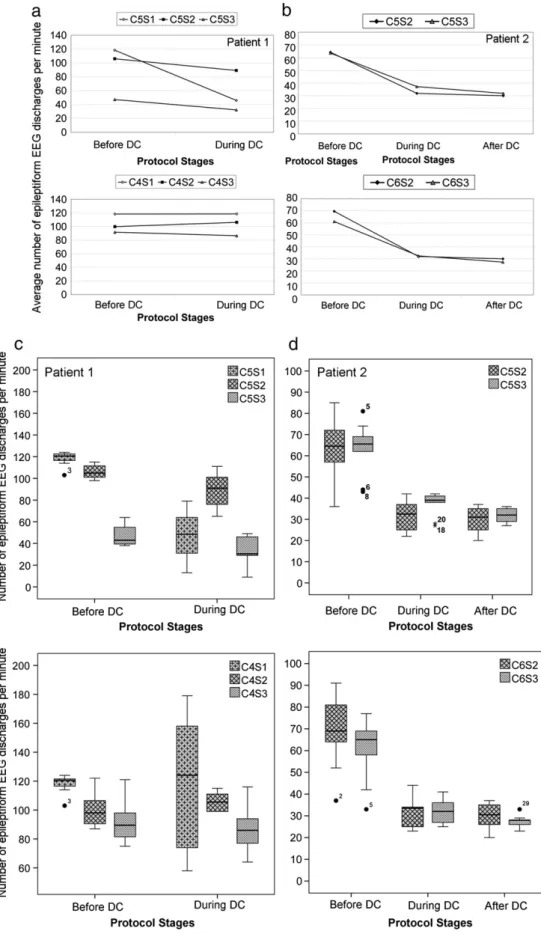
3.2.1.1. Data analysis— patient 1.Fig. 5a shows the temporal evolution of the average number of interictal epileptiform EEG discharges per minute at electrodes C5(Fig. 5a, up) and C4(Fig. 5b, down) of
timepoint 1 (before DC) and timepoint 2 (during DC) for the three sessions performed. The results show a reduction on the average number of epileptiform EEG discharges at electrode C5, from
timepoint 1 to timepoint 2, of 61%, 16%, and 32%, in the three sessions, respectively. At electrode C4 (contralateral hemisphere), almost
minimal change was found. The standard deviation of the number of epileptiform EEG discharges per minute of timepoints 1 and 2 in the three tDCS sessions was also counted at both electrodes C5and
C4, and it was smaller in timepoint 1 (C5S1: 6.2, C5S2: 6.4, C5S3: 9.6,
C4S1: 6.2, C4S2: 12, C4S3: 14.4) when compared with the values
obtained in timepoint 2 (C5S1: 22.4, C5S2: 15.4, C5S3: 13, C4S1: 45,
C4S2: 6.1, C4S3: 14.5), except on C4S2. The dispersion of the number
of epileptiform EEG discharges counted at electrodes C5(Fig. 5c, up)
and C4(Fig. 5c, down), in both timepoints 1 and 2, in the three
ses-sions was analyzed and can be seen inFig. 5c. The boxplots obtained present a low dispersion before tDCS in both hemispheres. The dis-persion increases during tDCS when compared to the previous period, mainly in session 1. A moderate outlier (black dot) was observed and kept in the analysis.
The nonparametric Mann–Whitney test was used to investigate whether there was a significant change in epileptiform EEG dis-charges when comparing across C5S1, C5S2, C5S3, C4S1, C4S2, and
C4S3, considering timepoints 1 and 2 (before and during tDCS,
respec-tively) of the three sessions at electrodes C5and C4. The results for the
C5electrode show that there is a significant decrease in the number
of epileptiform EEG discharges between timepoint 1 (before tDCS) and timepoint 2 (during tDCS) in all sessions (p-value≈0, p-value= 0.013, and p-value= 0.026, respectively), whereas, the results related to electrode C4show that the number of epileptiform EEG discharges
per minute is not significantly different between timepoints 1 and 2 in all sessions (p-value= 0.940, p-value = 0.090, and p-value= 0.423, respectively).
We also used the nonparametric Wilcoxon test (paired samples) to compare the number of epileptiform EEG discharges per minute in the same session in both hemispheres and both timepoints 1 and 2, i.e., the pairs C5S1–C4S1, C5S2–C4S2, and C5S3–C4S3. The results
showed the following:
1) before tDCS— in the two first sessions, no significant differences were found in both hemispheres (p-value≈1 and p-value= 0.079, respectively), whereas, in session 3 there were significant differences in both hemispheres (p-value = 0.012);
2) during tDCS— significant differences were found across the three sessions when comparing both hemispheres (p-value = 0.005 in all sessions).
3.2.2. Quantification of the number of epileptiform EEG discharges for patient 2
The number of epileptiform EEG discharges per minute at elec-trodes C5 and C6 was counted during the 10 min of the three
timepoints [before (1), during (2), and after (3) tDCS, respectively] for sessions 2 and 3.Figs. 4c–d shows the temporal evolution of the number of epileptiform EEG discharges only for sessions 2 and 3 because on thefirst session the patient did not sleep, making the quantification process impossible.
3.2.2.1. Data analysis— patient 2.Fig. 5b shows the temporal evolution of the average number of interictal epileptiform EEG discharges per minute at electrodes C5(Fig. 5b, up) and C6(Fig. 5b, down) of
timepoint 1 (before DC), timepoint 2 (during DC), and timepoint 3 (after DC) for sessions 2 and 3. The results show a reduction of the average number of epileptiform EEG discharges at electrode C5(50%
and 42% reduction from timepoint 1 to timepoint 2 and 6% and 14% from timepoint 2 to timepoint 3; of sessions 2 and 3, respectively). A similar reduction of the average number of epileptiform EEG dis-charges at electrode C6 (contralateral hemisphere) of 54% and 47%,
from timepoint 1 to timepoint 2, and of 6% and 16%, from timepoint 2 to timepoint 3, of sessions 2 and 3, respectively, was found. The standard deviation of the number of epileptiform EEG discharges per minute on the three timepoints of sessions 2 and 3, at electrodes C5and C6, was also quantified; showing also a decrease over time
(timepoint 1: C5S2: 13.7, C5S3: 11.9; C6S2: 16.8, C6S3: 13.6; timepoint 2:
C5S2: 6.6, C5S3: 5.3; C6S2: 6.4, C6S3: 6; and timepoint 3: C5S2: 5.7, C5S3:
3.3; C6S2: 5.5, C6S3: 2.8).
The dispersion of the number of epileptiform EEG discharges counted on electrodes C5 (Fig. 5d, up) and C6 (Fig. 5d, down) at
each of the three timepoints of sessions 2 and 3 was analyzed and can be seen inFig. 5d. The boxplots present a higher dispersion before tDCS in both hemispheres. The dispersion gets significantly low during DC stimulation when compared to the previous period and keeps almost stable between timepoint 2 (during tDCS) and timepoint 3 (after tDCS). Some moderate (black dot) and severe (black asterisks) outliers were observed and kept in the analysis. Due to the irregularity of the paroxysmal activity, two severe outliers found in C5S3(black
asterisks), during tDCS, were kept in the analysis.
The nonparametric Kruskal–Wallis test showed that there was statistical evidence to say that at least one timepoint is significantly different than the other timepoints in the two sessions and both hemispheres (all the p-values were approximately zero). Pairwise comparisons show that there were significant differences for the
number of epileptiform EEG discharges per minute between the timepoints: before–during and before–after in both sessions (all the p-values were approximately zero). We also found significant differ-ences on session 3, at the pairwise comparison during–after in both hemispheres (p-value = 0.003 at C5, p-value = 0.020 at C6).
We also used the nonparametric Wilcoxon test (paired samples) to compare the number of epileptiform EEG discharges per minute in both hemispheres and in the same session, i.e., the pairs C5S2–
C6S2and C5S3–C6S3in the three timepoints. The results showed the
following:
1) before and during tDCS— no significant differences were found be-tween the same sessions of different hemispheres (timepoint 1: p-value = 0.508 and p-value = 0.674; timepoint 2: p-value≈1 and p-value = 0.075, in sessions 2 and 3, respectively);
2) after tDCS— in session 2, no significant differences were found in both hemispheres (p-value≈1), whereas, in session 3, there were significant differences when comparing both hemispheres (p-value = 0.007).
Fig. 4. Number of epileptiform EEG discharges of patient1 and patient 2 per minute measured at electrodes C5(a) and C4(b) and C5(c) and C6(d), respectively, before (timepoint 1), during (timepoint 2), and after (timepoint 3) DC stimulation for the three sessions performed. The quantification was only made during patients' sleep. In each figure the vertical line separates the three timepoints analyzed.
Fig. 5. The temporal evolution of the average of the number of epileptiform discharges per minute of patient 1 at electrodes C5and C4(a) and of patient 2 at electrodes C5and C6 (b) at timepoints 1, 2, and 3 (before, during, and after DC stimulation). Boxplots of the number of epileptiform discharges per minute of both patients at electrodes C5and C4 at timepoints 1 and 2 (before and during DC stimulation) of the three sessions (patient 1, (c)), and at electrodes C5and C6at timepoints 1 to 3 (before, during, and after DC stimulation) of sessions 2 and 3 (patient 2, (d)).
4. Discussion
We implemented a system that allows the EEG to be recorded during tDCS and performed a controlled trial in healthy subjects to test the tolerability of this system and a proof-of-principle experi-ment in patients with focal refractory epilepsy. As far as we know, no studies have applied tDCS simultaneously with the EEG recording in patients with refractory epilepsy to date; therefore, we report the first study investigating the feasibility and proof-of-concept of tDCS in two patients with epileptic encephalopathies with CSWS, using the EEG recording concomitantly with tDCS. In the literature, to our knowledge, there is one study using EEG recording[17] but only before, immediately after, and a few days after tDCS.
The main motivation for developing this system was to assess safety during the application of tDCS in patients with epilepsy. This is particularly important given that effects of tDCS are widespread
[24–27], and in fact, it induced simultaneously an increase and de-crease of cortical excitability if a cephalic montage is used. Cathodal stimulation usually results in decreased excitability and neuronal discharge[1,2,5], and this effect has been demonstrated to depend on the direction of the current[2,3]and the orientation of the cortical surface relative to the current sources. In humans, the highly convo-luted nature of the cortical surface makes it difficult to predict the effect of tDCS on cortical excitability. In this setting, the continuous recording of EEG during stimulation offers a means for quick assess-ment of the effect of stimulation and the timely detection of undesirable responses.
With the current technology, it is not possible to calculate the intracranial distribution of the electricfield in tDCS in vivo, though we use the previous modeling work[23,27,28]to choose the best electrode configuration with EEG electrodes taking into account the region of the epileptic foci of patients and the value of the injected current.
The use of EEG electrodes for stimulation facilitates the integration of the recording and stimulation procedures. However, the main ad-vantage of this system is that the recording and the stimulation elec-trodes can all be placed close to the scalp projection of the cortical epileptic focus and within a few centimeters of each other, thus in-creasing the efficacy of stimulation and the sensitivity of the recording of the interictal activity, in a way that would not have been possible with the conventional large stimulation electrodes. Also, stimulation is more focal not only in the sense that a smaller brain volume under the EEG electrode is affected than when large electrodes are used (see[23,27,28]), but also in the sense that the current density under the single cathode is higher than under the larger anode electrode (using three EEG electrodes together). In fact, a few studies have shown that this method of stimulation (using small electrodes— also called HD-tDCS) is associated with significant effects on cortical excitability and pain threshold[29,30].
The main drawback of using EEG electrodes for stimulation is the higher electricfield in the scalp. The magnitude of the electric field at the edge of the electrode in contact with the scalp was estimated to be a factor of 6 larger than in the traditional configuration of two 35 cm2electrodes placed over the frontal and motor cortices[27].
On the other hand, the electrode-skin impedance can be easily moni-tored using the EEG recording system, and a low resistance (b5 kΩ) can be guaranteed. Additionally, there is a good temporal stability in the contact between the gel and the scalp and a more uniform contact between the two.
The study in 15 volunteers revealed good tolerability to currents of 1 mA using small electrodes. The low electrode-skin impedance as well as a more stable electrical connection to the scalp provided by the EEG gel as compared to the saline solution used in current experimental systems are improvements that, in our view, make the stimulation procedure more reliable. However, one significant issue with this design is blinding, since most of the healthy subjects
detected and reported some sensation during active stimulation. Similar to the situation for repetitive transcranial magnetic stimula-tion (rTMS), it may not be possible to fully blind subjects who under-go this method of EEG recording and application of tDCS with small electrodes.
The application of the presented system allowed a detailed quan-tification of the interictal paroxysmal activity in two patients with refractory epilepsy such as CSWS during slow-wave sleep and Lan-dau–Kleffner syndrome. The temporal evolution of the number of ep-ileptiform EEG discharges per minute at electrodes C5and C4(patient
1) and C5and C6(patient 2), during the 10 min before, during and
after tDCS, in the three sessions is presented inFig 4. As the paroxys-mal activity was evaluated only during sleep, in some of the sessions the quantification process was not possible (after stimulation in pa-tient 1).
This proof‐of‐principle investigation showed that tDCS is able to modulate the paroxysmal interictal activity in human epilepsy. Although our preliminary results have very limited data samples, they seem to confirm the notion that tDCS using smaller electrodes can also decrease the number of epileptiform discharges. The analysis of tDCS response in paroxysmal activity in patient 1 shows a reduction of approximately 40% from timepoint 1 to timepoint 2 of the number of epileptiform EEG discharges at electrode C5in the three sessions
held. The paroxysmal activity in electrode C4, on the contralateral
hemisphere, where the tDCS was not performed, did not change; thus, showing a focal effect of tDCS. The quantification of the number of epileptiform EEG discharges of patient 2 shows a reduction of ap-proximately 50%, from timepoint 1 to timepoint 2, of the paroxysmal activity, at electrode C5, which was consistent in the three sessions
performed. This paroxysmal activity reduced around 10% even after tDCS. The contralateral paroxysmal activity, measured at electrode C6, declined in a very similar way. In both patients, the results were
in agreement with the characteristics of each patient’s epileptic foci. Although atfirst glance the opposite change in dispersion of the data associated with tDCS between the two patients seems to indicate opposite results, they, in fact, represent improvement in both cases. The reason for the different results is based on the opposite baseline dispersion of the data.
The previous results are in contrast with the results of Varga et al.
[20], which found no effect of 20-minute tDCS in epileptiform EEG discharge reduction in a similar group of patients to our own. Stimulation was performed with the patients awake, and no record-ing of EEG durrecord-ing stimulation was performed. Other differences to our work are a less precise localization of the foci (based on 19 elec-trodes) and a less focal stimulation, as well as the fact that we quanti-fied epileptiform EEG discharges during and immediately after tDCS, which was applied during sleep. Overall, the two studies recorded epileptiform EEG discharge rates at different times in relation to tDCS which prevents a direct comparison of results. Finally our results are preliminary due to the limited data analyzed.
The results obtained for patients 1 and 2 are encouraging and demonstrate that it is possible to implement a tDCS system that is safe and well‐tolerated and has enough cortical polarization power to modulate epileptic activity focally. Because the cognitive and functional development of these patients are strongly affected by the paroxysmal activity[31], any contribution for its reduction may result in cognitive and functional gain for the patient. Nevertheless, the preliminary results from these two cases needs to be tested in a randomized sham-controlled trial properly powered. In addition, further studies should assess cognitive function before and after tDCS to investigate in detail the potential clinical gains of tDCS in the cognitive and functional realms.
In summary, thefindings of our study suggest that cathodal DC is safe and well‐tolerated in patients with refractory epilepsy. The preliminary results from these two subjects confirmed that this tech-nique decreased the excitability in the epileptogenic focus focally,
which is encouraging for the use of this technique in epilepsy. The proposed system opens interesting perspectives for the application of tDCS in the modulation of the epileptogenic foci in humans, allowing a detailed characterization of the EEG activity during the stimulation procedure and resulting in increased sensitivity and safety.
Acknowledgments
We are grateful to Daniela Dias, Heloisa Silva, and Ricardo Lopes for the technical support on the experimental acquisition of data and to Pedro Cavaleiro Miranda for the loan of the stimulation device used in the tDCS application. Paula Faria gratefully acknowledges the support by FCT, under grant No. SFRH/BD/29020/2006. Felipe Fregni is supported by a grant from CIMIT (Center for Integration of Medicine and Innovative Technology). Alberto Leal is supported by a grant for research in epilepsy from Tecnifar SA.
References
[1] Bindman LJ, Lippold OC, Redfearn JW. Long-lasting changes in the level of the electrical activity of the cerebral cortex produced by polarizing currents. Nature 1962;196:584-5.
[2] Creutzfeldt OD, Fromm GH, Kapp H. Influence of transcortical d-c currents on cortical neuronal activity. Exp Neurol 1962;5:436-52.
[3] Purpura DP, McMurtry JG. Intracellular activities and evoked potential changes during polarization of motor cortex. J Neurophysiol 1965;28:166-85.
[4] Goldring S, O'Leary JL. Experimentally derived correlates between ECG and steady cortical potential. J Neurophysiol 1951;14:275-88.
[5] Bindman LJ, Lippold OC, Redfearn JW. The action of brief polarizing currents on the cerebral cortex of the rat (1) during currentflow and (2) in the production of long-lasting after-effects. J Physiol 1964;172:369-82.
[6] Lippold OC, Redfearn JW. Mental changes resulting from the passage of small di-rect currents through the human brain. Br J Psychiatry 1964;110:768-72. [7] Redfearn JW, Lippold OC, Costain R. A preliminary account of the clinical effects
of polarizing the brain in certain psychiatric disorders. Br J Psychiatry 1964;110: 773-85.
[8] Costain R, Redfearn JW, Lippold OC. A controlled trial of the therapeutic effect of polarization of the brain in depressive illness. Br J Psychiatry 1964;110: 786-99.
[9] Lolas F. Brain polarization: behavioral and therapeutic effects. Biol Psychiatry 1977;12:37-47.
[10] Priori A, Berardelli A, Rona S, Accornero N, Manfredi M. Polarization of the human motor cortex through the scalp. Neuroreport 1998;9:2257-60.
[11] Nitsche MA, Paulus W. Excitability changes induced in the human motor cortex by weak transcranial direct current stimulation. J Physiol 2000;527:633-9.
[12] Nitsche MA, Paulus W. Sustained excitability elevations induced by transcranial DC motor cortex stimulation in humans. Neurology 2001;57:1899-901. [13] Priori A. Brain polarization in humans: a reappraisal of an old tool for prolonged
non-invasive modulation of brain excitability. Clin Neurophysiol 2003;114:589-95. [14] Brunoni AR, Fregni F. Clinical trial design in non-invasive brain stimulation psychiatric
research. Int J Methods Psychiatr Res 2011;20:e19-30, doi:10.1002/mpr.338. [15] Ghai RS, Bikson M, Durand DM. Effects of applied electricfields on low-calcium
epileptiform activity in the CA1 region of rat hippocampal slices. J Neurophysiol 2000;84:274-80.
[16] Liebetanz D, Klinker F, Hering D, et al. Anticonvulsant effects of transcranial direct-current stimulation (tDCS) in the rat cortical ramp model of focal epilepsy. Epilepsia 2006;47:1216-24.
[17] Fregni F, Thome-Souza S, Nitsche MA, Freedman SD, Valente KD, Pascual-Leone A. A controlled clinical trial of cathodal DC polarization in patients with refractory epilepsy. Epilepsia 2006;47:335-42.
[18] San-Juan D, Calcáneo Jde D, González-Aragón MF, et al. Transcranial direct current stimulation in adolescent and adult Rasmussen's encephalitis. Epilepsy Behav 2011;20(1):126-31.
[19] Yook SW, Park SH, Seo JH, Kim SJ, Ko MH. Suppression of seizure by cathodal transcranial direct current stimulation in an epileptic patient— a case report. Ann Rehabil Med 2011;35(4):579-82.
[20] Varga ET, Terney D, Atkins MD, et al. Transcranial direct current stimulation in refractory continuous spikes and waves during slow sleep: a controlled study. Epilepsy Res 2011;97(1–2):142-5.
[21] Shorvon S. Handbook of epilepsy treatment— forms, causes and therapy in children and adults. Blackwell Publishing Ltd; 2005.
[22] Delorme A, Makeig S. EEGLAB: an open source toolbox for analysis of single-trial EEG dynamics including independent component analysis. J Neurosci Methods 2004;134:9–21.
[23] Faria P, Leal A, Miranda PC. Comparing different electrode configurations using the 10–10 international system in tDCS: a finite element model analysis. Conf Proc IEEE Eng Med Biol Soc 2009;2009:1596-9.
[24] Lang N, Nitsche M, Paulus W, Rithwell J, Lemon R. Effects of transcranial direct current stimulation over the human motor cortex on corticospinal and transcallosal excitability. Exp Brain Res 2004;156:439-43.
[25] Datta A, Elwassif M, Battaglia F, Bikson M. Transcranial current stimulation focality using disc and ring electrode configurations: FEM analysis. J Neural Eng 2008;5:163-74. [26] Datta A, Bansal V, Diaz J, Patel J, Reato D, Bikson M. Gyri-precise head model of transcranial DC stimulation: improved spatial focality using a ring electrode versus conventional rectangular pad. Brain Stimul 2009;2(4):201-7.
[27] Faria P, Hallet M, Miranda PC. Afinite element analysis of the effect of electrode area and inter-electrode distance on the spatial distribution of the current density in tDCS. J Neural Eng 2011;8(6):066017, doi:10.1088/1741-2560/8/6/066017. [28] Miranda PC, Faria P, Hallett M. What does the ratio of injected current to electrode
area tell us about current density in the brain during tDCS? Clin Neurophysiol 2009;120:1183-7.
[29] Nitsche MA, Doemkes S, Karaköse T, et al. Shaping the effects of transcranial direct current stimulation of the human motor cortex. J Neurophysiol 2007;97(4):3109-17. [30] Borckardt JJ, Bikson M, Frohman H, et al. A pilot study of the tolerability and effects of high-definition transcranial direct current stimulation (HD-tDCS) on pain perception. J Pain 2012;13(2):112-20.
[31] Arzimanoglou A, Guerrini R, Aicardi J. Aicardi's epilepsy in children. Lippincott Williams & Wilkins; 2004.