ESTIMATION OF RABBIT HIND LEG MUSCLE WEIGHT AND
MUSCULARITY BY REAL TIME ULTRASONOGRAPHY
Silva S.R.1*, Guedes C.M.1, Mourão J.L.1, Venâncio C.2, Pinheiro V.1
1
CECAV, UTAD, PO Box 1013, 5001-801, Vila Real, Portugal 2
Department of Animal Science, Anatomy, UTAD, PO Box 1013, 5001-801 Vila Real, Portugal *Corresponding author: [email protected]
ABSTRACT
Forty-four New Zealand White x Californian rabbits were used to evaluate the real time ultrasonography (RTU) in assessing hind leg muscle weight and hind leg muscularity. For in vivo muscularity determination animals were scanned over the hind leg using a RTU machine equipped with a 5 MHz probe. The RTU images were taken on hind leg at three positions perpendicular to femur bone. At each position a section of hind leg muscle was analysed and the area of muscles was determined. The muscle volume of the hind leg was calculated by combining the muscle area measurements with the femur length. The weight of hind leg muscle was estimated from this volume of the hind leg and knowing the rabbit muscle density. Information related to hind leg muscle weight and femur length was used for hind leg muscularity. After scanning, animals were weighed, slaughtered and the reference carcass was cut. The right hind leg was dissected and the muscle was weighed and femur length was measured. The hind leg muscularity in carcass was calculated as previously described for RTU measurements. Correlations between the RTU measurements and their corresponding on carcass were determined. The LW varied from 1200 to 3410 g (average 2202 g) and reference carcass weight ranged between 561 and 1940 g (average 1199 g). The correlations between carcass and RTU hind leg muscle weight were high (r from 0.56 to 0.83, P<0.001) and the total hind leg muscle weight was the trait that presented the highest correlation between carcass and RTU measurements (r=0.83; P<0.001). Lower correlation coefficients were found for muscularity (r from 0.15, P> 0.05 to 0.46, P<0.01). Our results show that RTU is able to estimate hind leg muscularity and hind leg muscle weight of rabbits.
Key words: Rabbit, Carcass, Real-time ultrasonography, Hind leg muscularity.
INTRODUCTION
Rabbit meat is an important product in Mediterranean countries of EU. In recent years studies were focused on the selection of rabbits for growth rate, carcass characteristics and meat quality (Hernández et al., 2004; Pascual and Pla, 2007). The main criteria used to define rabbit carcass quality have been meat percentage in the carcass and the muscularity defined as the ratio between meat and bone (Blasco et al., 1984). Several studies have showed that meat-to-bone ratio of the leg or cutability attributes may be improved by selection (Lukefahr et al., 1982; Hernández et al., 2004). Hence evaluation of carcass traits for selection highlights the necessity of the use of the in vivo techniques. Although several non-invasive techniques using image analysis has been successfully used to evaluate carcass composition in animals (Stanford et al., 1998), few studies have been conducted on rabbits for carcass and body traits evaluation (Szendrö et al., 1992; Romvári et al., 1996; Kövér et al., 1998; Pascual et al., 2000; Cardinali et al., 2007). Moreover there was little information available on the use of techniques incorporating image analysis on muscularity and carcass evaluation of rabbits. Thus the objectives of the current work were to evaluate the RTU measurements in assessing hind leg muscle
MATERIALS AND METHODS
Animals and experimental design
Forty four weaned (5 weeks of age) rabbits (New Zealand White x Californian) fed ad libitum with a commercial pellet diet (crude protein, 16.3%; ether extract, 3.3%; neutral detergent fibre 23.3% and ash, 10.5% on dry matter basis) and with free access to water were used on this trial. The rabbits were housed in pens on deep litter in an air-conditioned closed building with a commercial light and temperature schedule. Animals were slaughtered between 70 and 90 days of age and live weight (LW), chilled carcass weight (CCW) and reference carcass weight (RCW) were recorded (Blasco and Ouhayoun, 1996).
In vivo real time ultrasonography measurements of hind leg and femur length
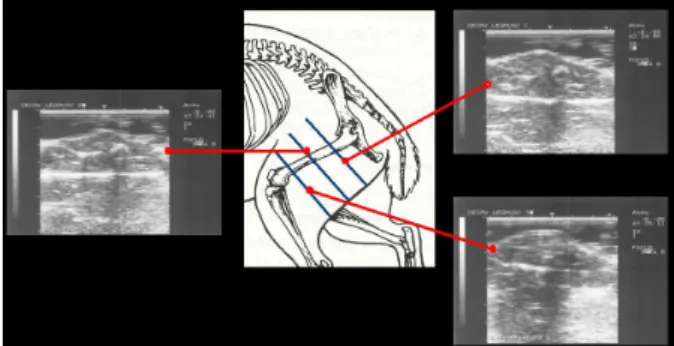
Prior to slaughter rabbits were restrained and ultrasound images were taken over the right hind leg in 3 measurement sites. At each measurement site it was obtained a section image of the hind leg (Figure 1). The fur at measurement sites was clipped close to the skin and shaved. A gel was used as a coupling medium. The images were taken using a 5 MHz linear probe (UST-588U-5, 64 mm) attached to an Aloka SSD 500V real time scanner. The probe was placed over the hind leg perpendicular to femur. Once a satisfactory image was obtained, it was captured on a video printer (Aloka SSZ-303E) for image analysis.
Figure 1: Representation of the three measurement sites over the hind leg and the respective
ultrasound images showing the sections of the hind leg
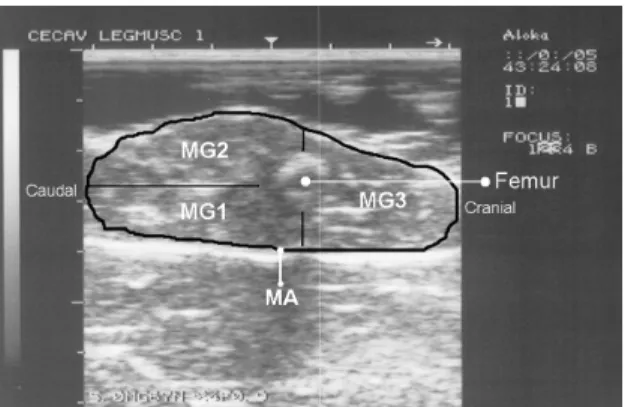
The printed images taken were digitized and RTU measurements were determined by image analysis using the NIH Image J software (NIH, Image J, http://rsb.info.nih.gov/ij/). At each hind leg section 4 muscle areas were determined: total muscle area (MA) and muscle groups 1, 2 and 3 areas (MG1, MG2, MG3) as indicated on Figure 2. The description of the muscle groups is presented below in the hind leg dissection subheading. The femur image was used as reference to obtain muscle areas of the 3 muscle groups. Using femur length and the muscle areas it was calculated the muscle hind leg volume. To achieve this femur length was divided by 3 and each length was multiplied by each of the three MA to calculate the muscle volume of each section. To convert muscle volume into muscle weight it was used the density value of 1.056 g/cm3 (Zhu et al., 2005). The hind leg total muscle weight was then calculate (SMG) as the sum of muscle weight in each section. The same procedures were used to calculate the weight of each muscle group. Linear measurement of femur length was taken from the hip joint to the stifle joint and was used for muscularity indices determination. The exact position of these endpoints was identified on animal by palpation on bone anatomical basis and the measurement was taken using a digital calliper.
Figure 2: Ultrasound image of hind leg section showing the areas of the three muscle groups (MG1,
MG2, MG3) and the total muscle area of all hind leg section (MA)
Hind leg dissection and femur length measure
The reference carcass was cut according to Blasco and Ouhayoun (1996). The right hind leg was dissected and the following variables were determined: muscle weight (MW), bone weight (BW), and dissectible fat weight (DFW). Three muscle groups (MG1, MG2 and MG3) were obtained from the hind leg and the major muscles of each group were separated, identified and their weights recorded. MG1 - M. semitendinosus, M. semimembranosus, M. gracilis and M. adductor; MG2 - M. gluteobiceps and M. biceps femoris; MG3 - M. quadriceps femoris (M. vastus medialis, M. vastus lateralis, M. vastus intermedius, M. rectus femoris) and M. tensor fasciae latae. The sum of these 3 muscle groups weights (SMG) was also determined. The length of the femur was measured with a digital calliper. The femur was measured as the distance from the central point on the head to the deepest point of the intercondylar fossa.
Hind leg muscularity measurements
The hind leg muscularity indices for in vivo and for carcass were derived using the approach of Jones et al. (2002a). The muscularity indices were based on the length of the femur and the muscle group weight and the sum weight of muscle groups. Thus it was calculated a muscularity indices for each muscle groups (ImG1, ImG2 and ImG3 for MG1, MG2 and MG3, respectively) and an indices for the sum (ImSG). For all hind leg muscularity measures it was used the following expression:
10 length femur weight group muscle 3 × Statistical Analysis
All analyses were performed using SAS (v. 8.2; SAS Inst., Inc., Cary, NC, USA). Correlations between the MG1, MG2, MG3 and SMG obtained by RTU and their corresponding on carcass and correlations between the hind leg muscularity indices obtained with RTU and the corresponding on carcass were established. The carcass and ultrasound measurements were analysed using repeated measures data of MIXED procedure with LW as a covariate according to the model: Yij = µ + Mi +
bLWij + Aij + εij; where µ is overall mean, Mi is the fixed effect of measurement, LWij is the covariate
LW, b is the linear coefficient of the covariate LW, Aij is the random effect of animal and εij is the
random error. Animal was used as repeated measures.
(31.0% for CCW and 32.4% for RCW). Overall, the hind leg traits are similar to those previously reported by Hernández et al. (2004) in studies where the rabbits had a LW similar to those used in the present study.
Table 1: Mean, standard error (SE), range and coefficient of variation (CV) for the weight of LW,
CCW, RCW and hind leg traits of rabbits (n = 44)
Mean (SE) Range CV (%)
LW (g) 2202 (87.4) 1200 - 3410 26.3 CCW (g) 1198 (65.3) 561 - 1940 31.0 RCW (g) 1059 (51.8) 472 - 1773 32.4 Hind leg Weight (g) 170 (7.6) 80.6 - 266.6 29.8 Muscle (g) 134 (6.6) 59.6 - 216.8 32.7 Bone (g) 26.9 (0.78) 15.6 - 34.5 19.3 Dissectacble fat (g) 3.5 (0.27) 0.6 - 8.0 52.1
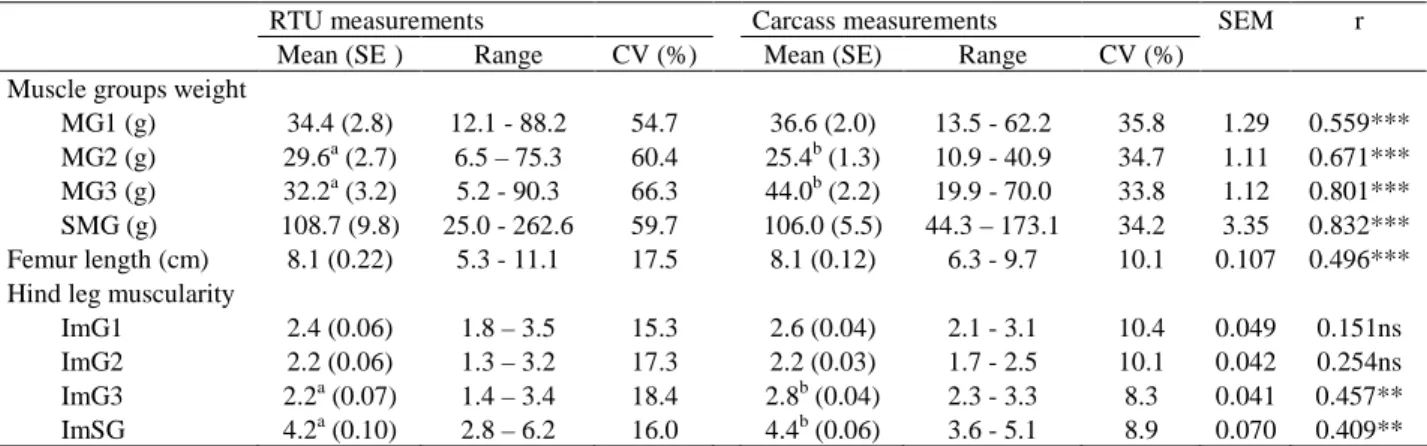
The mean, standard error (SE), range and coefficient of variation (CV) for muscle groups weight (MG1, MG2, MG3 and SMG), the femur length and hind leg muscularity indices of rabbits and the correlation coefficients (r) between RTU and carcass measurements are presented in Table 2. For muscle group weight, except for MG3, there is no significant difference between RTU and carcass measurements. For MG3 weight it was observed that carcass measurement was higher (P<0.05) than the RTU measurement. This difference was reflected in the corresponding hind leg muscularity indices. All RTU muscle group weights has a larger range than their corresponding in carcass. There are several explanations for these differences but the most of them arise from the muscle shape prior to slaughter and difficulties on image acquisition and on image analysis are widely referred for other species (Jones et al., 2002b). Nevertheless these difficulties, the correlation between carcass and RTU muscle group weights was high (r varied from 0.56 to 0.83, P<0.001). The SMG was the trait most strongly correlated between carcass and RTU (r=0.83, P<0.001). In our data, correlations between RTU and carcass hind leg muscularity indices reflect the correlations between muscle groups, but presented lower correlation coefficients (r varied from 0.15, P>0.05 to 0.46, P<0.01). As a result, it may be helpful to increase the closeness between in vivo and carcass muscle weight measurements by improving the procedures related to RTU and carcass measurements. This was in agreement with the observed by Jones et al. (2002b) in a study to predict sheep muscularity by X-ray computer tomography, whom pointed the need of high accuracy in the attainment of in vivo and carcass measurements procedures to found good muscularity prediction.
Table 2: The mean, standard error (SE), range, coefficient of variation (CV) for muscle groups weight
(MG1, MG2, MG3 and SMG), femur length and hind leg muscularity indices of rabbits and the correlation coefficients (r) between RTU and carcass measurements
RTU measurements Carcass measurements SEM r
Mean (SE) Range CV (%) Mean (SE) Range CV (%)
Muscle groups weight
MG1 (g) 34.4 (2.8) 12.1 - 88.2 54.7 36.6 (2.0) 13.5 - 62.2 35.8 1.29 0.559***
MG2 (g) 29.6a (2.7) 6.5 – 75.3 60.4 25.4b (1.3) 10.9 - 40.9 34.7 1.11 0.671***
MG3 (g) 32.2a (3.2) 5.2 - 90.3 66.3 44.0b (2.2) 19.9 - 70.0 33.8 1.12 0.801***
SMG (g) 108.7 (9.8) 25.0 - 262.6 59.7 106.0 (5.5) 44.3 – 173.1 34.2 3.35 0.832***
Femur length (cm) 8.1 (0.22) 5.3 - 11.1 17.5 8.1 (0.12) 6.3 - 9.7 10.1 0.107 0.496***
Hind leg muscularity
ImG1 2.4 (0.06) 1.8 – 3.5 15.3 2.6 (0.04) 2.1 - 3.1 10.4 0.049 0.151ns
ImG2 2.2 (0.06) 1.3 – 3.2 17.3 2.2 (0.03) 1.7 - 2.5 10.1 0.042 0.254ns
ImG3 2.2a (0.07) 1.4 – 3.4 18.4 2.8b (0.04) 2.3 - 3.3 8.3 0.041 0.457**
ImSG 4.2a (0.10) 2.8 – 6.2 16.0 4.4b (0.06) 3.6 - 5.1 8.9 0.070 0.409**
CONCLUSIONS
The correlations observed in the present study suggest the validity of RTU for measuring in vivo the hind leg muscle weight in rabbits. However it is necessary to improve the RTU and carcass hind leg muscle procedures to achieve better correlations for hind leg muscularity. Therefore further research is needed to improve the accuracy and the practicability of the use of RTU for hind leg muscularity determination.
REFERENCES
Blasco A., Estany J., Baselga M. 1984. Prediction of rabbit meat and bone weight using carcass measurements and sample cuts. Ann. Zootech., 33, 161–170.
Blasco A., Ouhayoun J. 1996. Harmonization of criteria and terminology in rabbit meat research. Revised proposal. World
Rabbit Sci., 4, 93–99.
Cardinali R., Dal Bosco A., Bonanno A., Di Grigoli A., Rebollar P.G., Lorenzo P.L., Castellini C. 2007. Connection between body condition score, chemical characteristics of body and reproductive traits of rabbit does. Livest. Sci. (In press). Hernández P., Aliaga S., Pla M., Blasco A. 2004. The effect of selection for growth rate and slaughter age on carcass
composition and meat quality traits in rabbits. J. Anim. Sci., 82, 3138–3143.
Jones H.E., Lewis R.M., Young M.J., Wolf B.T., Warkup C.C. 2002a. Changes in muscularity with growth and its relationship with other carcass traits in three terminal sire breeds of sheep. Anim. Sci., 74, 265-275.
Jones H.E., Lewis R.M., Young M.J., Wolf B.T. 2002b. The use of X-ray computer tomography for measuring the muscularity in sheep. Anim. Sci., 78, 387–399.
Kövér Gy., Szendrı Zs., Romvári R., Jensen J.F., Milisits G. 1998. In vivo measurement of body parts and fat deposition in rabbits by MRI. World Rabbit Sci., 6, 231–235.
Lukefahr S.D., Hohenboken W.D., Cheeke P.R., Patton N.M., Kennick W.H. 1982. Carcass and meat characteristics of Flemish Giant and New Zealand White purebred and terminal-cross rabbits. J. Anim. Sci., 54, 1169–1174.
Pascual J.J., Castella F., Cervera C., Blas E., Fernández-Carmona J. 2000. The use of ultrasound measurement of perirenal fat thickness to estimate changes in body condition of young female rabbits. Anim. Sci., 70, 435–442.
Pascual M., Pla M. 2007. Changes in carcass composition and meat quality when selecting rabbits for growth rate. Meat Sci.,
77, 474–481.
Romvári R., Milisits G., Szendrı Zs., Sørensen P. 1996. Non invasive method to study the body composition of rabbits by X-ray computerised tomography. World Rabbit Sci., 4, 219–224.
Stanford K., Jones S.D.M., Price M.A. 1998. Methods of predicting lamb carcass composition: A review. Small Ruminant
Res., 29, 241-254.
Szendrı Zs., Horn P., Kövér G., Berenyl E., Radnai I., Biróné-Németh E. 1992. In vivo measurement of the carcass traits of mean type rabbits by X-ray computerised tomography. Journal of Applied Rabbit Research, 15, 799–809.
Zhu E., Sassoon C.S.H., Nelson R., Pham R.H.T., Zhu L., Baker M.J., Caiozzo V.J. 2005. Early effects of mechanical ventilation on isotonic contractile properties and MAF-box gene expression in the diaphragm. J. Appl. Physiol., 99,