*Corresponding author: E-mail: [email protected]
Received: January 26, 2016 Approved: September 23, 2016
How to cite: Almeida ICC, Fernandes RBA, Neves JCL, Ruiz HA, Lima TLB, Hoogmoed W. Soil Quality after Six Years of Paper Mill Industrial Wastewater Application. Rev Bras Cienc Solo. 2017;41:e0160017.
Copyright: This is an open-access article distributed under the terms of the Creative Commons Attribution License, which permits unrestricted use, distribution, and reproduction in any medium, provided that the original author and source are credited.
Soil Quality after Six Years of Paper
Mill Industrial Wastewater Application
Ivan Carlos Carreiro Almeida(1)
, Raphael Bragança Alves Fernandes(2)* , Júlio César Lima Neves(2), Hugo Alberto Ruiz(2), Túlio Luís Borges de Lima(3) and Willem Hoogmoed(4)
(1)
Instituto Federal de Educação, Ciência e Tecnologia do Norte de Minas Gerais, Campus Teófilo Otoni, Minas Gerais, Brasil.
(2)
Universidade Federal de Viçosa, Departamento de Solos, Campus Viçosa, Minas Gerais, Brasil. (3)
Instituto Capixaba de Pesquisa, Assistência Técnica e Extensão Rural, Irupi, Espírito Santo, Brasil. (4)
Wageningen University, Wageningen, Netherlands.
ABSTRACT: The application of wastewater to irrigate soils may be an attractive option
for paper mills, especially when the effluents can also provide nutrients to plants. Since there could be negative environmental effects, such activity must be preceded by a
thorough evaluation of the consequences. The changes in soil quality of a Neossolo
Flúvico Distrófico (Typic Udifluvent) were evaluated over a period of six years of irrigation with treated effluent from a wood pulp company. Although effluent application for six years did not affect soil resistance to penetration and soil hydraulic conductivity, it
promoted a decrease in the mean size of aggregates and an increase in clay dispersion.
Effluent application increased soil pH but did not change exchangeable Caand Mg contents and organic carbon. After a full rotation of eucalyptus cultivation common
in Brazil (six years), no negative effects in tree growth were found due to effluent irrigation. However, effluent addition caused higher values of Na adsorption ratio and
intermediate electrical conductivity in the soil, which indicates a possible negative
effect on soil quality if the application continues over a longer period. Therefore,
a monitoring program should be carried out during subsequent crop rotations, and
alternatives must be studied to obtain better effluent quality, such as adding Ca and
Mg to the wastewater and using gypsum in the soil.
Keywords: industrial effluent, water reuse, clay dispersion, wastewater disposal, salinity.
INTRODUCTION
Brazilian paper mill industries have increased their activities to increase production levels to compete in supplying world paper demand. This process has increased the demand
for raw material, which consists essentially of wood from eucalyptus and pine (Pinus)
species. This higher demand for wood has led to the need for better management to increase forest productivity. In Brazil, irrigation of forests is under investigation because water availability for planted forests is considered the most limiting factor in a tropical climate, while solar radiation and temperature are not limiting.
The paper production process generates a considerable volume of effluents, which must
be treated before they can be disposed of in order to meet environmental standards. Therefore, disposal of these wastewater products through irrigation can be an attractive
alternative (environmentally as well as economically) for the final destination of these effluents, which currently are drained into surface waters. In addition to eliminating an
additional treatment process, the wastewater can be considered a source not only of water but also of supplementary nutrients (Rezende et al., 2010).
Studies on the use of different kinds of wastewater for irrigation have been reported by
various authors (Santos, 2004; Lado et al., 2005; Cavallet et al., 2006; Sousa et al., 2006; Fonseca et al., 2007; Gloaguen et al., 2007; Heidarpour et al., 2007). These studies focused
on effluent reuse for agriculture, mainly water from treated urban and industrial sewage.
A few studies assessing the use of waste from paper mill industries in soils are reported
in the literature (Chhonkar et al., 2000; Singh et al., 2002; Singh, 2007; Roy et al., 2008; Boruah and Hazarika, 2010; Rezende et al., 2010; Morris et al., 2012; Singh et al., 2013). However, studies on the reuse of paper mill industry effluents and their potential use in forest soils are scarce, especially for tropical soils and for effluents resulting from the
industrial Kraft bleaching process. This wastewater generally has a high concentration of Na and a high Na adsorption ratio. This can lead to increased Na content in the soil, thus
degrading the soil physical and chemical properties, and directly or indirectly affecting plant growth in a negative way. In clay soils, there is a risk of dispersion, decreasing
aggregate stability, resulting in poorer structure and lower soil porosity. Surface sealing and lower hydraulic conductivity will increase soil susceptibility to erosion.
The reuse of wastewater in forest soils is an interesting option considering the following aspects: forest trees are not a component of the human food chain; reuse of industrial water will improve the image of the company in regard to environmental conservation; trees demand more water as compared to other crops, so larger volumes of water can be applied to smaller areas; and trees have high C and N retention in their biomass (mainly
in the trunk), which represents an important long-term mechanism for storing these
elements in the ecosystem (Smith and Bond, 1999). These advantages of the reuse of wastewater from paper mill production on forest soil are strengthened by the generally short distance between factory facilities and forested areas.
The study reported here evaluates the use of effluents from the wood pulp industry that
uses the Kraft process for paper production. We hypothesized that prolonged wastewater
irrigation affects soil quality, changing soil physical and chemical properties. Specifically, the effects on the physical and chemical qualities of an Entisol soil planted to eucalyptus
over the full eucalyptus production rotation were assessed.
MATERIALS AND METHODS
Site location and treatments
The experimental site is located at 19° 18’ 23” S and 42° 22’ 46” W, 220 m above sea level in the municipality of Santana do Paraíso in the east central region of the state of Minas
system. Mean annual precipitation is 1,163 mm, the average annual temperature is 25.2 °C (maximum and minimum temperatures are, on average, 31.5 and 19.1 °C), and mean relative humidity is 65.2 %.
The soil of the lowland experimental area was classified as a Typic Udifluvent (Haplic Fluvisol Dystric by the FAO Soil Classification System) or Neossolo Flúvico Distrófico according to the
Brazilian Soil Classification System (Embrapa, 2006). A nearby area with forest vegetation
was considered as a control (T1), and experimental treatments were eucalyptus clones grown with no irrigation (T2), with irrigation from a regional stream (T3), with fertigation
(T4), and with application of the treated effluent (T5). Lime was applied in treatments
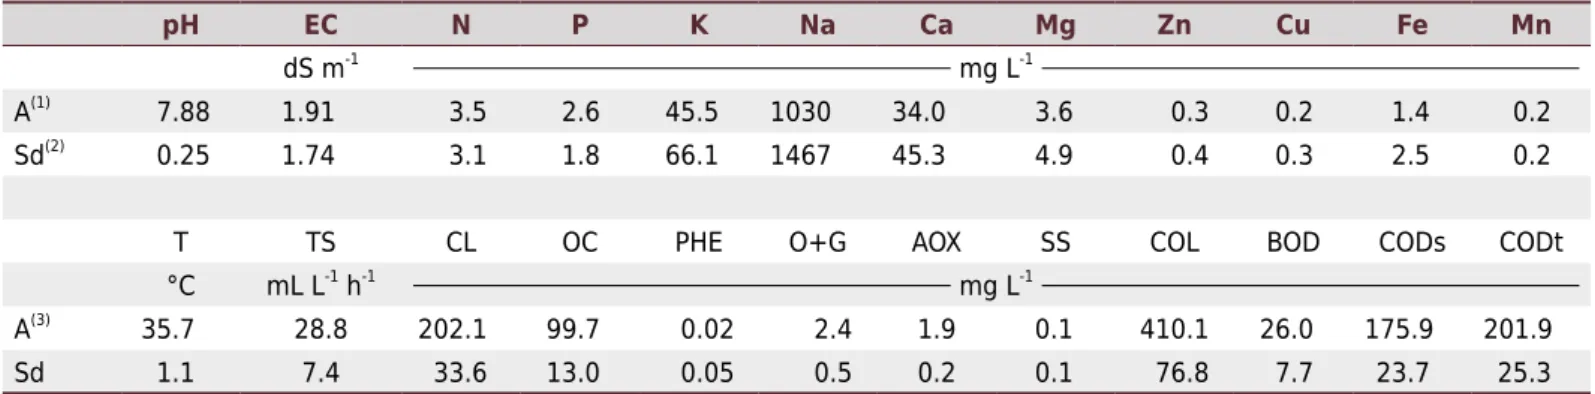
with eucalyptus as recommended (Ribeiro et al., 1999). The water used in T5 was from
an effluent treatment station with average composition, as shown in table 1.
Water (T3, T4, and T5) was applied through a drip irrigation system after prior filtering of
the water to preserve the dripper (and to prevent clogging). Irrigation rates were based
on the potential evapotranspiration (ET0) of the trees, estimated from the
Penman-Monteith equation based on local climate data.
The total study area was 4.92 ha. The experiment covered the full productivity rotation. All evaluations were carried out after six years of application of the treatments, representing
a full productivity rotation of 26 different clones of eucalyptus in Brazil.
Soil sampling
Soil samples were taken from the rows where the eucalyptus was planted, along the irrigation
lines. For the soil physical quality evaluation, disturbed and undisturbed soil samples were
collected in all treatments from the 0.00 to 0.10 m depth (depths where the greatest effects from effluent application are expected): four disturbed and compound samples (each one
from 20 simple samples) and forty undisturbed samples with cores of 98.17 cm3.
Laboratory and field assessment
The following properties of the soil samples were determined in the laboratory: texture by the pipette and sieving method (Ruiz, 2005); routine chemical soil analysis (pH in
water, Ca2+, Mg2+, K+, Na+, CEC, organic carbon, and exchangeable sodium percentage);
chemical characterization of soil saturated paste extract (SPE), with determinations of
electrical conductivity (EC), pH, Ca2+, Mg2+, Na+, K+, and calculation of sodium adsorption
ratio (SAR) (Richards, 1954); percent sodium saturation (PSS); organic carbon (Yeomans and Bremner, 1988); water-dispersible clay (WDC); clay dispersion index (CDI), i.e. the ratio of WDC to clay content; aggregate size distribution as estimated by the geometric
mean diameter (GMD) and mean weight diameter (MWD) (Nimmo and Perkins, 2002); particle density (Pd); bulk density (Bd); total porosity (TP=1-Bd∕Pd); microporosity (Mi)
Table 1. Chemical composition of the treated effluent from the paper mill industry
pH EC N P K Na Ca Mg Zn Cu Fe Mn
dS m-1
mg L-1 A(1)
7.88 1.91 3.5 2.6 45.5 1030 34.0 3.6 0.3 0.2 1.4 0.2
Sd(2)
0.25 1.74 3.1 1.8 66.1 1467 45.3 4.9 0.4 0.3 2.5 0.2
T TS CL OC PHE O+G AOX SS COL BOD CODs CODt
°C mL L-1 h-1
mg L-1 A(3)
35.7 28.8 202.1 99.7 0.02 2.4 1.9 0.1 410.1 26.0 175.9 201.9
Sd 1.1 7.4 33.6 13.0 0.05 0.5 0.2 0.1 76.8 7.7 23.7 25.3
EC: electrical conductivity; T: temperature; TS: total suspended solids; CL: chloride; OC: organic carbon; PHE: phenols; O+G: oils and grease; AOX: adsorbable organic halogens; SS: suspended solids; COL: color; BOD: biochemical oxygen demand (five days, 20 °C); CODs: chemical oxygen demand (soluble); CODt: chemical oxygen demand (total). (1)
Average of 2003 to 2007 values; (2)
Sd: standard deviation; (3)
from water retained in soil samples subjected to a potential of -0,006 kPa; macroporosity (Ma), as the difference between TP and Mi; and soil hydraulic conductivity (K0). The methods of analysis, where not indicated, were according to standardized methods (Donagema et al., 2011).
Further, the least limiting water range (LLWR) (Silva et al., 1994) of the soil was determined; for each treatment, forty undisturbed samples were obtained in metal rings of 0.05 m diameter and approximately 0.05 m height from the center of the 0.00 to 0.10 m depth layer. In the laboratory, the 40 cores were separated into 10 groups of four cores, and after saturation, each group was brought to equilibrium with one water potential using either a tension table (-0.004; -0.006; and -0.008 MPa) (Romano et al., 2002) or pressure chambers (-0.01, -0.03, -0.05, -0.07, -0.1, -0.5, and -1.5 MPa) (Dane and Hopmans, 2002). After equilibrium, soil resistance to penetration (SRP) was obtained in the center of each sample using an electronic cone penetrometer (Marconi, model MA-933, Brazil) - cone
diameter was 1.27 cm, cone angle was 30°, and cone surface area was 1.27 cm2. Samples
were then weighed, dried in an oven, and weighed again to calculate soil moisture (θ)
and Bd. The maximum SRP values obtained in each soil core were adjusted in relation to
Bd and θ using a nonlinear regression model: SRP = a × θb × Bdc, according to Busscher
(1990). The θ values were adjusted in relation to Bd and to soil water potential (ψ) using a nonlinear regression model: θ = e(d+e Bd)
× ψ × f (Tormena et al., 1998). Adjusted constants
(a, b, c, d, e, and f) for these equations were obtained using the software Statistica®.
The final LLWR graph was obtained using an Excel® algorithm (Leão and Silva, 2004).
In the field, hydraulic conductivity (K0) was estimated with a Guelph permeameter
(Reynolds et al., 1992), with four replicates, and the field SRP was verified with an impact
penetrometer up to a depth of 0.50 m, with 40 replicates.
Statistical analysis
The dataset was analyzed by four orthogonal contrasts (C) after the F test in order
to compare C1: no cultivation (T1) vs. cultivation (T2+T3+T4+T5); C2: no irrigation
(T2) vs. irrigation (T3+T4+T5); C3: irrigation with water (T3) vs. other irrigations
(T4+T5); and C4: fertigation (T4) vs. effluent application (T5). Statistica® was used in
all statistical analyses.
RESULTS AND DISCUSSION
Replacing the vegetation of the native forest with eucalyptus trees increased clay dispersion (WDC and CDI), increased Bd, and decreased aggregate size (GMD and MWD), causing a reduction in total porosity (Table 2). These results, indicated by the C1 contrast, are common and frequently observed when anthropic activities are implemented in soils, a result of forest management practices.
Although no changes were expected in texture, effluent application for six years (T5)
caused a decrease in soil clay and silt contents, as indicated by the C4 contrast. This
may be explained by the effect of the effluent on clay dispersion, causing this fraction to move deeper into the soil profile, considering the higher CDI and lower GMD and
MWD values for T5.
The flocculation effect of the effluent as a result of a higher soil saline concentration could negatively affect the degree of dispersion of the aggregates in laboratory analysis,
thus decreasing the clay content obtained; however, this is not supported by the WDC
values (Table 2). Increases of fine and coarse sands in the treatment with the effluent (T5) are directly associated with the decrease of the fine fractions clay and silt.
aggregate size, as shown by the GMD and MWD indices (contrast C4), corroborating the
dispersion tendency indicated by CDI values. Studies on the effect of effluent application
on aggregate size and stability are usually restricted to WDC and CDI determination. On the other hand, Levy et al. (2003) and Bhardwaj et al. (2007) could not verify the
supposed effect of effluent application on the aggregate stability of clay soils. The authors tested effluents from domestic sewage and concluded that the absence of any effect
was a result of its lower SAR value and the input of organic matter combined with the wastewater application.
Soil hydraulic conductivity (K0) data showed a discrepancy between laboratory and
field determinations (Table 2). This can be explained because the K0 estimation with a
Guelph permeameter was performed considering a multidirectional flow of the whole
soil at a 0.00-0.20 m depth, and the K0 determination in the laboratory considered only
the downflow through an undisturbed 0.05 m soil sample collected in a metal ring. Analyzing field data, the native forest (T1) exhibited lower K0 values than the other treatments cultivated with eucalyptus (contrast C1, Table 2). This may be due to the subsoiling of the eucalyptus plantation, which improves soil water movement in these
treatments, since the evaluation was made in the eucalyptus plant row. The high K0
observed in the water-irrigated treatment (T3), as determined by the significance of
the C3 contrast, is improbable and may be due to natural soil variability, commonly
verified in this determination. When data from the K0 determination in the laboratory was considered, the expected high values for the natural forest (T1) in relation to all
eucalyptus treatments was confirmed (contrast C1). For this determination, soil sampling
was done in all areas and not only in the plant row. In the laboratory, higher K0 values
were seen from the effluent treatment (T5) among treatments in which eucalyptus was planted, which was not verified in the field determination. This may suggest a positive effect of effluent application on soil structure, which is not confirmed by analyzing the
other soil physical properties evaluated.
As expected, the treatments with the effluent caused changes in soil chemical properties,
especially when comparing soil from native forest and eucalyptus plantations (contrast C1, Table 3). Removal of native vegetation caused a decrease in organic carbon (OC) and cation exchange capacity (CEC) (Table 3). The decrease in CEC in eucalyptus growing areas can be
linked to organic matter mineralization. The reduction in OC is also evident when comparing
non-irrigated (T2) and irrigated areas (contrast C2), as better moisture conditions lead to
higher microorganism activity, which will decrease the OC content. Although the effluent Table 2. Soil physical quality in response to the treatments evaluated, and contrast analysis among treatments
Treatment CS FS SIL Clay WDC CDI GMD MWD Bd TP Mi Ma K0 field K0 lab
% mm Mg m-3
m3 m-3
cm h-1 Forest vegetation (T1) 50 11 12 27 11 39 2.60 2.31 1.33 0.49 0.30 0.19 2.30 21.92 No irrigation (T2) 42 14 15 29 16 53 2.21 1.75 1.39 0.47 0.29 0.18 6.83 7.76 Water irrigation (T3) 39 18 16 27 15 54 2.48 2.01 1.38 0.47 0.29 0.18 11.75 10.26 Fertigation (T4) 30 20 20 30 17 52 2.49 1.95 1.37 0.47 0.30 0.17 3.27 7.24
Treated effluent (T5) 46 16 14 24 14 59 2.03 1.52 1.39 0.47 0.29 0.18 2.81 17.06
C1(1)
(-)** (-)*
(-)* (-)**
(+)**
(+)** (-)**
(+)**
(+)** C2
C3 (+)*
C4 (-)**
(+)* (+)*
(+)*
(-)**
(+)**
(+)*
(-)*
CS: coarse sand; FS: fine sand; SIL: silt; WCD: water-dispersible clay; CDI: clay dispersion index; GMD: geometric mean diameter; MWD: mean weight diameter; Bd: soil bulk density; TP: total porosity; Ma: macroporosity; Mi: microporosity; K0 field: soil hydraulic conductivity with Guelph permeameter; K0 Lab: saturated soil hydraulic conductivity. (1)
Contrasts: C1: native forest vs. eucalyptus; C2: non-irrigated vs. irrigated; C3: irrigated vs. fertigated; C4: fertigated vs. fertigated with effluent. **
contains considerable organic matter content, as indicated by the BOD values (Table 1), the
filtering needed for irrigation reduces the organic matter input, and increases in OC were not found after wastewater application. Another study did not find any increases in soil OC after application of the paper mill effluent (Lin et al., 2008). In contrast, an increase in OC content in an experiment carried out in lysimeters filled with soil after the application of paper mill
wastewater was associated with the dissolved lignin present in the residue (Singh et al., 2013).
No differences in soil Ca2+ contents were measured. This was an unexpected result
because liming was previously applied, and the effluent used had a high concentration
of this nutrient (Table 1). Naturally high contents of Ca2+ in the soil, as shown by the
native forest treatment (T1), eucalyptus extraction, and the high concentration of Na+
in the effluents can be considered in possible explanations. Na+ can displace Ca2+ by
mass effect, avoiding its sorption to soil sites.
Effluent application (T5) increased the soil Na+ content and soil pH, and decreased
the exchangeable Al3+. The higher Na+ content also increased the CEC, leading to an
exchange sodium percentage (ESP) of 11.68 % (Table 3). This phenomenon was also
observed in soil receiving urban sewage effluent (Santos, 2004). The higher ESP had an effect on clay dispersion. An ESP higher than 15 % is likely to affect soil structural and
hydraulic properties (Richards, 1954), and, although this limit was not reached in this
study, the results indicate a potential risk for structure deterioration. This supports the importance of a soil monitoring program in situations where effluent is applied, but this has to be considered only for particular soil-effluent combinations (Freire et al., 2003). Effluent application changed the soil SPE composition (Table 4). The wastewater caused
an increase in EC, pH, Na+, and SAR values, which can be directly associated with effluent
chemical properties (Table 1). The EC values did not change much, but high values of
SAR were found in the effluent treatment (T5). This is reason for concern, because it
indicates a low salt concentration combined with high Na+ contents in the soil solution.
High Na+ activity can cause an expansion of the diffuse double layer in the soil, favoring
soil dispersion. Furthermore, a possible effect on plants cannot be discarded, although
no negative signs were found in the eucalyptus trees after six years; however, it is not
known what the effect will be on the more susceptible seedlings of subsequent plantations.
The forested control area (T1) had higher Ca2+ and Mg2+ contents in the SPE than the
other treatments (Table 4), which is contrary to what was observed in the soil (Table 3). In the areas under eucalyptus, nutrient extraction was intense, decreasing the contents
of the more readily available forms of both cations. The lower contents of Ca2+ and Mg2+
in the treatment that received the effluent (T5) are also explained by substitution by
Na+ added in the effluent (mass effect).
Table 3. Soil chemical quality in response to the treatments evaluated, and contrast analysis among treatments
Treatment pH Ca2+ Mg2+ K Na ESP CEC OC
cmolc dm-3
mg dm-3
% cmolc dm-3
dag kg-1
Forest vegetation (T1) 5.05 2.10 0.41 81 4 0.18 8.03 2.32
No irrigation (T2) 5.77 2.63 0.80 118 14 0.91 6.79 1.80
Water irrigation (T3) 5.32 2.11 0.55 65 16 0.89 7.60 1.24
Fertigation (T4) 5.23 2.18 0.55 137 7 0.38 7.58 1.59
Treated effluent (T5) 6.02 2.16 0.70 130 170 11.68 6.33 1.28
C1(1)
(-)**
(-)**
(-)**
(-)**
(+)*
(+)**
C2 (+)*
(-)**
(-)**
(+)*
C3 (-)**
(-)**
(-)**
C4 (-)0
(-)**
(-)**
(+)* ESP: exchangeable sodium percentage; CEC: cation exchange capacity; OC: organic carbon. (1)
Contrasts: C1: native forest vs. eucalyptus forests; C2: non-irrigated vs. non-irrigated; C3: non-irrigated vs. fertigated; C4: fertigated vs. fertigated with effluent. **
, *
The potential risk of the effluent of causing soil salinity problems is clearly shown by
the EC, Na+, and SAR values in the SPE of T5. The contents of Na+ in the extract are
extremely high and determine the high EC and SAR values. Whereas the EC of T5 shows a two-fold increase compared to the fertigated treatment (T4), the SAR shows a 40-fold increase. This high SAR, associated with an intermediate EC value, is a serious threat to soil physical quality. Although the WDC values found were not yet a reason for alarm
(Table 2), this risk is present, as shown by the SAR and CDI values.
Adding Ca2+ and Mg2+ to the wastewater before soil application, and the use of gypsum,
can be advisable to avoid damages to soil structure in the longer term, as negative Na+ effects would be minimized; that way, SAR values can be reduced and flocculation can be improved. This is supported by studies showing that the application of urban
sewage effluent in soils of contrasting textures caused clay dispersion only in sandy soil
(Lado et al., 2005), which was related to the higher exchangeable Ca content present
in the clay soil, which was rich in CaCO3 (10 %).
Soils under eucalyptus showed a lower resistance to penetration (SRP) than the reference area (T1) (Figure 1). The subsoiling practice, as mentioned before, can explain this data. The higher SRP obtained in soil under the native forest is directly related to the lower
moisture verified in T1, and no subsoiling practice in this area. The lower SRP observed
in the fertigated treatment is attributable to the higher moisture present in T4. The data
obtained did not suggest effects from treatments on SRP. Indirect effects, however, can be associated with soil moisture as affected by the application of water or wastewater.
Table 4. Soil chemical composition of saturated paste extract in response to the treatments evaluated, and contrast analysis among treatments
Treatment pH Ca Mg K Na SAR EC
mg L-1
(mmol L-1 )1/2
dS m-1
Forest vegetation (T1) 4.2 149.9 32.3 35.0 10.7 0.21 0.9
No irrigation (T2) 5.1 56.8 18.2 17.7 8.3 0.25 0.4
Water irrigation (T3) 4.6 59.7 13.8 11.7 11.7 0.35 0.4
Fertigation (T4) 4.6 84.5 25.7 35.7 10.7 0.26 0.6
Treated effluent (T5) 6.5 37.5 13.8 23.0 300.0 10.60 1.2
C1(1) (-)** (+)** (+)** (+)** (-)** (-)** (+)*
C2 (-)**
(-)**
(-)**
(-)**
C3 (-)**
(-)**
(-)**
(-)**
(-)**
C4 (-)**
(+)*
(+)*
(+)**
(-)**
(-)**
(-)**
SAR: sodium adsorption ratio, given by SAR = Na+ × [(Ca2+ + Mg2+
)-1/2
]; EC: electrical conductivity. (1)
Contrasts: C1: native forest vs. eucalyptus forests; C2: non-irrigated vs. irrigated; C3: irrigated vs. fertigated; C4: fertigated vs. fertigated with effluent. **
and *: significant contrasts at 1 and 5 %, respectively. Signals (+) and (-) mean higher or lower averages in the same contrast, respectively, comparing the first term with the second one of the contrast.
-0.5 -0.4 -0.3 -0.2 -0.1 0
0 1 2 3 4 5
Dept
h
(m
)
Soil resistance to penetration (MPa)
0
0.10 0.15 0.20 0.25 0.30
Soil moisture (kg kg-1)
Eucalyptus + no irrigation Eucalyptus + irrigation Eucalyptus + fertigation Eucalyptus + effluent Forest (control)
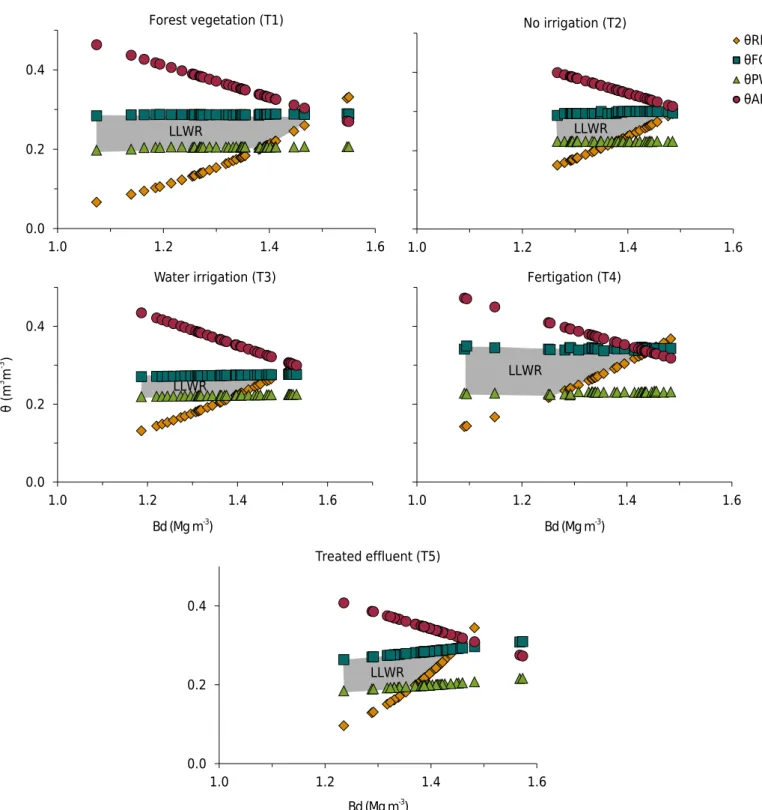
The LLWR is considered by some authors as the most appropriate for evaluating changes
in soil physical properties because it combines soil parameters affecting plant and root
growth development: Bd, aeration, SRP, and soil water retention (Tormena et al., 1998; Leão and Silva, 2004; Calonego and Rosolem, 2011), but not without criticism (de Jong
van Lier and Gubiani, 2015). The shaded areas in the graphs of figure 2 show the range
of moisture content where there are no limitations for the above parameters. The LLWR decreased under eucalyptus cultivation compared to the native forest (T1), particularly
in the treatments with no water or effluent irrigation. The decrease was smallest in the fertigation treatment (T4). Considering the critical soil bulk density (Bdc), i.e., the Bd value
Figure 2. Least limiting water range (shaded area) of treatments evaluated with a variation of water content as a function of soil bulk density (Bd), related to critical levels of field capacity (θFC; ψ = -0.01 MPa), permanent wilting point (θPWP; ψ = -1.5 MPa), minimum air-filled porosity of 10 % (θAP), and soil resistance to penetration of 2 MPa (θRP).
1.0 1.2 1.4 1.6
No irrigation (T2)
LLWR
0.0 0.2 0.4
1.0 1.2 1.4 1.6
Forest vegetation (T1)
θRP θFC θPWP θAP
LLWR
Bd (Mg m-3)
0.0 0.2 0.4
1.0 1.2 1.4 1.6
Treated effluent (T5)
LLWR
Bd (Mg m-3) Bd (Mg m-3)
1.6
1.0 1.2 1.4
Fertigation (T4)
LLWR
0.0 0.2 0.4
1.0 1.2 1.4 1.6
Water irrigation (T3)
LLWR
θ (m
3 m
where the LLWR reaches zero, and that adequate physical conditions for root development
no longer exist (Leão et al., 2004), no expressive differences were verified considering
all the treatments evaluated. The Bdc values obtained were 1.50, 1.50, 1.53, 1.44, and
1.46 Mg m-3 for the T1, T2, T3, T4, and T5 treatments, respectively. For all treatments,
the main controller of the amplitude of the LLWR was available water - the difference in soil moisture between field capacity and the permanent wilting point. After Bd values
of 1.3 to 1.4 Mg m-3, soil resistance to penetration corresponding to 2 MPa defined the
lower limit of LLWR. Air-filled porosity did not influence the range of the LLWR. Reduction in the amplitude of Bd values in the effluent treatment (T5), similar to no irrigation (T2),
did not indicate any favorable conditions for root development.
All results obtained suggest that paper mill effluents can be used for soil irrigation under
controlled conditions and through a continuous program for monitoring soil quality. However, it should be mentioned that not all possible contaminants of the wastewater used (e.g., organic compounds or heavy metals) were studied.
CONCLUSIONS
The reuse of treated wastewater from an industrial paper mill over a full eucalyptus
tree rotation affects soil quality, especially increasing soil Na+ content and soil pH. The
increase in soil Na+ concentration promoted by this effluent decreases aggregation indices
and increases the clay dispersion index. Provided there is no contamination from heavy
metals or pathogens, paper mill industry effluents can be used for eucalyptus trees under
controlled irrigation management and a continuous program for monitoring soil quality.
ACKNOWLEDGMENTS
This study was kindly supported by the Research Support Foundation of the State of Minas Gerais (FAPEMIG, project no. CAG-APQ-00792-08). We also thank the National Council for Scientific and Technological Development (CNPq) for grants and support,
and Celulose Nipo-Brasileira S.A. (Cenibra) for logistics and support in soil sampling. We
would like to thank C. Brustolini for assistance in lab measurements. We would like to thank C. Brustolini for assistance in lab measurements and G. Jesus and G. Gaudereto for field assistance.
REFERENCES
Bhardwaj AK, Goldstein D, Azenkot A, Levy GJ. Irrigation with treated wastewater under two different irrigation methods: effects on hydraulic conductivity of a clay soil. Geoderma.
2007;140:199-206. doi:10.1016/j.geoderma.2007.04.003
Boruah D, Hazarika S. Normal water irrigation as an alternative to effluent irrigation in
improving rice grain yield and properties of a paper mill effluent affected soil. J Environ Sci Eng.
2010;52:221-8.
Busscher WJ. Adjustment of flat-tipped penetrometer resistance data to a common water
content. Trans ASAE. 1990;33:519-24. doi:10.13031/2013.31360
Calonego JC, Rosolem CA. Least limiting water range in soil under crop rotations and chiseling. Rev Bras Cienc Solo. 2011;35:759-71. doi:10.1590/S0100-06832011000300012
Cavallet LE, Lucchesi LAC, Moraes A, Schimidt E, Perondi MA, Fonseca RA. Melhoria da fertilidade do solo decorrentes da adição de água residuária da indústria de enzimas. Rev Bras Eng Agríc Amb. 2006;10:724-9. doi:10.1590/S1415-43662006000300027
Chhonkar PK, Datta SP, Joshi HC, Pathak H. Impact of industrial effluents on soil health and agriculture - Indian experience: part I - distillery and paper mill effluents. J Sci Ind Res.
Dane JH, Hopmans JW. Pressure plate extractor. In: Dane JH, Topp GC, editors. Methods of soil analysis. Physical methods. Madison: SSSA; 2002. Pt 4. p.688.
de Jong van Lier Q, Gubiani PI. Beyond The ‘Least Limiting Water Range’:
Rethinking soil physics research in Brazil. Rev Bras Cienc Solo. 2015;39:925-39.
doi:10.1590/01000683rbcs20140593
Donagema GK, Campos DVB, Calderano SB, Teixeira WG, Viana JHM, organizadores. Manual de métodos de análise do solo. 2a ed. rev. Rio de Janeiro: Embrapa Solos; 2011.
Empresa Brasileira de Pesquisa Agropecuária - Embrapa. Centro Nacional de Pesquisa de Solos.
Sistema Brasileiro de Classificação de Solos. 2a ed. Rio de Janeiro: 2006.
Fonseca AF, Herpin U, Paula A, Victória RL, Melfi AJ. Agricultural use of treated sewage effluents: agronomic and environmental implications and perspectives for Brazil. Sci Agric.
2007;64:194-209. doi:10.1590/S0103-90162007000200014
Freire MBGS, Ruiz HA, Ribeiro MR, Ferreira PA, Alvarez V VH, Freire FJ. Estimativa do risco
de sodificação de solos de Pernambuco pelo uso de águas salinas. Rev Bras Eng Agríc Amb.
2003;7:45-52. doi:10.1590/S1415-43662003000200007
Gloaguen TV, Forti MC, Lucas Y, Montes CR, Gonçalves RAB, Herpin U, Melfi AJ. Soil solution chemistry of a Brazilian Oxisol irrigated with treated sewage effluent. Agric Water Manage.
2007;88:119-31. doi:10.1016/j.agwat.2006.10.018
Heidarpour M, Mostafazadeh-Fard B, Koupai JA, Malekian R. The effects of treated wastewater
on soil chemical properties using subsurface and surface irrigation methods. Agric Water Manage. 2007;90:87-94. doi:10.1016/j.agwat.2007.02.009
Lado M, Ben-Hur M, Assouline S. Effects of effluent irrigation on seal formation, infiltration, and
soil loss during rainfall. Soil Sci Soc Am J. 2005;69:1432-9. doi:10.2136/sssaj2004.0387
Leão TP, Silva AP, Macedo MCM, Imhoff S, Euclides VPB. Intervalo hídrico ótimo na avaliação
de sistemas de pastejo contínuo e rotacionado. Rev Bras Cienc Solo. 2004;28:415-23. doi:10.1590/S0100-06832004000300002
Leão TP, Silva AP. A simplified Excel®
algorithm for estimating the least limiting water range of soils. Sci Agric. 2004;61:649-54. doi:10.1590/S0103-90162004000600013
Levy GJ, Mamedov AI, Goldstein D. Sodicity and water quality effects on slaking of aggregates
from semi-arid soils. Soil Sci. 2003;168:552-62.
Lin CC, Arun AB, Rekha PD, Young CC. Application of wastewater from paper and food
seasoning industries with green manure to increase soil organic carbon: a laboratory study. Bioresour Technol. 2008;99:6190-7. doi:10.1016/j.biortech.2007.12.025
Morris LA, Sanders J, Ogden EA, Goldemund H, White CM. Greenhouse and field response
of southern pine seedlings to pulp mill residues applied as soil amendments. For Sci. 2012;58:618-32. doi:10.5849/forsci.09-055
Nimmo JR, Perkins KS. Aggregate stability and size distribution. In: Dane JH, Topp GC, editors.
Methods of soil analysis. Physical methods. Madison: SSSA; 2002. Pt 4. p.317-28.
Reynolds WD, Topp GC, Vieira SR. An assessment of the single-head analysis for the constant head well permeameter. Can J Soil Sci. 1992;72:489-501. doi:10.4141/cjss92-041
Rezende AAP, Matos AT, Silva CM, Neves JCL. Irrigation of eucalyptus plantation using treated
bleached Kraft pulp mill effluent. Water Sci Technol. 2010;62:2150-6. doi:10.2166/wst.2010.945
Ribeiro AC, Guimarães PTG, Alvarez V VH. Recomendação para o uso de corretivos e
fertilizantes em Minas Gerais. 5a Aproximação. Viçosa, MG: Comissão de Fertilidade do Solo do Estado de Minas Gerais; 1999.
Richards LA. Diagnosis and improvement of saline and alkali soils. Washington, DC: USDA; 1954.
Romano N, Hopmans JW, Dane JH. Suction table. In: Dane JH, Topp GC, editors. Methods of soil analysis. Physical methods. Madison: SSSA; 2002. Pt 4. p.692-8.
Ruiz HA. Incremento da exatidão da análise granulométrica do solo por meio da coleta da suspensão (silte + argila). Rev Bras Cienc Solo. 2005;29:297-300. doi:10.1590/S0100-06832005000200015
Santos APR. Efeito da irrigação com efluente de esgoto tratado, rico em sódio, em
propriedades químicas e físicas de um Argissolo Vermelho distrófico cultivado com capim-Tifton 85 [dissertação]. Piracicaba: Escola Superior de Agricultura “Luiz de Queiroz”, Universidade de
São Paulo; 2004.
Silva AP, Kay BD, Perfect E. Characterization of the least limiting water range of soils. Soil Sci Soc Am J. 1994;58:1775-81. doi:10.2136/sssaj1994.03615995005800060028x
Singh A, Agrawal SB, Rai JP, Singh P. Assessment of the pulp and paper mill effluent on growth,
yield and nutrient quality of wheat (Triticum aestivum L.). J Environ Biol. 2002;23:283-8.
Singh PK, Ladwani K, Deshbhratar PB, Ramteke DS. Impact of paper mill wastewater on
soil properties and crop yield through lysimeter studies. Environ Technol. 2013;34:599-606. doi:10.1080/09593330.2012.710254
Singh SK. Effect of irrigation with paper mill effluent on the nutrient status of soil. Int J Soil Sci.
2007;2:74-7. doi:10.3923/ijss.2007.74.77
Smith CJ, Bond WJ. Losses of nitrogen from an effluent-irrigated plantation. Aust J Soil Res.
1999;37:371-89. doi:10.1071/S98073
Sousa JT, Ceballos BSO, Henrique IN, Dantas JP, Lima SMS. Reuso de água residuária na produção de pimentão (Capsicum annuum L.). Rev Bras Eng Agríc Amb. 2006;10:89-96. doi:10.1590/S1415-43662006000100014
Tormena CA, Silva AP, Libardi PL. Caracterização do intervalo hídrico ótimo de um Latossolo Roxo sob plantio direto. Rev Bras Cienc Solo. 1998;22:573-81. doi:10.1590/S0100-06831998000400002