CLASSIFICATION OF FOREST ROADS AND DETERMINATION OF ROUTE
USING GEOGRAPHIC INFORMATION SYSTEM
1Fabrício Silva2, Luciano José Minette3, Amaury Paulo de Souza4*, Ângelo Casali de Moraes5 and Stanley
Schettino6
1 Received on 04.28.2015 accepted for publication on 03.12.2015.
2 Universidade Federal de Viçosa, Programa de Pós Graduação em Ciência Florestal, Viçosa, MG - Brasil. E-mail:
<fabricioardufv@gmail.com>.
3 Universidade Federal de Viçosa, Centro de Ciências Exatas e Tecnológicas, Departamento de Engenharia Elétrica e de Produção,
Viçosa, MG - Brasil. E-mail: <minette@ufv.br>.
4 Universidade Federal de Viçosa, Centro de Ciências Agrárias, Departamento de Engenharia Florestal, Viçosa, MG - Brasil.
E-mail: <amaury@ufv>.
5 Universidade Federal de Viçosa, Doutorado em Ciência Florestal, Viçosa - MG - Brasil. E-mail: <angelo.moraes@ufv.br>. 6 Universidade Federal de Viçosa, Programa de Pós Graduação em Ciência Florestal, Viçosa - MG - Brasil. E-mail:
<stanley.schettino@oi.com.br>.
*Corresponding author.
ABSTRACT – Geographic Information System (GIS) is an indispensable software tool in forest planning. In forestry transportation, GIS can manage the data on the road network and solve some problems in transportation, such as route planning. Therefore, the aim of this study was to determine the pattern of the road network and define transport routes using GIS technology. The present research was conducted in a forestry company in the state of Minas Gerais, Brazil. The criteria used to classify the pattern of forest roads were horizontal and vertical geometry, and pavement type. In order to determine transport routes, a data Analysis Model Network was created in ArcGIS using an Extension Network Analyst, allowing finding a route shorter in distance and faster. The results showed a predominance of horizontal geometry classes average (3) and bad (4), indicating presence of winding roads. In the case of vertical geometry criterion, the class of highly mountainous relief (4) possessed the greatest extent of roads. Regarding the type of pavement, the occurrence of secondary coating was higher (75%), followed by primary coating (20%) and asphalt pavement (5%). The best route was the one that allowed the transport vehicle travel in a higher specific speed as a function of road pattern found in the study.
Keywords: Forest transportation; Geographic Information System (GIS); Forest Planning
PADRÃO DAS ESTRADAS FLORESTAIS E DETERMINAÇÃO DE ROTAS
UTILIZANDO SISTEMA DE INFORMAÇÃO GEOGRÁFICA
RESUMO – O Sistema de Informação Geográfica (SIG) é uma ferramenta computacional indispensável no planejamento florestal. No transporte florestal, o SIG pode gerenciar os dados sobre a malha viária e capaz de resolver alguns problemas no transporte, como no planejamento de rotas. Portanto, o objetivo desse trabalho foi determinar o padrão da malha viária e definir rotas de transporte utilizando a tecnologia do SIG. O estudo foi realizado em áreas florestais do estado de Minas Gerais, Brasil. Os critérios utilizados para classificar o padrão das estradas florestais foram: geometria horizontal, geometria vertical e tipo de pavimento da via. Para determinar as rotas de transporte foi criado um modelo de análise de dados em rede no ArcGIS, utilizando a extensão Network Analyst. Neste modelo foram utilizados critérios de distância e tempo para determinar as rotas. Os resultados mostraram predominância de geometria horizontal das classes média (3) e ruim (4) indicando presença de estradas sinuosas. Para o critério geometria vertical, a classe relevo altamente montanhoso (4) possuiu a maior extensão das estradas. Quanto ao tipo de pavimentação a ocorrência de revestimento secundário foi maior (75%), seguido por revestimento primário (20%) e pavimento asfáltico (5%). A melhor rota foi a que permitiu ao veiculo de transporte trafegar em numa maior velocidade determinada em funçao do padrão da estrada encontrado no estudo.
1. INTRODUCTION
In Brazil, most of the timber is transported by road. Forest transport is one of the most expensive operations in forest enterprise, since transportation costs are directly related to their low specific value, and to the geographical location of forests and the place of consumption.
Besides the distance, transportation costs depend on other variables linked to characteristics of the network (CAVALLI; GRIGOLATO, 2010). According to Holzleitner et al. (2011), the average speed of trucks in various classes of functional roads, including duration in different phases of operation, is an important detail for the analysis of network services and costs of timber transport, as it is the basis for the development of productivity models, fleet management and decision support.
Holzleitner et al. (2011) mentioned that the cost efficiency in timber transport can be improved by reducing the travel time, increasing machine capacity and optimizing routes. In Finland, Palander et al. (2004), in order to reduce transport costs, utilized a method to minimize return routes with empty trucks in a system of wood supply for energy generation. However, for analysis and optimization of travel time, the knowledge of all processes and attributes of forest road network is important factors in the forest transport flow.
In this context, given the current competitive scenario, many forest companies have invested in new technologies and research to reduce costs in forest transport. In general, the use of computational approaches is one of the main tools used to solve some complex problems in timber transport, enabling the rationalization of resources, deadline accomplishments, time and labor saving, and especially ensuring the meeting of market demand.
Among the computational tools used in forestry planning is the Geographic Information System (GIS), which consists of a system that uses spatial information about the location of some attributes of the earth’s surface, allowing the management of data to assist in decision making.
The GISs are recognized as a technology that can be usefully applied to support the choosing of the best routes for transport vehicles (KEENAN, 2008). Network analysis is a potentially powerful approach
in GIS able to solve transportation problems and route planning (AKAY et al., 2012). This type of spatial analysis allows the GIS environment to calculate the optimal network path. (NIARAKI, 2011).
Devlin et al. (2008) examined the timber transport routes through GIS and GPS (Global Positioning System) in terms of classification of roads, distance, and speed and time course in order to improve efficiency of timber transport in Ireland.
Therefore, this study aimed to determine the pattern of forest roads and set transport routes by using the Geographic Information System (GIS).
2. MATERIAL AND METHODS
The present research was conducted in a forestry company in the state of Minas Gerais, Brazil. The study area lies among coordinates 735,517 m E, 7,845,468 N and 734,489 m E, N 7,845,243m in UTM coordinate system, Zone 23, central meridian 45º, in the geodetic datum SIRGAS 2000.
The base map was prepared in the ArcGIS 10.2 environment (ESRI, 2013), being ArcMap and ArcCatalog the main components used. The database consisted of the following information: forest roads, altimetry data from the forestry company and altimetry data from TOPODATA (VALERIANO, 2014).
2.1. Pattern of forest roads
The pattern of forest roads is an important factor that influences the costs of construction, maintenance and transport. The parameters stablished for setting up the pattern of forest roads give rise to a combination of the main technical factors that affect the performance of timber transport vehicles, given primarily through horizontal and vertical geometry, and the surface quality of the road.
2.1.1. Horizontal geometry
In order to classify the roads by its horizontal geometry, it was calculated the horizontal geometry index, which is a ratio of the average radius of horizontal transition curves of a variable segment of the road and the number of curves per kilometer, according to Equation 1 (FAO, 1998):
(1)
Where: GH = horizontal geometry; R = mean radius of curve(s) from a variable road segment (m); NC = number of turns per kilometer.
The horizontal geometry classes were established in four categories, depending on the horizontal geometry index value shown in Table 1:
2.1.2. Vertical geometry
The classification of forest roads regarding its vertical geometry was made according to the slope percentage of the road. Table 2 shows the four classes agreed.
2.1.3. Coating or pavement type
The pavement corresponds to a layer overlying the surface and is designed to resist the impact coming from traffic. Three classes of pavement for forest roads were considered:
• Paved roads: roads are covered with asphalt layer have a better construction pattern, and allow vehicle traffic throughout the whole year.
• Roads with primary coating: roads are covered with a granular layer composed of natural and/or artificial aggregates, which are applied on the compacted subgrade with the function of ensuring the traffic of vehicles throughout the year.
• Uncoated Roads: roads that do not present any type of coating; therefore, vehicular traffic only occur at certain times of year.
2.2. Transport routes
After editing the base vector and ensuring the topological consistency of the arc-node network model, two impedance values in the attribute table of each arc segment were calculated, one with speed (equation 2) and one with time values (equation 3) given in seconds to travel each segment. The maximum speed was limited to 60 km·h-1.
Where: a = vehicle speed in km·h-1; P = Potency
of the maximum engine torque hp (horse power); m = total mass in kg; r = tilt angle of the ramp; g = gravity acceleration, 9.8 m·s-2; h = horizontal geometry factor
(class 1 = 1, Class 2 = 0.95, Class 3= 0.90, Class 4 = 0.85); u = rolling resistance coefficient (asphalt = 0.01; primary coating = 0.03; uncoated = 0.06). The standard vehicle considered in this study has a power output of 350 hp maximum torque and a total weight of 53,000 kg (loaded).
Where:t = time in seconds; d = distance in meters; v = speed in km·h -1.
To determine transport routes, a network data analysis model was created using the ArcGIS Network Analyst extension. The network analysis allows it to obtain routes from user defined points using the impedance assigned to the arcs, such as distance and travel time. The Network Analyst allows the user to find the best way to get from one location to a destination point. The locations can be specified interactively by the user. To find an optimal path, the best way may be the fastest or shortest, depending on the chosen impedance. This study used two kinds of impedance to set the optimum path; one was travel time (for faster routes) and the other was distance (for shorter routes). Thus, two simulation routes were carried out starting with a certain point in the studied area, and reaching a timber consumption point.
Class Classification GH
1 Excellent > 48
2 Good 25 – 47
3 Average 10 – 24
4 Bad < 10
Tabela 1 – Classes de geometria horizontal (GH).
Tabela 1 – Horizontal alignment classification.
Source: Lopes, E. S. et al, 2002.
Tabela 2 – Classe de geometria vertical ou greide.
Table 2 – Vertical alignment classification.
Class Type slope percentage
1 flat relief < 5 %
2 wavy relief 5 – 9 %
3 mountainous relief 9,1 – 12 %
4 highly mountainous relief > 12%
(2)
(3) t = 3,6 v.d
v
= m g sen2647,8 ·( )+u m g cosP·h ( )3. RESULTS 3.1. Road network pattern
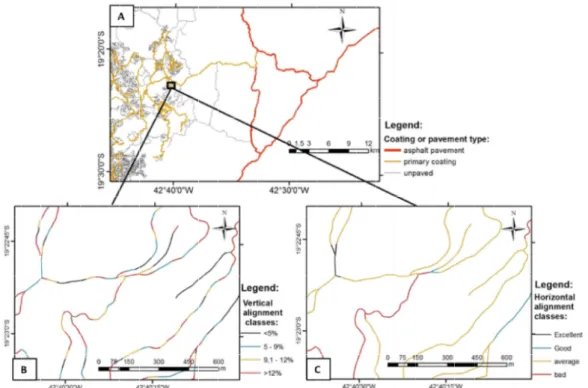
Figure 1 shows the maps with classification of forest roads based on three technical parameters: pavement type (A), vertical geometry (B) and horizontal geometry (C).
The map provided by Figure 1-A illustrates roads surfaced with asphalt, primary coated and uncoated. On the thematic map that emphasizes vertical geometry (Figure 1-B), classes 1 to 4 represent roads with flat, undulated, hilly, and highly mountainous vertical geometry, respectively. Differently, the map related to the horizontal geometry (Figure 1-C) illustrates classes 1 to 4 in the following order of quality: excellent, good, average and bad.
The total length for each type of road pavement was: 77.2 km (5.0%) for paved surface road; 331.0 km (20.1%) for primary coating and 1159.9 km (74.9%) for uncoated roads. The length of roads in each horizontal geometry class was: 2.3 km (0.2%) in class 1; 146 km (9.4%)
in class 2; 1154.4 km (74.6%) in class 3 and 245.3 km (15.8%) in class 4, totaling 1548.1 kilometers of roads. The total length of roads in each vertical geometry class was: 361.7 km (23.4%) in class 1; 350.7 km (22.6%) in class 2; 208.0 km (13.4%) in class 3, and 627.7 km (40.6%) in class 4. Figure 2 shows a map with roads and speed standards (km · h-1) for each arc segment in the forest road network
based on the vehicle model. These impedance values are fundamental for the identification of better operating performance routes; in other words, they are especially important to minimize the amount of the attribute time. The pattern of major performance is associated with roads that have the best conditions regarding technical factors (horizontal and vertical geometry, and pavement type).
3.2. Transport routes
Figure 3 shows a simulation for transport routes using network analysis tool. The route with shortest distance (Figure 3-A) starts at the sampling location in point 1 and ends at the place of timber consumption
Figure 1 – Forest road network classification: type of pavement (A); Vertical (B) and horizontal(C) alignment of forest roads.
at point 2. The shortest distance route indicated in red (Figure 3-A) has a total length of 64.7 km and an average travel speed of 17.4 km·h-1.
The same points at the beginning and end of the simulation from the route contaning the shortest distance were adopted for route determination using the operating performance criterion of the vehicle designed for transportation. The fastest transportion route (Figure 3-B), indicated in blue, has a total length of 65.0 km and an average speed of 18.4 Km·h-1. This route provided
lower travel time of approximately 11 min in relation to a shortest route.
4. DISCUSSION
In accordance with the classification of horizontal geometry of roads, the high concentration of forest roads in classes 3 (average) and 4 (bad, below average) is remarkable, while small parts of the roads were classified as good (class 2) and excellent (Class 1) regarding horizontal geometry.
The passages containing horizontal geometry classes 1 and 2 allow a better performance of transport vehicles, once straight avenues are prevalent. Roads with these characteristics guarantee a longer distance visibility for the driver, providing more security in addition to favoring a shorter travel time. By contrast, in road sections with a lot of sinuous and very small bending radius, the operating speed should be lower and the risk of collisions is larger. A study conducted by O´Connor (2011) demonstrated that isolated curves offer great risk to users on the roads, a fact that was confirmed by data collisions on the roads of Ireland. The predominance of classes 3 and 4 may be explained by the rugged topography of the region. In these passages, it is necessary to transpose that geographical barrier; therefore, there is a higher occurrence of curves, since they seek to circumvent mountains in order to get to from on point to another.
Regarding the vertical geometry, the results indicated that there was a predominance of highly mountainous relief pattern (Class 4). Class 1, represented by flat relief, had a length of 361.7 km; followed by the wavy relief (Class 2) with 350.7 kilometers of roads and finally mountainous relief (class 3) with 208.0 km, totaling 1548.1 kilometers of roads.
Figure 2 – Vehicle speed as a function of the forest road network Pattern.
Figura 2 – Velocidade do veículo em função do padrão das estradas florestais.
Figure 3 – Transportation routes determined by the Network Analyst: smaller distance transportation route (A) and fastest route (B).
The routes which are classified as flat and wavy (classes 1 and 2) improve transportation efficiency and performance, provided that the other characteristics of the roads are favorable.
In regions where the terrain is classified as hilly or highly mountainous (classes 3 and 4), in addition to the slower transport and its impact on travel time, there is a tendency of increased wearing and tearing of vehicle components. According to Machado et al. (2009), from an economic point of view of road construction, one should opt for steeper vertical alignments in order to reduce the extent; nonetheless it can lead to a drastic increase in transportation costs and maintenance due to the difficulties imposed by this geographical barrier. Additionally, the option for less steep slopes tend to be safer because it reduces the chance of mechanical failures caused by excessive wear and tear imposed by the longitudinal profile of the relief.
According to the rating maps, it is possible to observe that the best horizontal or vertical geometry classes are generally associated with roads with greater constructive pattern, i.e., those coated with asphalt layer or primary coating.
Most roads are classified without any coating, and only about 5% are classified as a type of asphalt pavement, which reflects a lower cost of construction. In a study of characterization and extension of a forest road network in Italy, Cavalli and Grigolato (2010) showed that 48% of forest roads were paved and 52% of the road network was unpaved.
The network analysis model developed in this study makes it possible to include some restrictions, such as traffic direction and impediment to traffic (roads with pronounced vertical profile, impassable places according to the time of year, and maintenance in places); but this could restrict the alternatives routes considerably. The routes designated for timber transport using the operational performance criterion allow the transport vehicle to develop a higher average speed of travel (18.4 km · h-1) in comparison to the criterion of smallest
distance (17.4 Km · h-1), which consequently reduced
the travel time from the forestry point of harvest to the point of consumption. However, the distance criterion is still widely used in the routing of timber transport vehicles. For example, Martins et al. (2001), using ArcView to designate timber transport routes in Ireland, mentioned
that 46% of the routes that were used in timber transportation were identified as transport routes of shortest distance according to network analysis. According to the results, route selection using the operating performance tends to select the roads with the best technical characteristics, which may result in a reduction of the operating cycle, lowering of fuel consumption, reduction of accidents, greater comfort to the driver, less wearing of vehicle parts, which are factors that contribute to the preservation of roads as well. According to Martins et al. (2001), the increase in the proportion of roads with lower standard network quality increases road maintenance costs; it means that wooden shipment should prioritize roads with a higher standard quality in order to minimize the costs associated with the maintenance of highways.
According to results of this study and Oliveira Filho et al. (2005), and at the light of the definition of optimal transport routes, the criterion for determining the optimal transport route based on the operating performance of the vehicle can be a more efficient alternative in planning forestry transport and reducing costs in forestry companies.
5. CONCLUSION
The main findings of this study are listed below: • The use of geoprocessing technology, through Geographic Information Systems (GIS), allowed us to determine the road network pattern of the studied area, classifying it according to criteria of horizontal or vertical geometry, and pavement type.
• In Accordance with the present classification, the majority of roads (74.6%) were classified as average, and 9.6% as good and excellent for horizontal geometry index. In the classification regarding vertical geometry, 40.6% were classified as highly mountainous terrain. With relation to pavement, 74.9% of the roads were classified as uncoated and only 5% were classified as asphalted.
6. ACKNOWLEDGMENTS
This work was supported by Fundação de Amparo à Pesquisa do Estado de Minas Gerais (FAPEMIG), Conselho Nacional de Desenvolvimento Científico e Tecnológico (CNPq) and by Coordenação de Aperfeiçoamento de Pessoal de Nível Superior (CAPES).
7. REFERENCES
AKAY, A.E.; WING, M.G.; SIVRIKAYA, F.; SAKAR, D. A GIS-based decision support system for determining the shortest and safest route to forest fires: a case study in Mediterranean Region of Turkey. Environmental Monitoring and Assessment, v.184, n.3, p.1391-1407, 2012.
CAVALLI, R.; GRIGOLATO, S. Inûuence of characteristics and extension of a forest road network on the supply cost of forest woodchips. Journal of Forest Research, v.15, n.3, p.202-209, 2010.
DEVLIN, G.J.; MCDONNELL, K.; WARD, S. Timber haulage routing in Ireland: an analysis using GIS and GPS. Journal of Transport Geography, v.16, n.1, p.63-72, 2008.
ESRI. ArcGIS. Redlands: ArcGIS Desktop (software) Environmental Systems Research Institute, 2013.
Food and Agriculture Organization of the United Nations - FAO. Watershed management field manual: road design and construction in sensitive watersheds. Roma: 1998. Disponível em: www.fao.org/docrep/006/t0099e/
T0099e00.htm#cont.
HOLZLEITNER, F.; KANZIAN, C.; STAMPFER, K. Analyzing time and fuel consumption in road transport of round wood with an onboard ûeet manager. European Journal of Forest Research, v.130, n.2, p.293-301, 2011.
KEENAN, P. Modelling vehicle routing in GIS. Operational Research. v.8, n.3, p.201-218, 2008.
LOPES, E.S.; MACHADO, C.C.; SOUZA, A.P. Classificação e custos de estradas em florestas plantadas na região sudeste do Brasil. Revista Árvore, v.26, n.3, p.329-338, 2002.
MACHADO, C. C.; LOPES, E. S.; BIRRO, M. H. B.; MACHADO, R. R. Transporte Rodoviário Florestal. In: Transporte Rodoviário Florestal. 2.ed. Viçosa, MG: UFV, 2009. 217p.
MARTINS, A.M.; OWENDE, P.M.O.; HOLDEN, N.M.; WARD, S.M.; O’MAHONY, M.J. Designation of timber extraction routes in a GIS using road maintenance cost data. Forest Products Journal, v.51, n.10, p.32-38, 2001.
NIARAKI, A.S.; VARSHOSAZB, M.; KIM, K.; JUNG, J.J. Real world representation of a road network for route planning in GIS. Expert Systems with Applications, v.38, n.10, p.11999-12008, 2011
O’CONNOR, D. A network scan of horizontal road geometry. Cork: Irish Transport Research Network – ITRN, 2011.
OLIVEIRA FILHO, P.C.; LOPES, E.S.; MAGRAF, W.; DISPERATI, A. A. Determinação da rota ótima de transporte com auxílio de um sistema de informação geográfica. Ciência Florestal, v.15, n.4, p.403-409, 2005.
PALANDER, T.; VÄÄTÄINENB, J.; LAUKKANENB, S.; MALINENB, J. Modeling Backhauling on Finnish Energy-Wood Network Using Minimizing of Empty Routes. International Journal of Forest Engineering, v.15, n.2, p.79-84, 2013.
VALERIANO, M.M. Topodata: guia para utilização de dados geomorfológicos locais. São José dos Campos: INPE, 2008. 72p. (INPE-15318-RPR/818). Disponível em: http://urlib.net/